Immigrants from Ireland vs Tohono O'odham Poverty
COMPARE
Immigrants from Ireland
Tohono O'odham
Poverty
Poverty Comparison
Immigrants from Ireland
Tohono O'odham
10.1%
POVERTY
99.9/ 100
METRIC RATING
5th/ 347
METRIC RANK
24.4%
POVERTY
0.0/ 100
METRIC RATING
347th/ 347
METRIC RANK
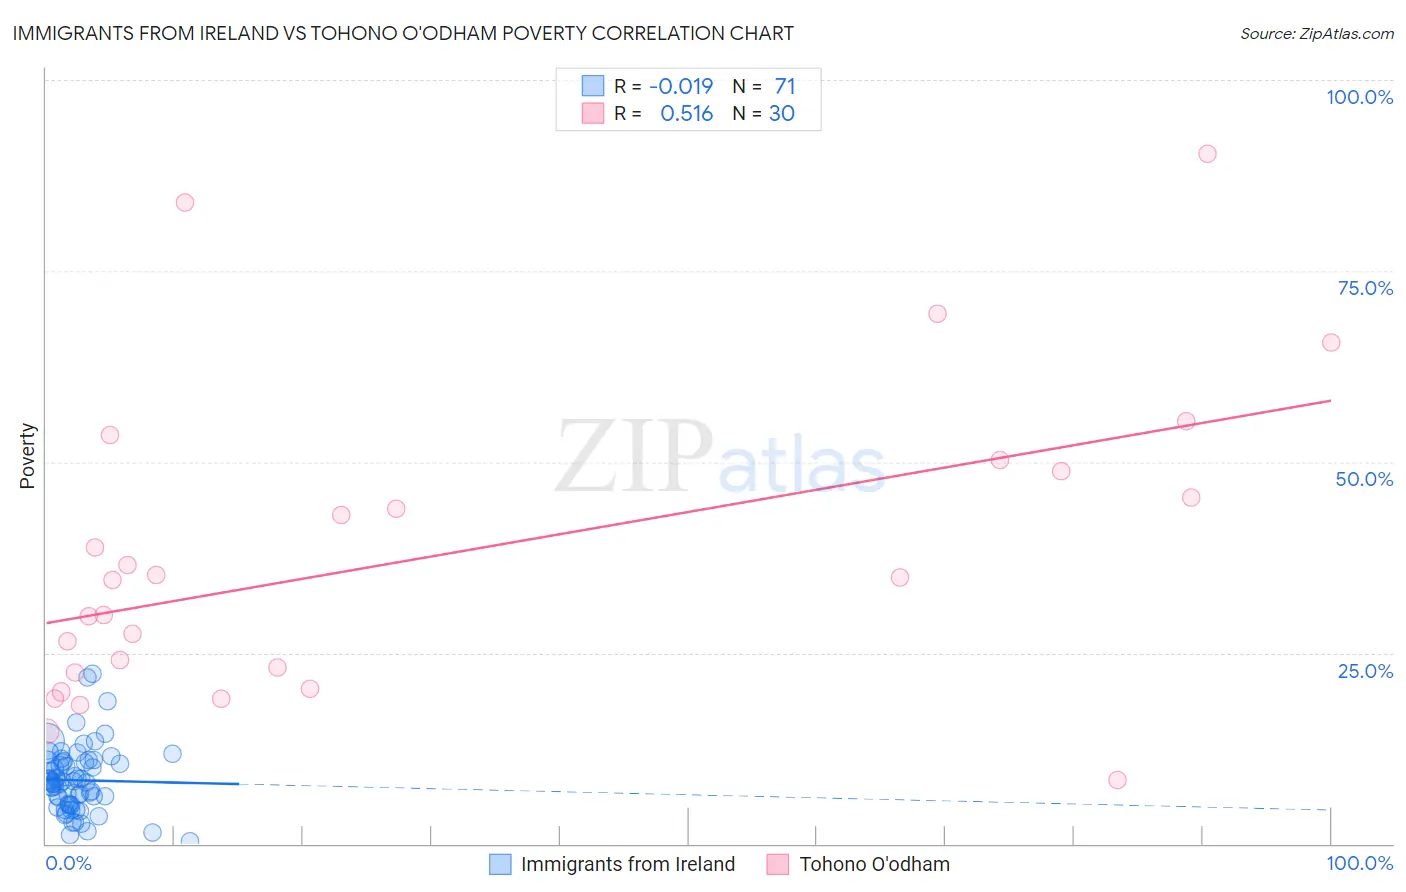
Immigrants from Ireland vs Tohono O'odham Poverty Correlation Chart
The statistical analysis conducted on geographies consisting of 240,745,110 people shows no correlation between the proportion of Immigrants from Ireland and poverty level in the United States with a correlation coefficient (R) of -0.019 and weighted average of 10.1%. Similarly, the statistical analysis conducted on geographies consisting of 58,718,506 people shows a substantial positive correlation between the proportion of Tohono O'odham and poverty level in the United States with a correlation coefficient (R) of 0.516 and weighted average of 24.4%, a difference of 141.9%.
Poverty Correlation Summary
| Measurement | Immigrants from Ireland | Tohono O'odham |
| Minimum | 0.31% | 8.3% |
| Maximum | 22.3% | 90.4% |
| Range | 22.0% | 82.0% |
| Mean | 8.3% | 37.7% |
| Median | 8.1% | 34.7% |
| Interquartile 25% (IQ1) | 5.1% | 22.4% |
| Interquartile 75% (IQ3) | 10.7% | 48.7% |
| Interquartile Range (IQR) | 5.6% | 26.3% |
| Standard Deviation (Sample) | 4.3% | 20.1% |
| Standard Deviation (Population) | 4.3% | 19.8% |
Similar Demographics by Poverty
Demographics Similar to Immigrants from Ireland by Poverty
In terms of poverty, the demographic groups most similar to Immigrants from Ireland are Assyrian/Chaldean/Syriac (10.1%, a difference of 0.18%), Filipino (10.1%, a difference of 0.32%), Maltese (10.2%, a difference of 0.74%), Immigrants from South Central Asia (10.2%, a difference of 1.2%), and Bulgarian (10.2%, a difference of 1.6%).
| Demographics | Rating | Rank | Poverty |
| Immigrants | India | 100.0 /100 | #1 | Exceptional 9.0% |
| Chinese | 100.0 /100 | #2 | Exceptional 9.5% |
| Thais | 100.0 /100 | #3 | Exceptional 9.6% |
| Immigrants | Taiwan | 100.0 /100 | #4 | Exceptional 9.7% |
| Immigrants | Ireland | 99.9 /100 | #5 | Exceptional 10.1% |
| Assyrians/Chaldeans/Syriacs | 99.9 /100 | #6 | Exceptional 10.1% |
| Filipinos | 99.9 /100 | #7 | Exceptional 10.1% |
| Maltese | 99.9 /100 | #8 | Exceptional 10.2% |
| Immigrants | South Central Asia | 99.9 /100 | #9 | Exceptional 10.2% |
| Bulgarians | 99.9 /100 | #10 | Exceptional 10.2% |
| Immigrants | Lithuania | 99.9 /100 | #11 | Exceptional 10.3% |
| Bhutanese | 99.8 /100 | #12 | Exceptional 10.4% |
| Immigrants | Hong Kong | 99.8 /100 | #13 | Exceptional 10.4% |
| Immigrants | Bolivia | 99.8 /100 | #14 | Exceptional 10.4% |
| Bolivians | 99.8 /100 | #15 | Exceptional 10.4% |
Demographics Similar to Tohono O'odham by Poverty
In terms of poverty, the demographic groups most similar to Tohono O'odham are Puerto Rican (23.7%, a difference of 3.1%), Navajo (23.1%, a difference of 5.7%), Lumbee (21.9%, a difference of 11.3%), Pima (21.9%, a difference of 11.6%), and Immigrants from Yemen (21.5%, a difference of 13.4%).
| Demographics | Rating | Rank | Poverty |
| Houma | 0.0 /100 | #333 | Tragic 18.4% |
| Apache | 0.0 /100 | #334 | Tragic 18.4% |
| Cheyenne | 0.0 /100 | #335 | Tragic 18.9% |
| Pueblo | 0.0 /100 | #336 | Tragic 19.4% |
| Sioux | 0.0 /100 | #337 | Tragic 19.8% |
| Yuman | 0.0 /100 | #338 | Tragic 20.2% |
| Crow | 0.0 /100 | #339 | Tragic 20.7% |
| Yup'ik | 0.0 /100 | #340 | Tragic 20.8% |
| Hopi | 0.0 /100 | #341 | Tragic 20.8% |
| Immigrants | Yemen | 0.0 /100 | #342 | Tragic 21.5% |
| Pima | 0.0 /100 | #343 | Tragic 21.9% |
| Lumbee | 0.0 /100 | #344 | Tragic 21.9% |
| Navajo | 0.0 /100 | #345 | Tragic 23.1% |
| Puerto Ricans | 0.0 /100 | #346 | Tragic 23.7% |
| Tohono O'odham | 0.0 /100 | #347 | Tragic 24.4% |