Immigrants from Ireland vs Trinidadian and Tobagonian Poverty
COMPARE
Immigrants from Ireland
Trinidadian and Tobagonian
Poverty
Poverty Comparison
Immigrants from Ireland
Trinidadians and Tobagonians
10.1%
POVERTY
99.9/ 100
METRIC RATING
5th/ 347
METRIC RANK
14.3%
POVERTY
0.1/ 100
METRIC RATING
257th/ 347
METRIC RANK
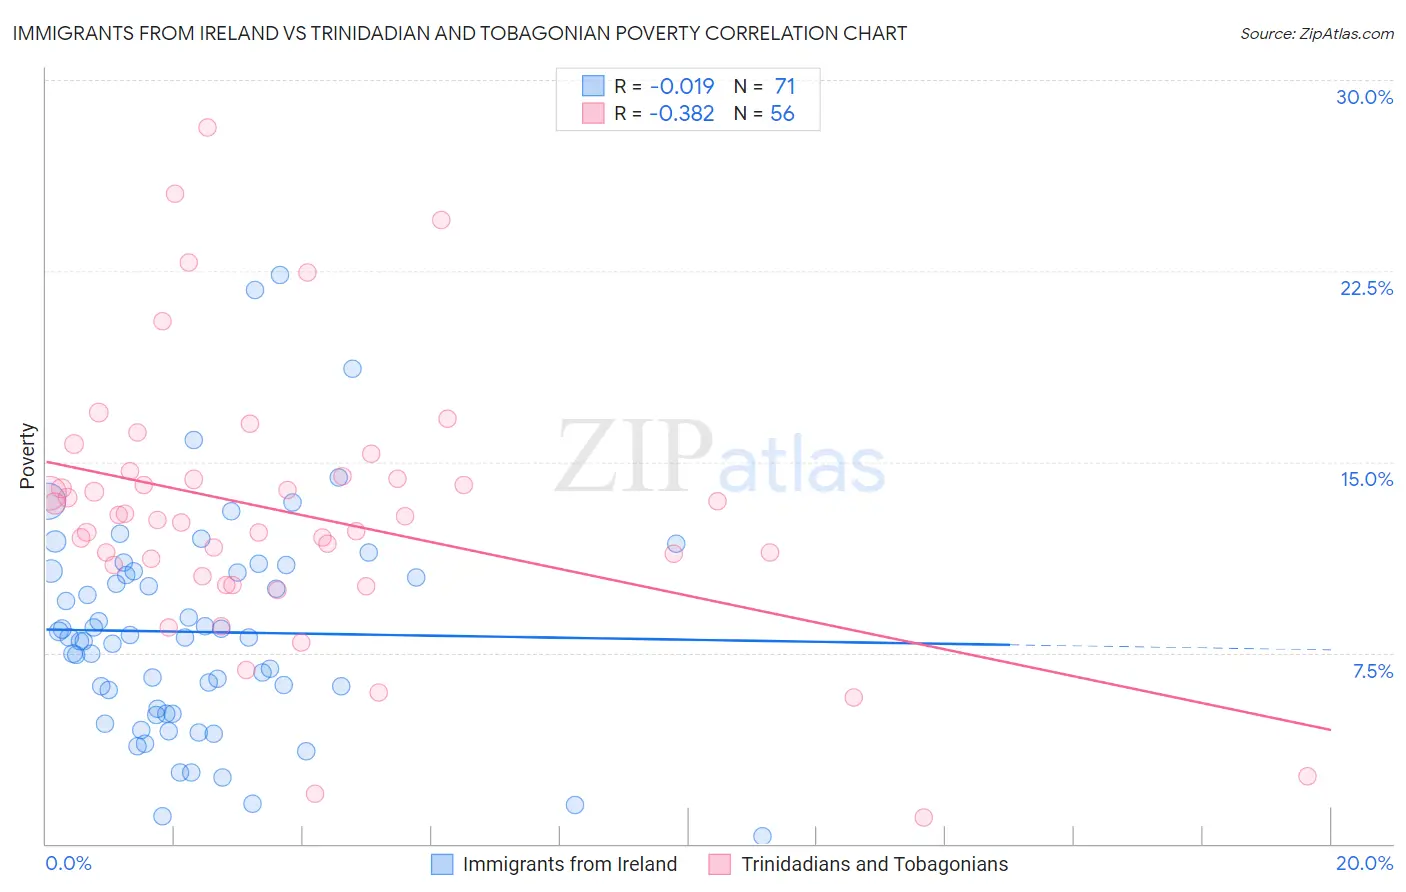
Immigrants from Ireland vs Trinidadian and Tobagonian Poverty Correlation Chart
The statistical analysis conducted on geographies consisting of 240,745,110 people shows no correlation between the proportion of Immigrants from Ireland and poverty level in the United States with a correlation coefficient (R) of -0.019 and weighted average of 10.1%. Similarly, the statistical analysis conducted on geographies consisting of 219,718,536 people shows a mild negative correlation between the proportion of Trinidadians and Tobagonians and poverty level in the United States with a correlation coefficient (R) of -0.382 and weighted average of 14.3%, a difference of 41.8%.
Poverty Correlation Summary
| Measurement | Immigrants from Ireland | Trinidadian and Tobagonian |
| Minimum | 0.31% | 1.0% |
| Maximum | 22.3% | 28.1% |
| Range | 22.0% | 27.1% |
| Mean | 8.3% | 13.0% |
| Median | 8.1% | 12.8% |
| Interquartile 25% (IQ1) | 5.1% | 10.7% |
| Interquartile 75% (IQ3) | 10.7% | 14.4% |
| Interquartile Range (IQR) | 5.6% | 3.7% |
| Standard Deviation (Sample) | 4.3% | 5.2% |
| Standard Deviation (Population) | 4.3% | 5.1% |
Similar Demographics by Poverty
Demographics Similar to Immigrants from Ireland by Poverty
In terms of poverty, the demographic groups most similar to Immigrants from Ireland are Assyrian/Chaldean/Syriac (10.1%, a difference of 0.18%), Filipino (10.1%, a difference of 0.32%), Maltese (10.2%, a difference of 0.74%), Immigrants from South Central Asia (10.2%, a difference of 1.2%), and Bulgarian (10.2%, a difference of 1.6%).
| Demographics | Rating | Rank | Poverty |
| Immigrants | India | 100.0 /100 | #1 | Exceptional 9.0% |
| Chinese | 100.0 /100 | #2 | Exceptional 9.5% |
| Thais | 100.0 /100 | #3 | Exceptional 9.6% |
| Immigrants | Taiwan | 100.0 /100 | #4 | Exceptional 9.7% |
| Immigrants | Ireland | 99.9 /100 | #5 | Exceptional 10.1% |
| Assyrians/Chaldeans/Syriacs | 99.9 /100 | #6 | Exceptional 10.1% |
| Filipinos | 99.9 /100 | #7 | Exceptional 10.1% |
| Maltese | 99.9 /100 | #8 | Exceptional 10.2% |
| Immigrants | South Central Asia | 99.9 /100 | #9 | Exceptional 10.2% |
| Bulgarians | 99.9 /100 | #10 | Exceptional 10.2% |
| Immigrants | Lithuania | 99.9 /100 | #11 | Exceptional 10.3% |
| Bhutanese | 99.8 /100 | #12 | Exceptional 10.4% |
| Immigrants | Hong Kong | 99.8 /100 | #13 | Exceptional 10.4% |
| Immigrants | Bolivia | 99.8 /100 | #14 | Exceptional 10.4% |
| Bolivians | 99.8 /100 | #15 | Exceptional 10.4% |
Demographics Similar to Trinidadians and Tobagonians by Poverty
In terms of poverty, the demographic groups most similar to Trinidadians and Tobagonians are Ottawa (14.3%, a difference of 0.010%), Mexican American Indian (14.3%, a difference of 0.040%), Immigrants from Ecuador (14.3%, a difference of 0.060%), Immigrants from El Salvador (14.3%, a difference of 0.16%), and Immigrants from Nicaragua (14.3%, a difference of 0.28%).
| Demographics | Rating | Rank | Poverty |
| Cree | 0.2 /100 | #250 | Tragic 14.2% |
| Immigrants | Burma/Myanmar | 0.2 /100 | #251 | Tragic 14.2% |
| Spanish American Indians | 0.2 /100 | #252 | Tragic 14.2% |
| Immigrants | Trinidad and Tobago | 0.2 /100 | #253 | Tragic 14.2% |
| Immigrants | El Salvador | 0.1 /100 | #254 | Tragic 14.3% |
| Immigrants | Ecuador | 0.1 /100 | #255 | Tragic 14.3% |
| Mexican American Indians | 0.1 /100 | #256 | Tragic 14.3% |
| Trinidadians and Tobagonians | 0.1 /100 | #257 | Tragic 14.3% |
| Ottawa | 0.1 /100 | #258 | Tragic 14.3% |
| Immigrants | Nicaragua | 0.1 /100 | #259 | Tragic 14.3% |
| Cape Verdeans | 0.1 /100 | #260 | Tragic 14.4% |
| Cherokee | 0.1 /100 | #261 | Tragic 14.4% |
| Immigrants | Liberia | 0.1 /100 | #262 | Tragic 14.4% |
| Jamaicans | 0.1 /100 | #263 | Tragic 14.4% |
| Immigrants | Jamaica | 0.1 /100 | #264 | Tragic 14.4% |