Immigrants from Ireland vs Arab Poverty
COMPARE
Immigrants from Ireland
Arab
Poverty
Poverty Comparison
Immigrants from Ireland
Arabs
10.1%
POVERTY
99.9/ 100
METRIC RATING
5th/ 347
METRIC RANK
12.7%
POVERTY
21.1/ 100
METRIC RATING
194th/ 347
METRIC RANK
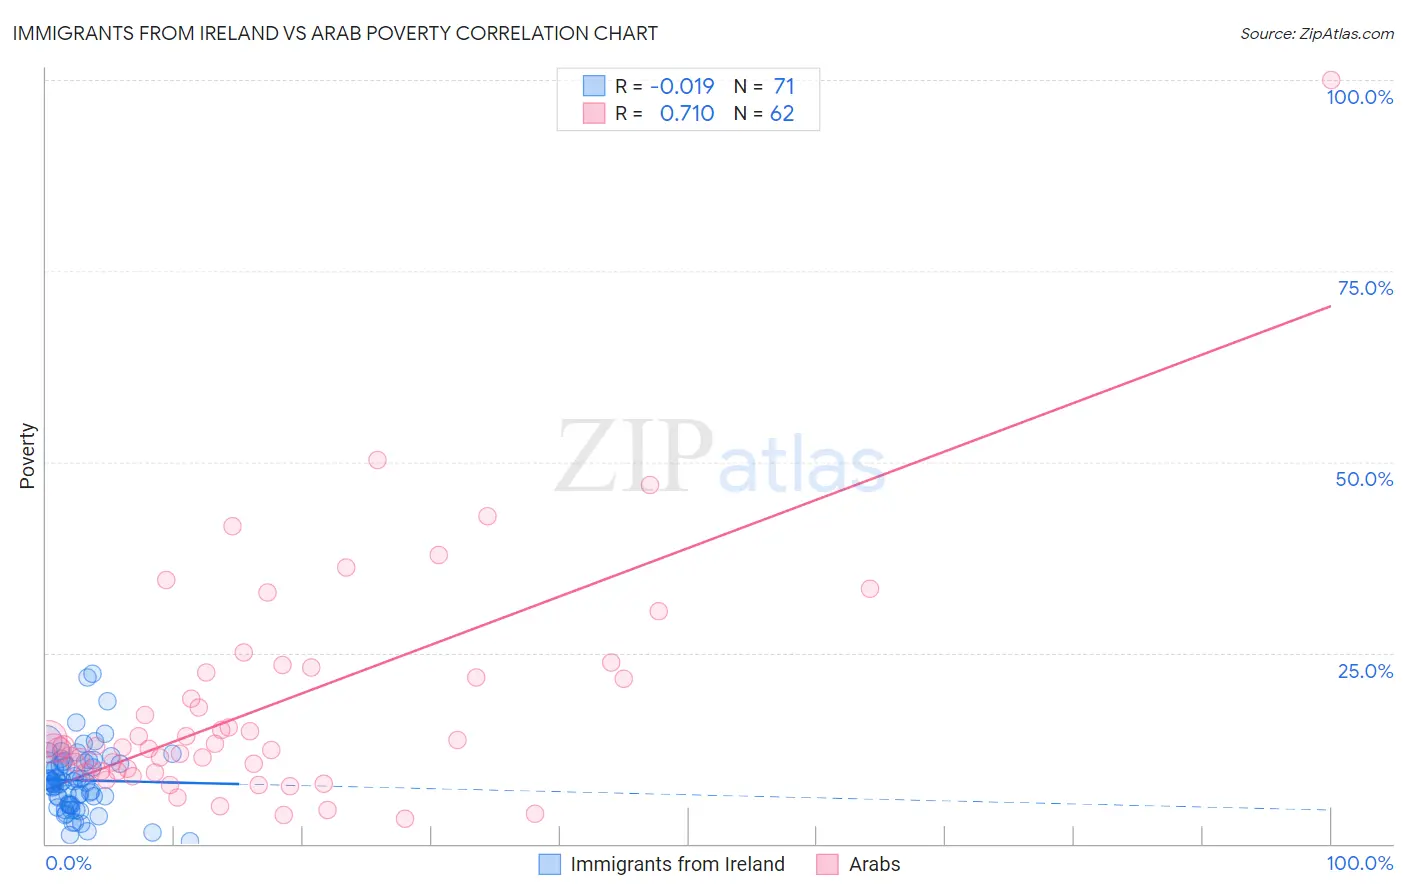
Immigrants from Ireland vs Arab Poverty Correlation Chart
The statistical analysis conducted on geographies consisting of 240,745,110 people shows no correlation between the proportion of Immigrants from Ireland and poverty level in the United States with a correlation coefficient (R) of -0.019 and weighted average of 10.1%. Similarly, the statistical analysis conducted on geographies consisting of 486,388,677 people shows a strong positive correlation between the proportion of Arabs and poverty level in the United States with a correlation coefficient (R) of 0.710 and weighted average of 12.7%, a difference of 26.1%.
Poverty Correlation Summary
| Measurement | Immigrants from Ireland | Arab |
| Minimum | 0.31% | 3.3% |
| Maximum | 22.3% | 100.0% |
| Range | 22.0% | 96.7% |
| Mean | 8.3% | 18.1% |
| Median | 8.1% | 12.7% |
| Interquartile 25% (IQ1) | 5.1% | 9.5% |
| Interquartile 75% (IQ3) | 10.7% | 22.3% |
| Interquartile Range (IQR) | 5.6% | 12.9% |
| Standard Deviation (Sample) | 4.3% | 15.4% |
| Standard Deviation (Population) | 4.3% | 15.3% |
Similar Demographics by Poverty
Demographics Similar to Immigrants from Ireland by Poverty
In terms of poverty, the demographic groups most similar to Immigrants from Ireland are Assyrian/Chaldean/Syriac (10.1%, a difference of 0.18%), Filipino (10.1%, a difference of 0.32%), Maltese (10.2%, a difference of 0.74%), Immigrants from South Central Asia (10.2%, a difference of 1.2%), and Bulgarian (10.2%, a difference of 1.6%).
| Demographics | Rating | Rank | Poverty |
| Immigrants | India | 100.0 /100 | #1 | Exceptional 9.0% |
| Chinese | 100.0 /100 | #2 | Exceptional 9.5% |
| Thais | 100.0 /100 | #3 | Exceptional 9.6% |
| Immigrants | Taiwan | 100.0 /100 | #4 | Exceptional 9.7% |
| Immigrants | Ireland | 99.9 /100 | #5 | Exceptional 10.1% |
| Assyrians/Chaldeans/Syriacs | 99.9 /100 | #6 | Exceptional 10.1% |
| Filipinos | 99.9 /100 | #7 | Exceptional 10.1% |
| Maltese | 99.9 /100 | #8 | Exceptional 10.2% |
| Immigrants | South Central Asia | 99.9 /100 | #9 | Exceptional 10.2% |
| Bulgarians | 99.9 /100 | #10 | Exceptional 10.2% |
| Immigrants | Lithuania | 99.9 /100 | #11 | Exceptional 10.3% |
| Bhutanese | 99.8 /100 | #12 | Exceptional 10.4% |
| Immigrants | Hong Kong | 99.8 /100 | #13 | Exceptional 10.4% |
| Immigrants | Bolivia | 99.8 /100 | #14 | Exceptional 10.4% |
| Bolivians | 99.8 /100 | #15 | Exceptional 10.4% |
Demographics Similar to Arabs by Poverty
In terms of poverty, the demographic groups most similar to Arabs are Immigrants from Kuwait (12.7%, a difference of 0.030%), Delaware (12.7%, a difference of 0.040%), Iraqi (12.7%, a difference of 0.050%), South American Indian (12.7%, a difference of 0.29%), and Immigrants from Lebanon (12.8%, a difference of 0.36%).
| Demographics | Rating | Rank | Poverty |
| Hawaiians | 34.1 /100 | #187 | Fair 12.5% |
| Immigrants | Costa Rica | 33.3 /100 | #188 | Fair 12.5% |
| Aleuts | 33.2 /100 | #189 | Fair 12.5% |
| Immigrants | South America | 32.3 /100 | #190 | Fair 12.5% |
| Sierra Leoneans | 31.5 /100 | #191 | Fair 12.6% |
| South American Indians | 23.3 /100 | #192 | Fair 12.7% |
| Delaware | 21.4 /100 | #193 | Fair 12.7% |
| Arabs | 21.1 /100 | #194 | Fair 12.7% |
| Immigrants | Kuwait | 20.9 /100 | #195 | Fair 12.7% |
| Iraqis | 20.8 /100 | #196 | Fair 12.7% |
| Immigrants | Lebanon | 18.7 /100 | #197 | Poor 12.8% |
| Spanish | 18.7 /100 | #198 | Poor 12.8% |
| Immigrants | Kenya | 17.5 /100 | #199 | Poor 12.8% |
| Spaniards | 16.5 /100 | #200 | Poor 12.8% |
| Immigrants | Uganda | 16.5 /100 | #201 | Poor 12.8% |