Immigrants from Ireland vs Immigrants from South America Poverty
COMPARE
Immigrants from Ireland
Immigrants from South America
Poverty
Poverty Comparison
Immigrants from Ireland
Immigrants from South America
10.1%
POVERTY
99.9/ 100
METRIC RATING
5th/ 347
METRIC RANK
12.5%
POVERTY
32.3/ 100
METRIC RATING
190th/ 347
METRIC RANK
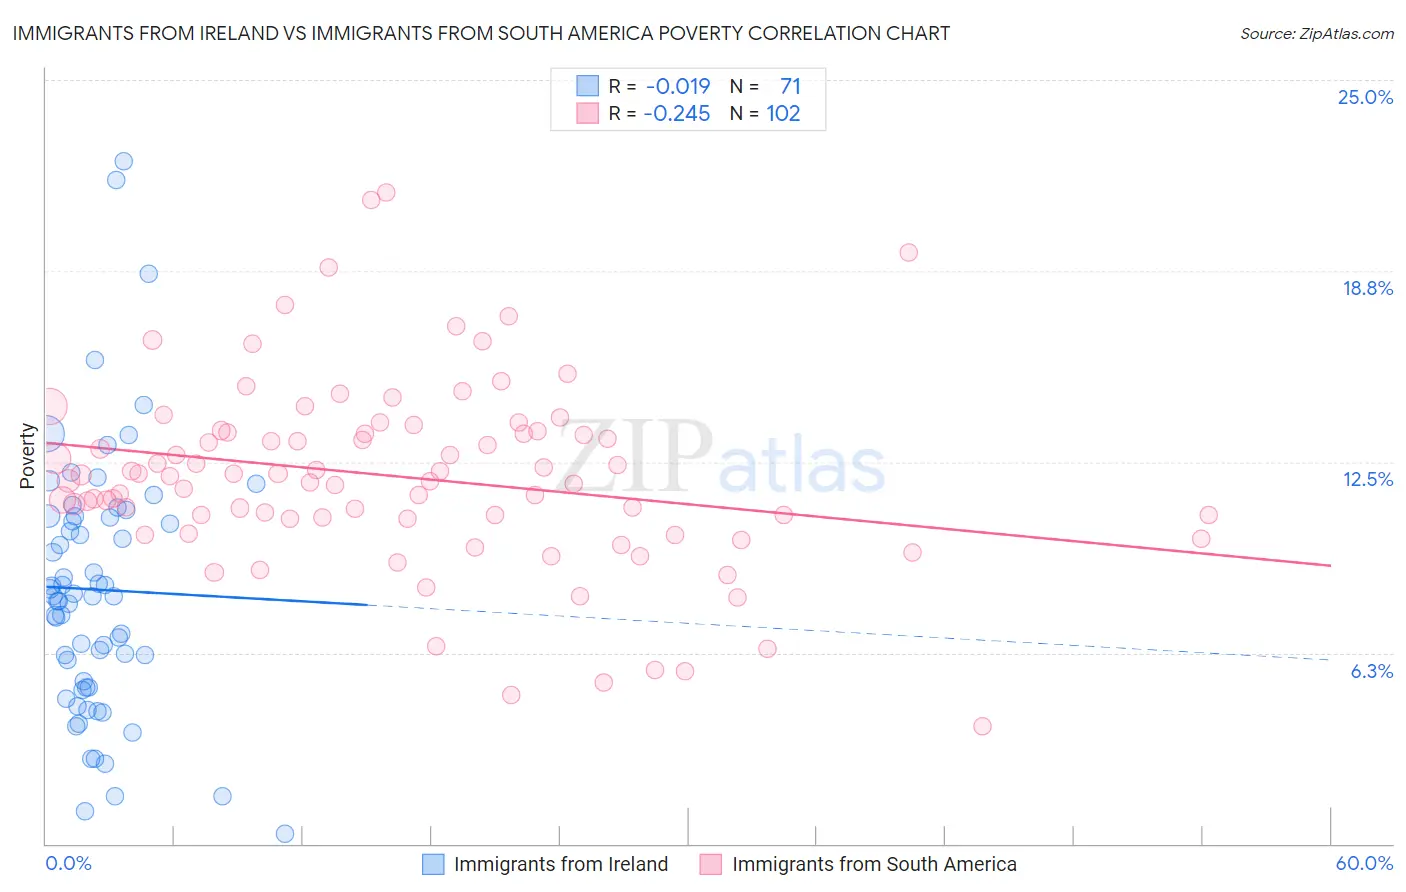
Immigrants from Ireland vs Immigrants from South America Poverty Correlation Chart
The statistical analysis conducted on geographies consisting of 240,745,110 people shows no correlation between the proportion of Immigrants from Ireland and poverty level in the United States with a correlation coefficient (R) of -0.019 and weighted average of 10.1%. Similarly, the statistical analysis conducted on geographies consisting of 485,968,788 people shows a weak negative correlation between the proportion of Immigrants from South America and poverty level in the United States with a correlation coefficient (R) of -0.245 and weighted average of 12.5%, a difference of 24.3%.
Poverty Correlation Summary
| Measurement | Immigrants from Ireland | Immigrants from South America |
| Minimum | 0.31% | 3.8% |
| Maximum | 22.3% | 21.3% |
| Range | 22.0% | 17.5% |
| Mean | 8.3% | 12.0% |
| Median | 8.1% | 12.0% |
| Interquartile 25% (IQ1) | 5.1% | 10.7% |
| Interquartile 75% (IQ3) | 10.7% | 13.5% |
| Interquartile Range (IQR) | 5.6% | 2.8% |
| Standard Deviation (Sample) | 4.3% | 3.1% |
| Standard Deviation (Population) | 4.3% | 3.1% |
Similar Demographics by Poverty
Demographics Similar to Immigrants from Ireland by Poverty
In terms of poverty, the demographic groups most similar to Immigrants from Ireland are Assyrian/Chaldean/Syriac (10.1%, a difference of 0.18%), Filipino (10.1%, a difference of 0.32%), Maltese (10.2%, a difference of 0.74%), Immigrants from South Central Asia (10.2%, a difference of 1.2%), and Bulgarian (10.2%, a difference of 1.6%).
| Demographics | Rating | Rank | Poverty |
| Immigrants | India | 100.0 /100 | #1 | Exceptional 9.0% |
| Chinese | 100.0 /100 | #2 | Exceptional 9.5% |
| Thais | 100.0 /100 | #3 | Exceptional 9.6% |
| Immigrants | Taiwan | 100.0 /100 | #4 | Exceptional 9.7% |
| Immigrants | Ireland | 99.9 /100 | #5 | Exceptional 10.1% |
| Assyrians/Chaldeans/Syriacs | 99.9 /100 | #6 | Exceptional 10.1% |
| Filipinos | 99.9 /100 | #7 | Exceptional 10.1% |
| Maltese | 99.9 /100 | #8 | Exceptional 10.2% |
| Immigrants | South Central Asia | 99.9 /100 | #9 | Exceptional 10.2% |
| Bulgarians | 99.9 /100 | #10 | Exceptional 10.2% |
| Immigrants | Lithuania | 99.9 /100 | #11 | Exceptional 10.3% |
| Bhutanese | 99.8 /100 | #12 | Exceptional 10.4% |
| Immigrants | Hong Kong | 99.8 /100 | #13 | Exceptional 10.4% |
| Immigrants | Bolivia | 99.8 /100 | #14 | Exceptional 10.4% |
| Bolivians | 99.8 /100 | #15 | Exceptional 10.4% |
Demographics Similar to Immigrants from South America by Poverty
In terms of poverty, the demographic groups most similar to Immigrants from South America are Aleut (12.5%, a difference of 0.090%), Immigrants from Costa Rica (12.5%, a difference of 0.10%), Sierra Leonean (12.6%, a difference of 0.10%), Hawaiian (12.5%, a difference of 0.19%), and Immigrants from Sierra Leone (12.5%, a difference of 0.41%).
| Demographics | Rating | Rank | Poverty |
| Immigrants | Iraq | 40.2 /100 | #183 | Average 12.4% |
| Kenyans | 38.8 /100 | #184 | Fair 12.5% |
| Israelis | 36.4 /100 | #185 | Fair 12.5% |
| Immigrants | Sierra Leone | 36.3 /100 | #186 | Fair 12.5% |
| Hawaiians | 34.1 /100 | #187 | Fair 12.5% |
| Immigrants | Costa Rica | 33.3 /100 | #188 | Fair 12.5% |
| Aleuts | 33.2 /100 | #189 | Fair 12.5% |
| Immigrants | South America | 32.3 /100 | #190 | Fair 12.5% |
| Sierra Leoneans | 31.5 /100 | #191 | Fair 12.6% |
| South American Indians | 23.3 /100 | #192 | Fair 12.7% |
| Delaware | 21.4 /100 | #193 | Fair 12.7% |
| Arabs | 21.1 /100 | #194 | Fair 12.7% |
| Immigrants | Kuwait | 20.9 /100 | #195 | Fair 12.7% |
| Iraqis | 20.8 /100 | #196 | Fair 12.7% |
| Immigrants | Lebanon | 18.7 /100 | #197 | Poor 12.8% |