Costa Rican vs Immigrants from Peru Poverty
COMPARE
Costa Rican
Immigrants from Peru
Poverty
Poverty Comparison
Costa Ricans
Immigrants from Peru
12.2%
POVERTY
62.2/ 100
METRIC RATING
157th/ 347
METRIC RANK
11.9%
POVERTY
81.1/ 100
METRIC RATING
140th/ 347
METRIC RANK
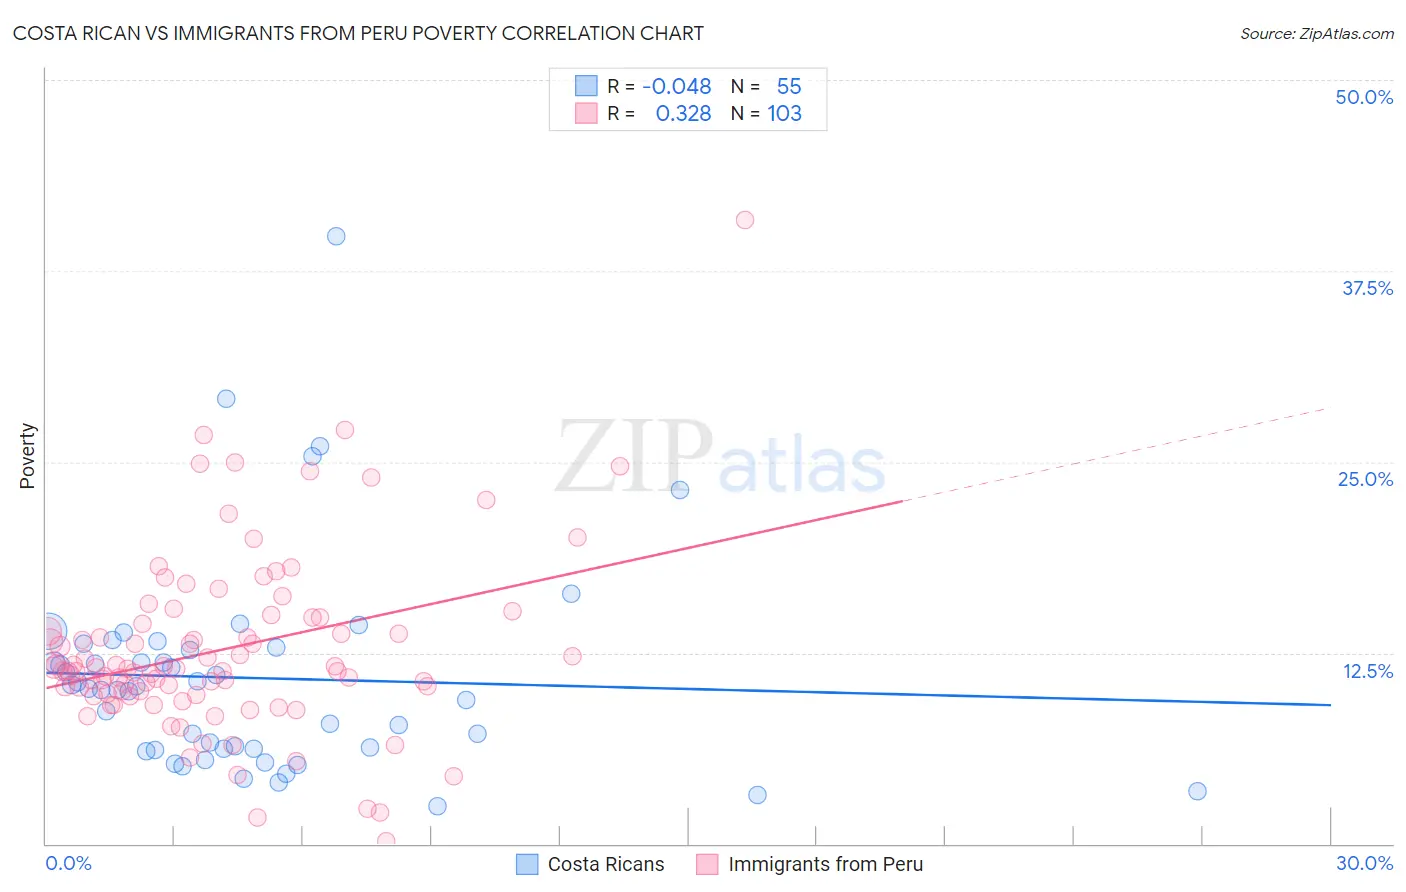
Costa Rican vs Immigrants from Peru Poverty Correlation Chart
The statistical analysis conducted on geographies consisting of 253,487,550 people shows no correlation between the proportion of Costa Ricans and poverty level in the United States with a correlation coefficient (R) of -0.048 and weighted average of 12.2%. Similarly, the statistical analysis conducted on geographies consisting of 328,758,820 people shows a mild positive correlation between the proportion of Immigrants from Peru and poverty level in the United States with a correlation coefficient (R) of 0.328 and weighted average of 11.9%, a difference of 2.4%.
Poverty Correlation Summary
| Measurement | Costa Rican | Immigrants from Peru |
| Minimum | 2.4% | 0.14% |
| Maximum | 39.8% | 40.8% |
| Range | 37.4% | 40.7% |
| Mean | 10.8% | 12.7% |
| Median | 10.2% | 11.4% |
| Interquartile 25% (IQ1) | 6.2% | 9.8% |
| Interquartile 75% (IQ3) | 12.8% | 14.8% |
| Interquartile Range (IQR) | 6.6% | 5.0% |
| Standard Deviation (Sample) | 6.9% | 5.9% |
| Standard Deviation (Population) | 6.8% | 5.9% |
Demographics Similar to Costa Ricans and Immigrants from Peru by Poverty
In terms of poverty, the demographic groups most similar to Costa Ricans are Scotch-Irish (12.2%, a difference of 0.040%), Taiwanese (12.2%, a difference of 0.040%), Hungarian (12.2%, a difference of 0.15%), Immigrants from Northern Africa (12.1%, a difference of 0.18%), and Guamanian/Chamorro (12.1%, a difference of 0.18%). Similarly, the demographic groups most similar to Immigrants from Peru are Immigrants from France (11.9%, a difference of 0.090%), Basque (11.9%, a difference of 0.11%), Pakistani (11.9%, a difference of 0.19%), Immigrants from Jordan (11.9%, a difference of 0.22%), and Brazilian (11.9%, a difference of 0.22%).
| Demographics | Rating | Rank | Poverty |
| Immigrants | Jordan | 82.4 /100 | #138 | Excellent 11.9% |
| Pakistanis | 82.2 /100 | #139 | Excellent 11.9% |
| Immigrants | Peru | 81.1 /100 | #140 | Excellent 11.9% |
| Immigrants | France | 80.5 /100 | #141 | Excellent 11.9% |
| Basques | 80.4 /100 | #142 | Excellent 11.9% |
| Brazilians | 79.7 /100 | #143 | Good 11.9% |
| Icelanders | 77.9 /100 | #144 | Good 11.9% |
| Syrians | 75.1 /100 | #145 | Good 12.0% |
| Afghans | 74.9 /100 | #146 | Good 12.0% |
| Immigrants | Bosnia and Herzegovina | 73.7 /100 | #147 | Good 12.0% |
| Immigrants | Germany | 72.7 /100 | #148 | Good 12.0% |
| Immigrants | Malaysia | 72.7 /100 | #149 | Good 12.0% |
| Immigrants | Kazakhstan | 72.3 /100 | #150 | Good 12.0% |
| Samoans | 71.9 /100 | #151 | Good 12.0% |
| Armenians | 67.6 /100 | #152 | Good 12.1% |
| Immigrants | Northern Africa | 63.9 /100 | #153 | Good 12.1% |
| Guamanians/Chamorros | 63.9 /100 | #154 | Good 12.1% |
| Hungarians | 63.6 /100 | #155 | Good 12.2% |
| Scotch-Irish | 62.6 /100 | #156 | Good 12.2% |
| Costa Ricans | 62.2 /100 | #157 | Good 12.2% |
| Taiwanese | 61.8 /100 | #158 | Good 12.2% |