Immigrants from Haiti vs Czech In Labor Force | Age 20-24
COMPARE
Immigrants from Haiti
Czech
In Labor Force | Age 20-24
In Labor Force | Age 20-24 Comparison
Immigrants from Haiti
Czechs
73.6%
IN LABOR FORCE | AGE 20-24
0.5/ 100
METRIC RATING
264th/ 347
METRIC RANK
78.5%
IN LABOR FORCE | AGE 20-24
100.0/ 100
METRIC RATING
14th/ 347
METRIC RANK
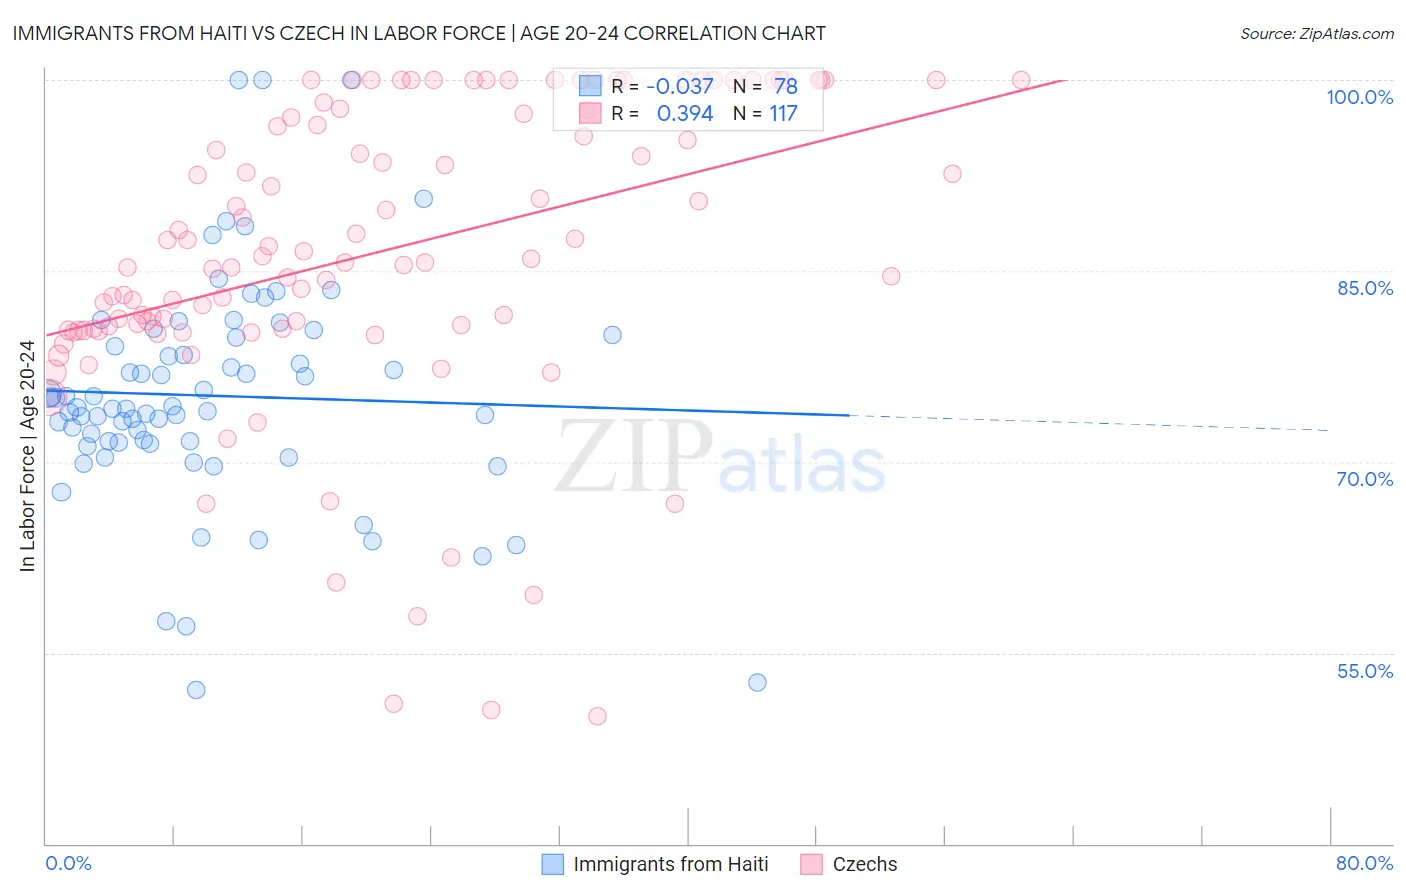
Immigrants from Haiti vs Czech In Labor Force | Age 20-24 Correlation Chart
The statistical analysis conducted on geographies consisting of 225,234,357 people shows no correlation between the proportion of Immigrants from Haiti and labor force participation rate among population between the ages 20 and 24 in the United States with a correlation coefficient (R) of -0.037 and weighted average of 73.6%. Similarly, the statistical analysis conducted on geographies consisting of 484,256,117 people shows a mild positive correlation between the proportion of Czechs and labor force participation rate among population between the ages 20 and 24 in the United States with a correlation coefficient (R) of 0.394 and weighted average of 78.5%, a difference of 6.7%.
In Labor Force | Age 20-24 Correlation Summary
| Measurement | Immigrants from Haiti | Czech |
| Minimum | 52.0% | 50.0% |
| Maximum | 100.0% | 100.0% |
| Range | 48.0% | 50.0% |
| Mean | 75.2% | 86.5% |
| Median | 74.2% | 85.9% |
| Interquartile 25% (IQ1) | 71.5% | 80.4% |
| Interquartile 75% (IQ3) | 79.8% | 97.7% |
| Interquartile Range (IQR) | 8.3% | 17.3% |
| Standard Deviation (Sample) | 8.9% | 11.8% |
| Standard Deviation (Population) | 8.8% | 11.7% |
Similar Demographics by In Labor Force | Age 20-24
Demographics Similar to Immigrants from Haiti by In Labor Force | Age 20-24
In terms of in labor force | age 20-24, the demographic groups most similar to Immigrants from Haiti are Immigrants from Asia (73.6%, a difference of 0.010%), Burmese (73.6%, a difference of 0.010%), Haitian (73.6%, a difference of 0.020%), Immigrants from Western Asia (73.5%, a difference of 0.050%), and Asian (73.7%, a difference of 0.090%).
| Demographics | Rating | Rank | In Labor Force | Age 20-24 |
| Paraguayans | 0.8 /100 | #257 | Tragic 73.7% |
| Egyptians | 0.7 /100 | #258 | Tragic 73.7% |
| Dutch West Indians | 0.7 /100 | #259 | Tragic 73.7% |
| Immigrants | Turkey | 0.7 /100 | #260 | Tragic 73.7% |
| Houma | 0.6 /100 | #261 | Tragic 73.7% |
| Asians | 0.6 /100 | #262 | Tragic 73.7% |
| Immigrants | Asia | 0.5 /100 | #263 | Tragic 73.6% |
| Immigrants | Haiti | 0.5 /100 | #264 | Tragic 73.6% |
| Burmese | 0.5 /100 | #265 | Tragic 73.6% |
| Haitians | 0.5 /100 | #266 | Tragic 73.6% |
| Immigrants | Western Asia | 0.4 /100 | #267 | Tragic 73.5% |
| South Americans | 0.4 /100 | #268 | Tragic 73.5% |
| Colombians | 0.3 /100 | #269 | Tragic 73.5% |
| Immigrants | Russia | 0.3 /100 | #270 | Tragic 73.5% |
| Immigrants | Indonesia | 0.3 /100 | #271 | Tragic 73.4% |
Demographics Similar to Czechs by In Labor Force | Age 20-24
In terms of in labor force | age 20-24, the demographic groups most similar to Czechs are Scandinavian (78.5%, a difference of 0.010%), German (78.6%, a difference of 0.070%), Sudanese (78.4%, a difference of 0.13%), Dutch (78.4%, a difference of 0.18%), and Finnish (78.7%, a difference of 0.19%).
| Demographics | Rating | Rank | In Labor Force | Age 20-24 |
| Luxembourgers | 100.0 /100 | #7 | Exceptional 79.0% |
| Immigrants | Cabo Verde | 100.0 /100 | #8 | Exceptional 78.9% |
| Swedes | 100.0 /100 | #9 | Exceptional 78.8% |
| Slovenes | 100.0 /100 | #10 | Exceptional 78.7% |
| Finns | 100.0 /100 | #11 | Exceptional 78.7% |
| Germans | 100.0 /100 | #12 | Exceptional 78.6% |
| Scandinavians | 100.0 /100 | #13 | Exceptional 78.5% |
| Czechs | 100.0 /100 | #14 | Exceptional 78.5% |
| Sudanese | 100.0 /100 | #15 | Exceptional 78.4% |
| Dutch | 100.0 /100 | #16 | Exceptional 78.4% |
| Cape Verdeans | 100.0 /100 | #17 | Exceptional 78.3% |
| Immigrants | Bosnia and Herzegovina | 100.0 /100 | #18 | Exceptional 78.1% |
| Bangladeshis | 100.0 /100 | #19 | Exceptional 78.1% |
| French Canadians | 100.0 /100 | #20 | Exceptional 78.1% |
| Puget Sound Salish | 100.0 /100 | #21 | Exceptional 78.0% |