Immigrants from Cameroon vs Asian Married-Couple Family Poverty
COMPARE
Immigrants from Cameroon
Asian
Married-Couple Family Poverty
Married-Couple Family Poverty Comparison
Immigrants from Cameroon
Asians
5.0%
MARRIED-COUPLE FAMILY POVERTY
77.3/ 100
METRIC RATING
151st/ 347
METRIC RANK
4.7%
MARRIED-COUPLE FAMILY POVERTY
97.6/ 100
METRIC RATING
102nd/ 347
METRIC RANK
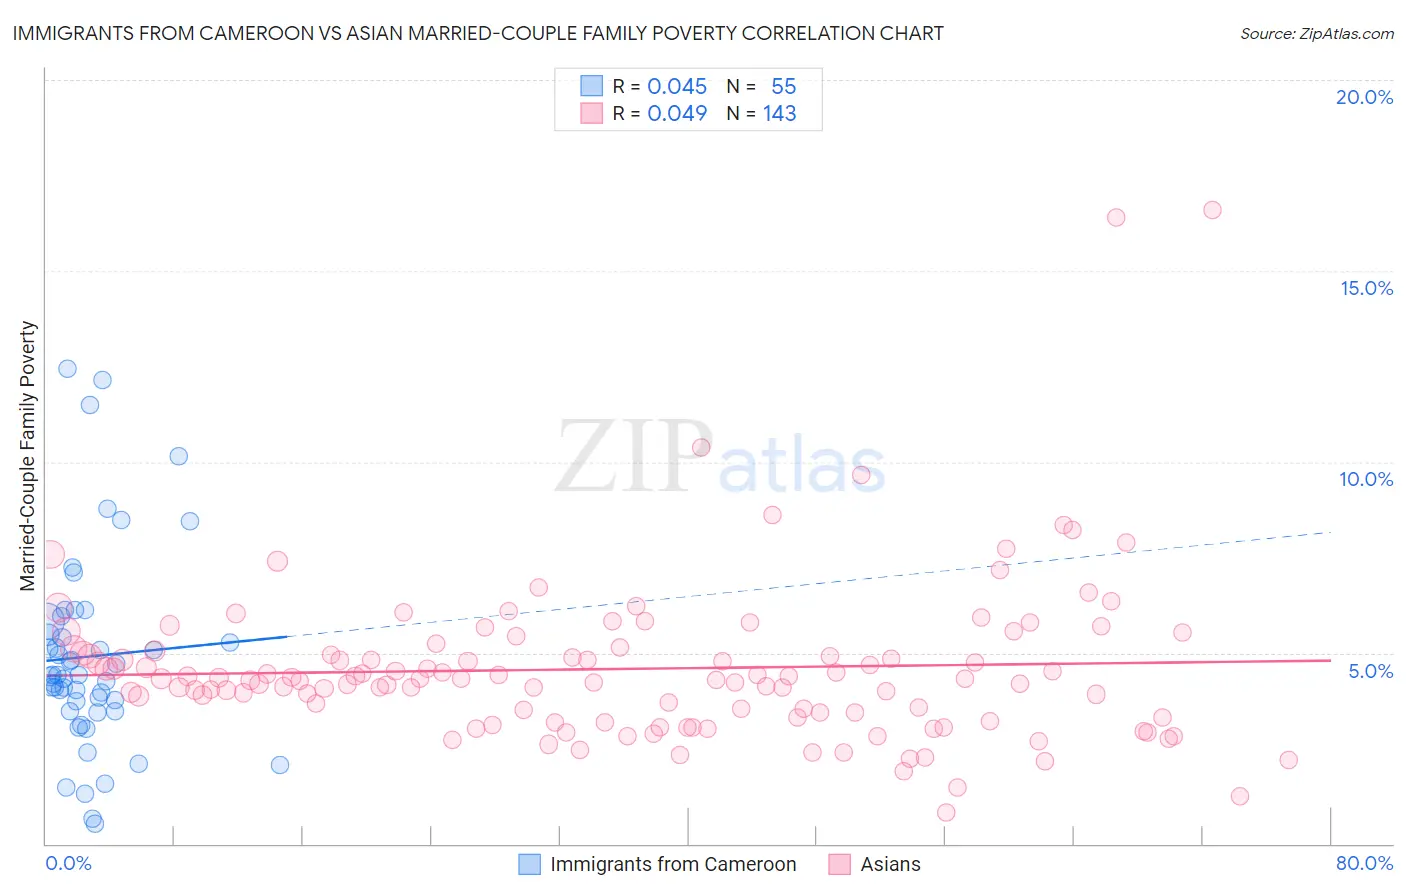
Immigrants from Cameroon vs Asian Married-Couple Family Poverty Correlation Chart
The statistical analysis conducted on geographies consisting of 130,410,989 people shows no correlation between the proportion of Immigrants from Cameroon and poverty level among married-couple families in the United States with a correlation coefficient (R) of 0.045 and weighted average of 5.0%. Similarly, the statistical analysis conducted on geographies consisting of 539,455,145 people shows no correlation between the proportion of Asians and poverty level among married-couple families in the United States with a correlation coefficient (R) of 0.049 and weighted average of 4.7%, a difference of 8.0%.
Married-Couple Family Poverty Correlation Summary
| Measurement | Immigrants from Cameroon | Asian |
| Minimum | 0.51% | 0.82% |
| Maximum | 12.4% | 16.6% |
| Range | 11.9% | 15.8% |
| Mean | 4.9% | 4.6% |
| Median | 4.4% | 4.3% |
| Interquartile 25% (IQ1) | 3.5% | 3.3% |
| Interquartile 75% (IQ3) | 5.8% | 5.1% |
| Interquartile Range (IQR) | 2.3% | 1.7% |
| Standard Deviation (Sample) | 2.6% | 2.1% |
| Standard Deviation (Population) | 2.6% | 2.1% |
Similar Demographics by Married-Couple Family Poverty
Demographics Similar to Immigrants from Cameroon by Married-Couple Family Poverty
In terms of married-couple family poverty, the demographic groups most similar to Immigrants from Cameroon are Albanian (5.0%, a difference of 0.010%), Immigrants from Kuwait (5.0%, a difference of 0.16%), Brazilian (5.0%, a difference of 0.17%), Immigrants from Oceania (5.0%, a difference of 0.23%), and Syrian (5.0%, a difference of 0.25%).
| Demographics | Rating | Rank | Married-Couple Family Poverty |
| Hmong | 83.2 /100 | #144 | Excellent 5.0% |
| Immigrants | Spain | 79.9 /100 | #145 | Good 5.0% |
| Mongolians | 79.8 /100 | #146 | Good 5.0% |
| Syrians | 78.7 /100 | #147 | Good 5.0% |
| Immigrants | Russia | 78.7 /100 | #148 | Good 5.0% |
| Immigrants | Oceania | 78.6 /100 | #149 | Good 5.0% |
| Brazilians | 78.3 /100 | #150 | Good 5.0% |
| Immigrants | Cameroon | 77.3 /100 | #151 | Good 5.0% |
| Albanians | 77.2 /100 | #152 | Good 5.0% |
| Immigrants | Kuwait | 76.3 /100 | #153 | Good 5.0% |
| Delaware | 73.7 /100 | #154 | Good 5.1% |
| Immigrants | Ethiopia | 72.4 /100 | #155 | Good 5.1% |
| Sri Lankans | 72.2 /100 | #156 | Good 5.1% |
| Argentineans | 70.7 /100 | #157 | Good 5.1% |
| Immigrants | South Eastern Asia | 70.4 /100 | #158 | Good 5.1% |
Demographics Similar to Asians by Married-Couple Family Poverty
In terms of married-couple family poverty, the demographic groups most similar to Asians are Immigrants from Romania (4.7%, a difference of 0.29%), Yugoslavian (4.6%, a difference of 0.40%), Immigrants from Western Europe (4.6%, a difference of 0.42%), Immigrants from Europe (4.6%, a difference of 0.53%), and Immigrants from Moldova (4.7%, a difference of 0.63%).
| Demographics | Rating | Rank | Married-Couple Family Poverty |
| Portuguese | 98.3 /100 | #95 | Exceptional 4.6% |
| Immigrants | Poland | 98.3 /100 | #96 | Exceptional 4.6% |
| Immigrants | Belgium | 98.2 /100 | #97 | Exceptional 4.6% |
| Native Hawaiians | 98.0 /100 | #98 | Exceptional 4.6% |
| Immigrants | Europe | 97.9 /100 | #99 | Exceptional 4.6% |
| Immigrants | Western Europe | 97.9 /100 | #100 | Exceptional 4.6% |
| Yugoslavians | 97.8 /100 | #101 | Exceptional 4.6% |
| Asians | 97.6 /100 | #102 | Exceptional 4.7% |
| Immigrants | Romania | 97.3 /100 | #103 | Exceptional 4.7% |
| Immigrants | Moldova | 97.1 /100 | #104 | Exceptional 4.7% |
| Aleuts | 97.0 /100 | #105 | Exceptional 4.7% |
| Immigrants | France | 96.9 /100 | #106 | Exceptional 4.7% |
| Immigrants | Germany | 96.8 /100 | #107 | Exceptional 4.7% |
| Laotians | 96.6 /100 | #108 | Exceptional 4.7% |
| Immigrants | Hong Kong | 96.4 /100 | #109 | Exceptional 4.7% |