Immigrants from Cameroon vs Immigrants from Nicaragua Married-Couple Family Poverty
COMPARE
Immigrants from Cameroon
Immigrants from Nicaragua
Married-Couple Family Poverty
Married-Couple Family Poverty Comparison
Immigrants from Cameroon
Immigrants from Nicaragua
5.0%
MARRIED-COUPLE FAMILY POVERTY
77.3/ 100
METRIC RATING
151st/ 347
METRIC RANK
7.1%
MARRIED-COUPLE FAMILY POVERTY
0.0/ 100
METRIC RATING
310th/ 347
METRIC RANK
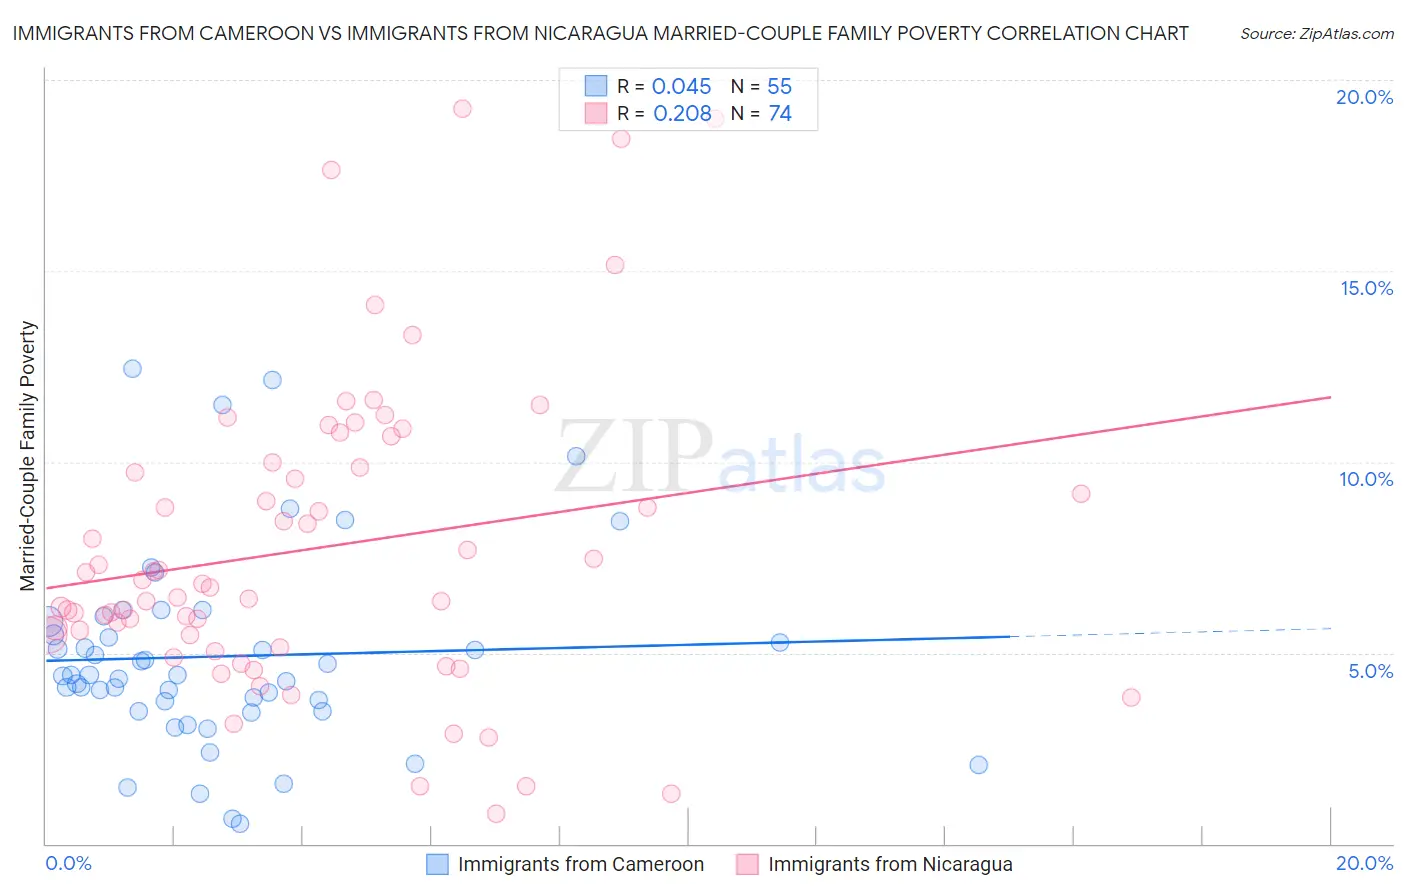
Immigrants from Cameroon vs Immigrants from Nicaragua Married-Couple Family Poverty Correlation Chart
The statistical analysis conducted on geographies consisting of 130,410,989 people shows no correlation between the proportion of Immigrants from Cameroon and poverty level among married-couple families in the United States with a correlation coefficient (R) of 0.045 and weighted average of 5.0%. Similarly, the statistical analysis conducted on geographies consisting of 235,581,482 people shows a weak positive correlation between the proportion of Immigrants from Nicaragua and poverty level among married-couple families in the United States with a correlation coefficient (R) of 0.208 and weighted average of 7.1%, a difference of 40.9%.
Married-Couple Family Poverty Correlation Summary
| Measurement | Immigrants from Cameroon | Immigrants from Nicaragua |
| Minimum | 0.51% | 0.79% |
| Maximum | 12.4% | 19.2% |
| Range | 11.9% | 18.4% |
| Mean | 4.9% | 7.7% |
| Median | 4.4% | 6.8% |
| Interquartile 25% (IQ1) | 3.5% | 5.5% |
| Interquartile 75% (IQ3) | 5.8% | 9.9% |
| Interquartile Range (IQR) | 2.3% | 4.4% |
| Standard Deviation (Sample) | 2.6% | 4.0% |
| Standard Deviation (Population) | 2.6% | 3.9% |
Similar Demographics by Married-Couple Family Poverty
Demographics Similar to Immigrants from Cameroon by Married-Couple Family Poverty
In terms of married-couple family poverty, the demographic groups most similar to Immigrants from Cameroon are Albanian (5.0%, a difference of 0.010%), Immigrants from Kuwait (5.0%, a difference of 0.16%), Brazilian (5.0%, a difference of 0.17%), Immigrants from Oceania (5.0%, a difference of 0.23%), and Syrian (5.0%, a difference of 0.25%).
| Demographics | Rating | Rank | Married-Couple Family Poverty |
| Hmong | 83.2 /100 | #144 | Excellent 5.0% |
| Immigrants | Spain | 79.9 /100 | #145 | Good 5.0% |
| Mongolians | 79.8 /100 | #146 | Good 5.0% |
| Syrians | 78.7 /100 | #147 | Good 5.0% |
| Immigrants | Russia | 78.7 /100 | #148 | Good 5.0% |
| Immigrants | Oceania | 78.6 /100 | #149 | Good 5.0% |
| Brazilians | 78.3 /100 | #150 | Good 5.0% |
| Immigrants | Cameroon | 77.3 /100 | #151 | Good 5.0% |
| Albanians | 77.2 /100 | #152 | Good 5.0% |
| Immigrants | Kuwait | 76.3 /100 | #153 | Good 5.0% |
| Delaware | 73.7 /100 | #154 | Good 5.1% |
| Immigrants | Ethiopia | 72.4 /100 | #155 | Good 5.1% |
| Sri Lankans | 72.2 /100 | #156 | Good 5.1% |
| Argentineans | 70.7 /100 | #157 | Good 5.1% |
| Immigrants | South Eastern Asia | 70.4 /100 | #158 | Good 5.1% |
Demographics Similar to Immigrants from Nicaragua by Married-Couple Family Poverty
In terms of married-couple family poverty, the demographic groups most similar to Immigrants from Nicaragua are Hopi (7.1%, a difference of 0.030%), Immigrants from Dominica (7.1%, a difference of 0.050%), Immigrants from Armenia (7.1%, a difference of 0.050%), Immigrants from St. Vincent and the Grenadines (7.1%, a difference of 0.17%), and British West Indian (7.1%, a difference of 0.47%).
| Demographics | Rating | Rank | Married-Couple Family Poverty |
| Immigrants | El Salvador | 0.0 /100 | #303 | Tragic 6.8% |
| Cubans | 0.0 /100 | #304 | Tragic 6.8% |
| Haitians | 0.0 /100 | #305 | Tragic 6.8% |
| Immigrants | Haiti | 0.0 /100 | #306 | Tragic 7.0% |
| Guatemalans | 0.0 /100 | #307 | Tragic 7.0% |
| Spanish American Indians | 0.0 /100 | #308 | Tragic 7.1% |
| Hopi | 0.0 /100 | #309 | Tragic 7.1% |
| Immigrants | Nicaragua | 0.0 /100 | #310 | Tragic 7.1% |
| Immigrants | Dominica | 0.0 /100 | #311 | Tragic 7.1% |
| Immigrants | Armenia | 0.0 /100 | #312 | Tragic 7.1% |
| Immigrants | St. Vincent and the Grenadines | 0.0 /100 | #313 | Tragic 7.1% |
| British West Indians | 0.0 /100 | #314 | Tragic 7.1% |
| Inupiat | 0.0 /100 | #315 | Tragic 7.1% |
| Hondurans | 0.0 /100 | #316 | Tragic 7.2% |
| Mexicans | 0.0 /100 | #317 | Tragic 7.2% |