Arab vs Comanche Female Poverty
COMPARE
Arab
Comanche
Female Poverty
Female Poverty Comparison
Arabs
Comanche
13.7%
FEMALE POVERTY
28.6/ 100
METRIC RATING
197th/ 347
METRIC RANK
16.2%
FEMALE POVERTY
0.0/ 100
METRIC RATING
285th/ 347
METRIC RANK
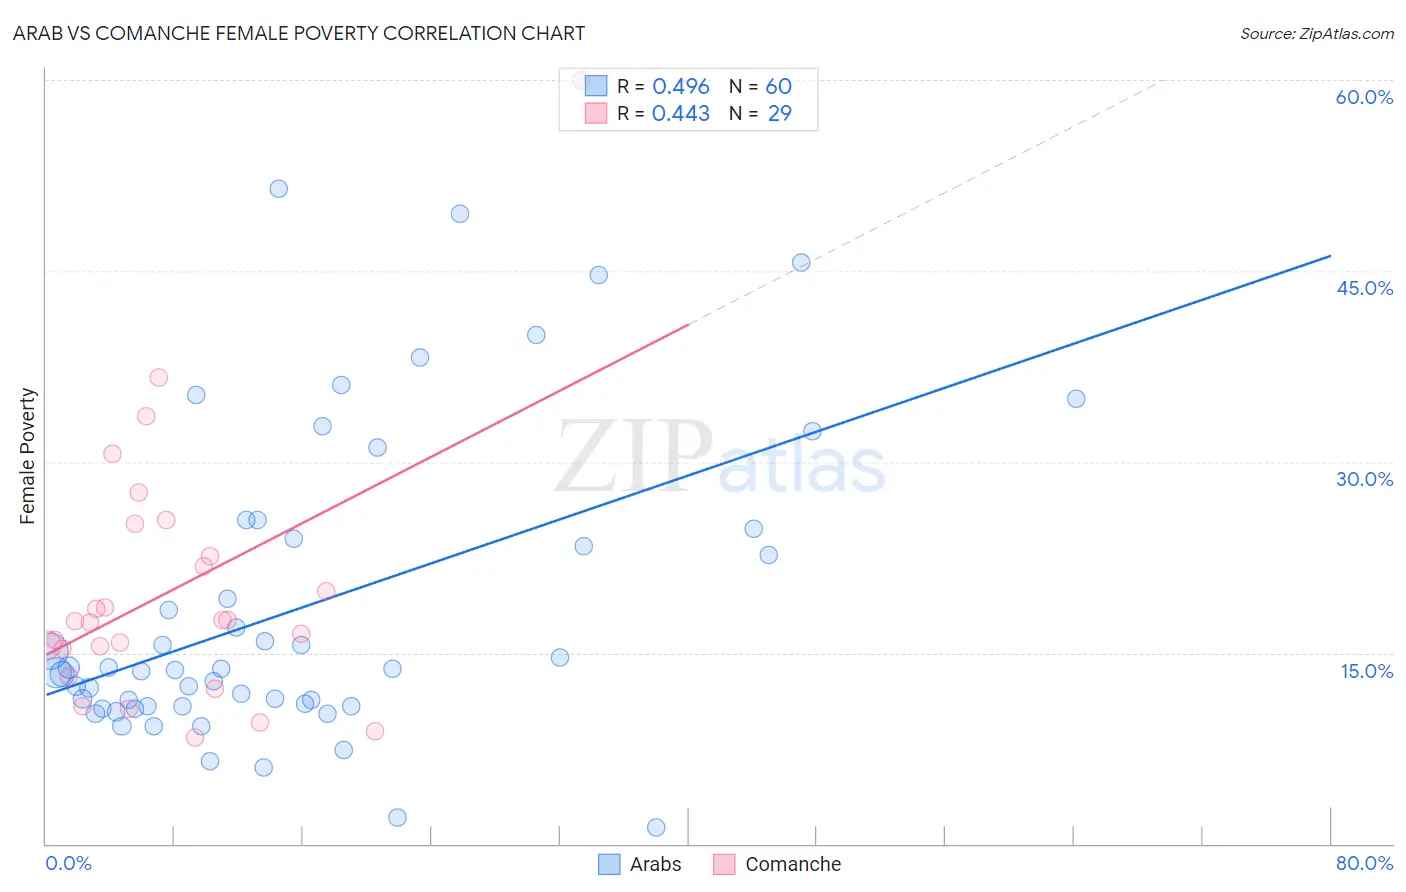
Arab vs Comanche Female Poverty Correlation Chart
The statistical analysis conducted on geographies consisting of 486,246,115 people shows a moderate positive correlation between the proportion of Arabs and poverty level among females in the United States with a correlation coefficient (R) of 0.496 and weighted average of 13.7%. Similarly, the statistical analysis conducted on geographies consisting of 109,749,855 people shows a moderate positive correlation between the proportion of Comanche and poverty level among females in the United States with a correlation coefficient (R) of 0.443 and weighted average of 16.2%, a difference of 17.7%.
Female Poverty Correlation Summary
| Measurement | Arab | Comanche |
| Minimum | 1.3% | 8.4% |
| Maximum | 51.5% | 60.0% |
| Range | 50.2% | 51.6% |
| Mean | 18.5% | 20.0% |
| Median | 13.7% | 17.4% |
| Interquartile 25% (IQ1) | 10.8% | 14.3% |
| Interquartile 75% (IQ3) | 24.3% | 23.9% |
| Interquartile Range (IQR) | 13.5% | 9.6% |
| Standard Deviation (Sample) | 11.9% | 10.5% |
| Standard Deviation (Population) | 11.8% | 10.3% |
Similar Demographics by Female Poverty
Demographics Similar to Arabs by Female Poverty
In terms of female poverty, the demographic groups most similar to Arabs are Immigrants from Uganda (13.7%, a difference of 0.010%), South American Indian (13.7%, a difference of 0.040%), Immigrants from South America (13.7%, a difference of 0.23%), Delaware (13.7%, a difference of 0.29%), and Immigrants from Lebanon (13.8%, a difference of 0.35%).
| Demographics | Rating | Rank | Female Poverty |
| Sierra Leoneans | 33.1 /100 | #190 | Fair 13.7% |
| Immigrants | Kuwait | 32.7 /100 | #191 | Fair 13.7% |
| Immigrants | Costa Rica | 31.9 /100 | #192 | Fair 13.7% |
| Iraqis | 31.8 /100 | #193 | Fair 13.7% |
| Delaware | 31.1 /100 | #194 | Fair 13.7% |
| Immigrants | South America | 30.6 /100 | #195 | Fair 13.7% |
| South American Indians | 28.9 /100 | #196 | Fair 13.7% |
| Arabs | 28.6 /100 | #197 | Fair 13.7% |
| Immigrants | Uganda | 28.5 /100 | #198 | Fair 13.7% |
| Immigrants | Lebanon | 25.6 /100 | #199 | Fair 13.8% |
| Spanish | 21.4 /100 | #200 | Fair 13.9% |
| Immigrants | Kenya | 21.1 /100 | #201 | Fair 13.9% |
| Hmong | 21.1 /100 | #202 | Fair 13.9% |
| Immigrants | Western Asia | 20.7 /100 | #203 | Fair 13.9% |
| Spaniards | 18.9 /100 | #204 | Poor 13.9% |
Demographics Similar to Comanche by Female Poverty
In terms of female poverty, the demographic groups most similar to Comanche are Spanish American (16.2%, a difference of 0.080%), Immigrants from Cuba (16.1%, a difference of 0.13%), Immigrants from Haiti (16.1%, a difference of 0.21%), West Indian (16.1%, a difference of 0.36%), and Vietnamese (16.1%, a difference of 0.38%).
| Demographics | Rating | Rank | Female Poverty |
| Immigrants | West Indies | 0.0 /100 | #278 | Tragic 16.1% |
| Immigrants | Bahamas | 0.0 /100 | #279 | Tragic 16.1% |
| Vietnamese | 0.0 /100 | #280 | Tragic 16.1% |
| West Indians | 0.0 /100 | #281 | Tragic 16.1% |
| Immigrants | Haiti | 0.0 /100 | #282 | Tragic 16.1% |
| Immigrants | Cuba | 0.0 /100 | #283 | Tragic 16.1% |
| Spanish Americans | 0.0 /100 | #284 | Tragic 16.2% |
| Comanche | 0.0 /100 | #285 | Tragic 16.2% |
| Inupiat | 0.0 /100 | #286 | Tragic 16.2% |
| Immigrants | Belize | 0.0 /100 | #287 | Tragic 16.3% |
| Indonesians | 0.0 /100 | #288 | Tragic 16.4% |
| Blackfeet | 0.0 /100 | #289 | Tragic 16.4% |
| Immigrants | Bangladesh | 0.0 /100 | #290 | Tragic 16.4% |
| Yaqui | 0.0 /100 | #291 | Tragic 16.4% |
| Immigrants | Zaire | 0.0 /100 | #292 | Tragic 16.4% |