Guamanian/Chamorro vs Comanche Female Poverty
COMPARE
Guamanian/Chamorro
Comanche
Female Poverty
Female Poverty Comparison
Guamanians/Chamorros
Comanche
13.3%
FEMALE POVERTY
62.4/ 100
METRIC RATING
162nd/ 347
METRIC RANK
16.2%
FEMALE POVERTY
0.0/ 100
METRIC RATING
285th/ 347
METRIC RANK
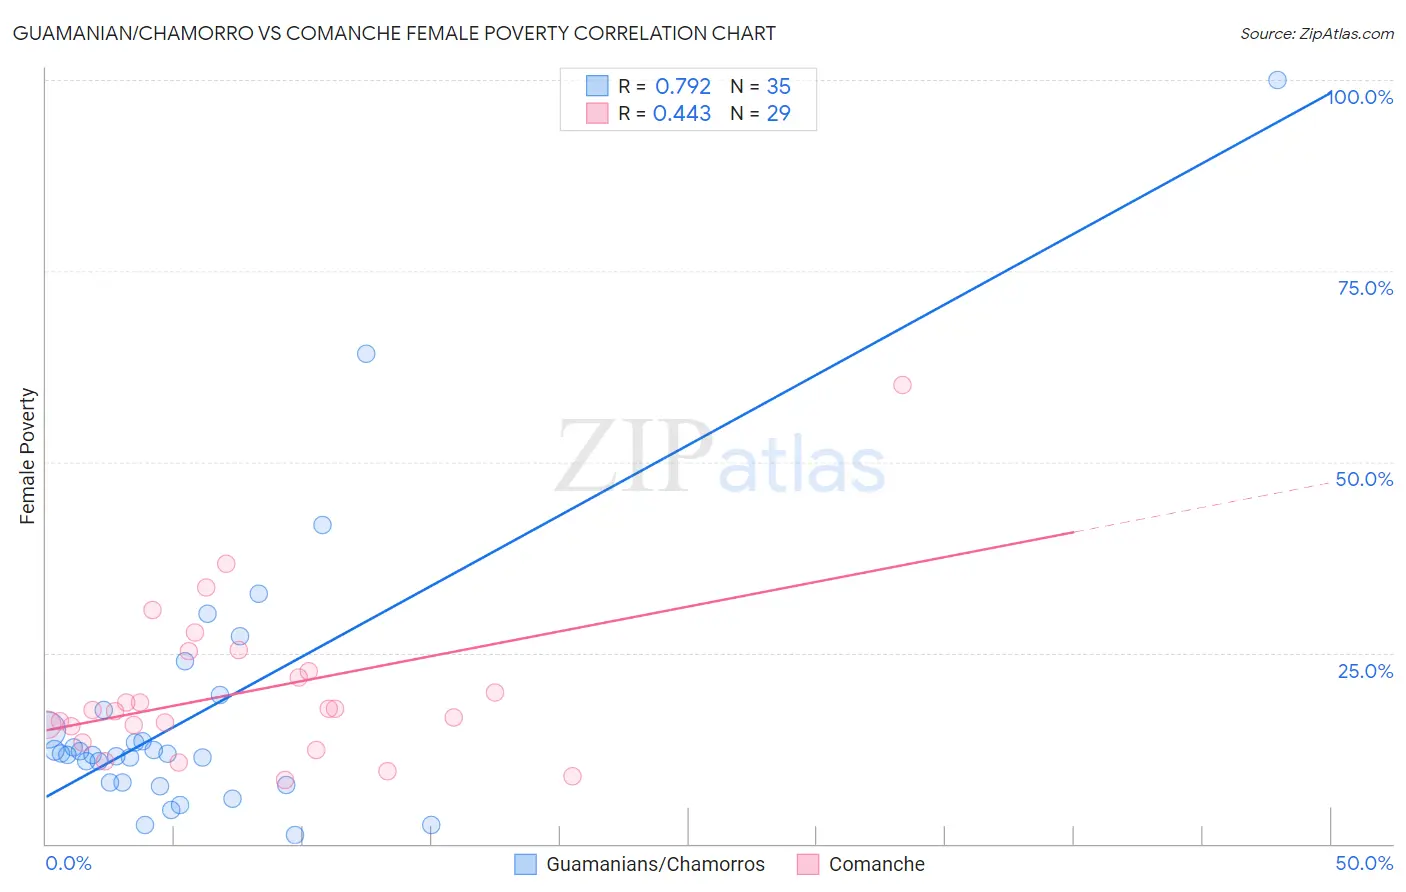
Guamanian/Chamorro vs Comanche Female Poverty Correlation Chart
The statistical analysis conducted on geographies consisting of 221,860,928 people shows a strong positive correlation between the proportion of Guamanians/Chamorros and poverty level among females in the United States with a correlation coefficient (R) of 0.792 and weighted average of 13.3%. Similarly, the statistical analysis conducted on geographies consisting of 109,749,855 people shows a moderate positive correlation between the proportion of Comanche and poverty level among females in the United States with a correlation coefficient (R) of 0.443 and weighted average of 16.2%, a difference of 21.8%.
Female Poverty Correlation Summary
| Measurement | Guamanian/Chamorro | Comanche |
| Minimum | 1.2% | 8.4% |
| Maximum | 100.0% | 60.0% |
| Range | 98.8% | 51.6% |
| Mean | 17.2% | 20.0% |
| Median | 11.7% | 17.4% |
| Interquartile 25% (IQ1) | 8.0% | 14.3% |
| Interquartile 75% (IQ3) | 17.6% | 23.9% |
| Interquartile Range (IQR) | 9.6% | 9.6% |
| Standard Deviation (Sample) | 18.9% | 10.5% |
| Standard Deviation (Population) | 18.6% | 10.3% |
Similar Demographics by Female Poverty
Demographics Similar to Guamanians/Chamorros by Female Poverty
In terms of female poverty, the demographic groups most similar to Guamanians/Chamorros are Immigrants from Albania (13.3%, a difference of 0.0%), Immigrants from Ethiopia (13.3%, a difference of 0.010%), Ethiopian (13.3%, a difference of 0.010%), Immigrants from Nepal (13.3%, a difference of 0.030%), and Scotch-Irish (13.3%, a difference of 0.030%).
| Demographics | Rating | Rank | Female Poverty |
| Hungarians | 70.1 /100 | #155 | Good 13.2% |
| Immigrants | Bosnia and Herzegovina | 69.7 /100 | #156 | Good 13.2% |
| Immigrants | Northern Africa | 68.8 /100 | #157 | Good 13.2% |
| Pennsylvania Germans | 67.3 /100 | #158 | Good 13.2% |
| Costa Ricans | 63.6 /100 | #159 | Good 13.3% |
| Immigrants | Nepal | 62.7 /100 | #160 | Good 13.3% |
| Immigrants | Ethiopia | 62.5 /100 | #161 | Good 13.3% |
| Guamanians/Chamorros | 62.4 /100 | #162 | Good 13.3% |
| Immigrants | Albania | 62.4 /100 | #163 | Good 13.3% |
| Ethiopians | 62.3 /100 | #164 | Good 13.3% |
| Scotch-Irish | 62.1 /100 | #165 | Good 13.3% |
| Immigrants | Oceania | 59.7 /100 | #166 | Average 13.3% |
| Immigrants | Chile | 57.4 /100 | #167 | Average 13.3% |
| Aleuts | 56.7 /100 | #168 | Average 13.4% |
| Lebanese | 55.9 /100 | #169 | Average 13.4% |
Demographics Similar to Comanche by Female Poverty
In terms of female poverty, the demographic groups most similar to Comanche are Spanish American (16.2%, a difference of 0.080%), Immigrants from Cuba (16.1%, a difference of 0.13%), Immigrants from Haiti (16.1%, a difference of 0.21%), West Indian (16.1%, a difference of 0.36%), and Vietnamese (16.1%, a difference of 0.38%).
| Demographics | Rating | Rank | Female Poverty |
| Immigrants | West Indies | 0.0 /100 | #278 | Tragic 16.1% |
| Immigrants | Bahamas | 0.0 /100 | #279 | Tragic 16.1% |
| Vietnamese | 0.0 /100 | #280 | Tragic 16.1% |
| West Indians | 0.0 /100 | #281 | Tragic 16.1% |
| Immigrants | Haiti | 0.0 /100 | #282 | Tragic 16.1% |
| Immigrants | Cuba | 0.0 /100 | #283 | Tragic 16.1% |
| Spanish Americans | 0.0 /100 | #284 | Tragic 16.2% |
| Comanche | 0.0 /100 | #285 | Tragic 16.2% |
| Inupiat | 0.0 /100 | #286 | Tragic 16.2% |
| Immigrants | Belize | 0.0 /100 | #287 | Tragic 16.3% |
| Indonesians | 0.0 /100 | #288 | Tragic 16.4% |
| Blackfeet | 0.0 /100 | #289 | Tragic 16.4% |
| Immigrants | Bangladesh | 0.0 /100 | #290 | Tragic 16.4% |
| Yaqui | 0.0 /100 | #291 | Tragic 16.4% |
| Immigrants | Zaire | 0.0 /100 | #292 | Tragic 16.4% |