Immigrants from Argentina vs Alsatian Female Poverty
COMPARE
Immigrants from Argentina
Alsatian
Female Poverty
Female Poverty Comparison
Immigrants from Argentina
Alsatians
12.8%
FEMALE POVERTY
87.0/ 100
METRIC RATING
131st/ 347
METRIC RANK
14.5%
FEMALE POVERTY
4.0/ 100
METRIC RATING
220th/ 347
METRIC RANK
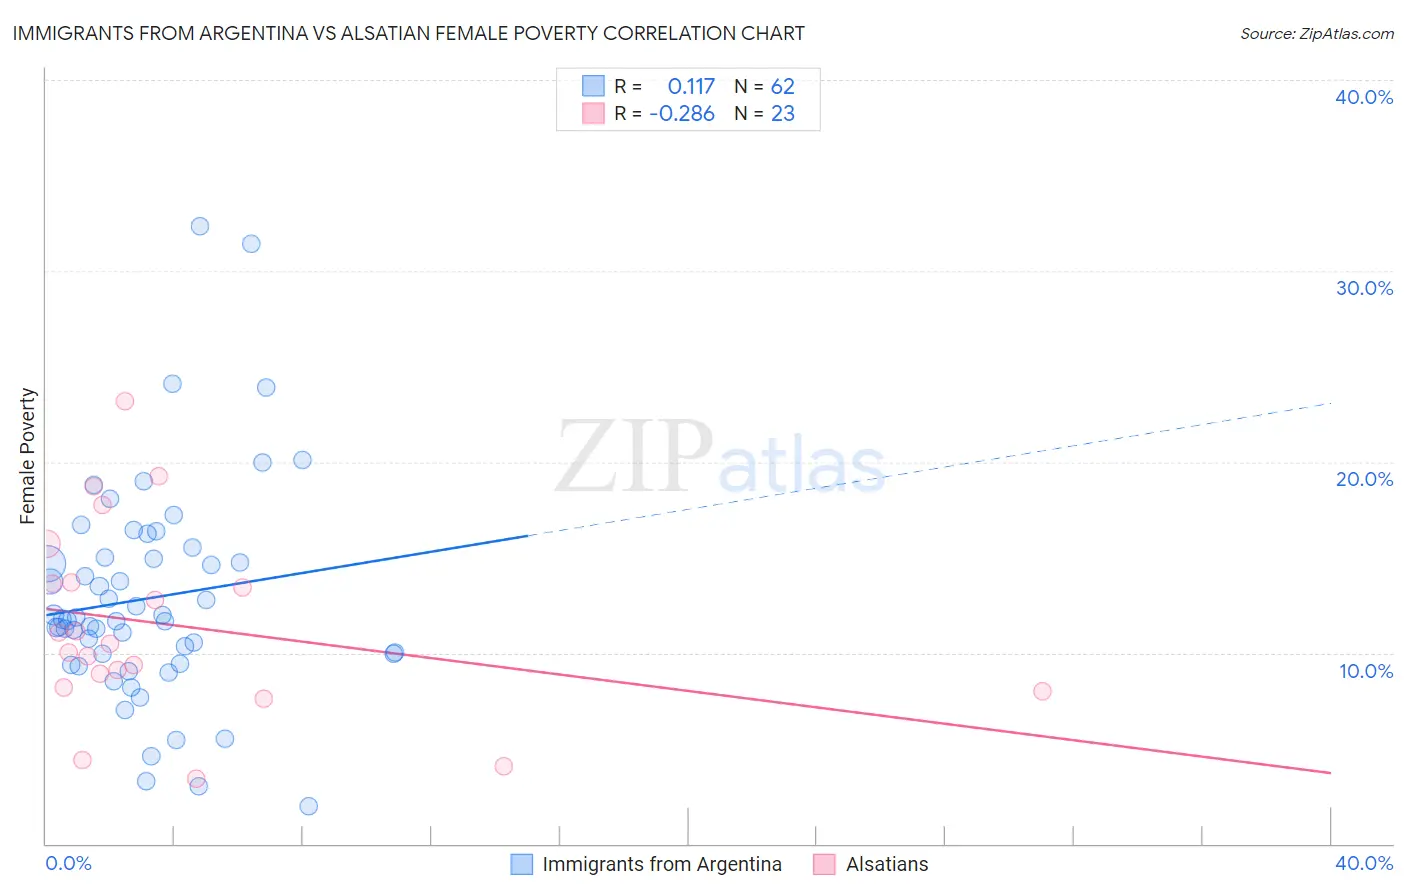
Immigrants from Argentina vs Alsatian Female Poverty Correlation Chart
The statistical analysis conducted on geographies consisting of 264,332,384 people shows a poor positive correlation between the proportion of Immigrants from Argentina and poverty level among females in the United States with a correlation coefficient (R) of 0.117 and weighted average of 12.8%. Similarly, the statistical analysis conducted on geographies consisting of 82,678,421 people shows a weak negative correlation between the proportion of Alsatians and poverty level among females in the United States with a correlation coefficient (R) of -0.286 and weighted average of 14.5%, a difference of 12.8%.
Female Poverty Correlation Summary
| Measurement | Immigrants from Argentina | Alsatian |
| Minimum | 1.9% | 3.4% |
| Maximum | 32.3% | 23.1% |
| Range | 30.4% | 19.7% |
| Mean | 12.9% | 11.5% |
| Median | 11.7% | 10.5% |
| Interquartile 25% (IQ1) | 9.9% | 8.2% |
| Interquartile 75% (IQ3) | 15.0% | 13.7% |
| Interquartile Range (IQR) | 5.0% | 5.5% |
| Standard Deviation (Sample) | 5.7% | 5.0% |
| Standard Deviation (Population) | 5.7% | 4.9% |
Similar Demographics by Female Poverty
Demographics Similar to Immigrants from Argentina by Female Poverty
In terms of female poverty, the demographic groups most similar to Immigrants from Argentina are Immigrants from Jordan (12.8%, a difference of 0.010%), Immigrants from Vietnam (12.8%, a difference of 0.030%), Immigrants from Western Europe (12.8%, a difference of 0.070%), Immigrants from Brazil (12.8%, a difference of 0.22%), and Immigrants from Switzerland (12.9%, a difference of 0.24%).
| Demographics | Rating | Rank | Female Poverty |
| Immigrants | Norway | 89.3 /100 | #124 | Excellent 12.8% |
| Argentineans | 89.1 /100 | #125 | Excellent 12.8% |
| Immigrants | Ukraine | 88.8 /100 | #126 | Excellent 12.8% |
| South Africans | 88.4 /100 | #127 | Excellent 12.8% |
| Immigrants | Belarus | 88.2 /100 | #128 | Excellent 12.8% |
| Immigrants | Brazil | 87.9 /100 | #129 | Excellent 12.8% |
| Immigrants | Vietnam | 87.1 /100 | #130 | Excellent 12.8% |
| Immigrants | Argentina | 87.0 /100 | #131 | Excellent 12.8% |
| Immigrants | Jordan | 86.9 /100 | #132 | Excellent 12.8% |
| Immigrants | Western Europe | 86.6 /100 | #133 | Excellent 12.8% |
| Immigrants | Switzerland | 85.8 /100 | #134 | Excellent 12.9% |
| French | 85.6 /100 | #135 | Excellent 12.9% |
| Peruvians | 85.2 /100 | #136 | Excellent 12.9% |
| Chileans | 84.7 /100 | #137 | Excellent 12.9% |
| Immigrants | France | 83.6 /100 | #138 | Excellent 12.9% |
Demographics Similar to Alsatians by Female Poverty
In terms of female poverty, the demographic groups most similar to Alsatians are Japanese (14.5%, a difference of 0.050%), Immigrants from Uzbekistan (14.4%, a difference of 0.18%), Immigrants from Cambodia (14.5%, a difference of 0.19%), Nonimmigrants (14.5%, a difference of 0.22%), and Immigrants (14.4%, a difference of 0.23%).
| Demographics | Rating | Rank | Female Poverty |
| Alaskan Athabascans | 5.3 /100 | #213 | Tragic 14.4% |
| Marshallese | 5.0 /100 | #214 | Tragic 14.4% |
| Immigrants | Panama | 4.7 /100 | #215 | Tragic 14.4% |
| Immigrants | Thailand | 4.5 /100 | #216 | Tragic 14.4% |
| Immigrants | Immigrants | 4.5 /100 | #217 | Tragic 14.4% |
| Immigrants | Uzbekistan | 4.4 /100 | #218 | Tragic 14.4% |
| Japanese | 4.1 /100 | #219 | Tragic 14.5% |
| Alsatians | 4.0 /100 | #220 | Tragic 14.5% |
| Immigrants | Cambodia | 3.7 /100 | #221 | Tragic 14.5% |
| Immigrants | Nonimmigrants | 3.7 /100 | #222 | Tragic 14.5% |
| Immigrants | Africa | 3.3 /100 | #223 | Tragic 14.5% |
| Americans | 2.8 /100 | #224 | Tragic 14.6% |
| Immigrants | Micronesia | 2.8 /100 | #225 | Tragic 14.6% |
| Immigrants | Eritrea | 2.4 /100 | #226 | Tragic 14.6% |
| Immigrants | Nigeria | 2.1 /100 | #227 | Tragic 14.7% |