Fijian vs Immigrants from Singapore Married-Couple Family Poverty
COMPARE
Fijian
Immigrants from Singapore
Married-Couple Family Poverty
Married-Couple Family Poverty Comparison
Fijians
Immigrants from Singapore
5.8%
MARRIED-COUPLE FAMILY POVERTY
2.5/ 100
METRIC RATING
240th/ 347
METRIC RANK
4.1%
MARRIED-COUPLE FAMILY POVERTY
99.9/ 100
METRIC RATING
22nd/ 347
METRIC RANK
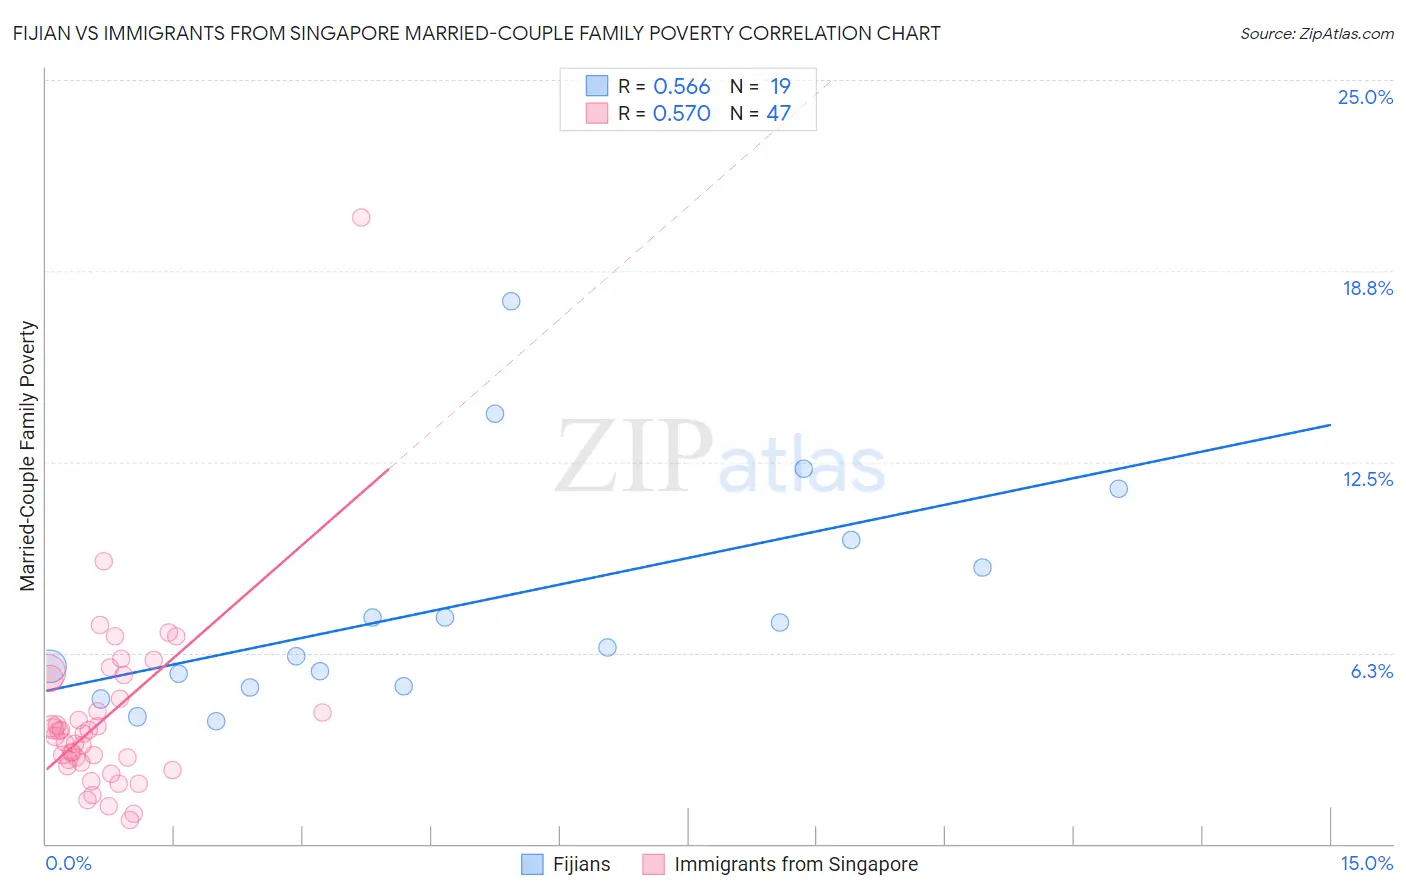
Fijian vs Immigrants from Singapore Married-Couple Family Poverty Correlation Chart
The statistical analysis conducted on geographies consisting of 55,857,947 people shows a substantial positive correlation between the proportion of Fijians and poverty level among married-couple families in the United States with a correlation coefficient (R) of 0.566 and weighted average of 5.8%. Similarly, the statistical analysis conducted on geographies consisting of 136,997,668 people shows a substantial positive correlation between the proportion of Immigrants from Singapore and poverty level among married-couple families in the United States with a correlation coefficient (R) of 0.570 and weighted average of 4.1%, a difference of 41.0%.
Married-Couple Family Poverty Correlation Summary
| Measurement | Fijian | Immigrants from Singapore |
| Minimum | 4.0% | 0.78% |
| Maximum | 17.8% | 20.5% |
| Range | 13.8% | 19.7% |
| Mean | 7.9% | 4.1% |
| Median | 6.4% | 3.6% |
| Interquartile 25% (IQ1) | 5.2% | 2.6% |
| Interquartile 75% (IQ3) | 10.0% | 5.4% |
| Interquartile Range (IQR) | 4.8% | 2.8% |
| Standard Deviation (Sample) | 3.7% | 3.0% |
| Standard Deviation (Population) | 3.6% | 3.0% |
Similar Demographics by Married-Couple Family Poverty
Demographics Similar to Fijians by Married-Couple Family Poverty
In terms of married-couple family poverty, the demographic groups most similar to Fijians are Immigrants from Panama (5.8%, a difference of 0.020%), Immigrants from Western Africa (5.8%, a difference of 0.11%), Venezuelan (5.8%, a difference of 0.17%), Cherokee (5.8%, a difference of 0.19%), and Somali (5.8%, a difference of 0.27%).
| Demographics | Rating | Rank | Married-Couple Family Poverty |
| Immigrants | Colombia | 3.7 /100 | #233 | Tragic 5.7% |
| Immigrants | Uruguay | 3.7 /100 | #234 | Tragic 5.7% |
| Immigrants | Sudan | 3.5 /100 | #235 | Tragic 5.7% |
| Ghanaians | 3.3 /100 | #236 | Tragic 5.7% |
| Immigrants | South America | 3.1 /100 | #237 | Tragic 5.7% |
| Cherokee | 2.7 /100 | #238 | Tragic 5.8% |
| Venezuelans | 2.7 /100 | #239 | Tragic 5.8% |
| Fijians | 2.5 /100 | #240 | Tragic 5.8% |
| Immigrants | Panama | 2.5 /100 | #241 | Tragic 5.8% |
| Immigrants | Western Africa | 2.4 /100 | #242 | Tragic 5.8% |
| Somalis | 2.3 /100 | #243 | Tragic 5.8% |
| Chickasaw | 2.3 /100 | #244 | Tragic 5.8% |
| Immigrants | Afghanistan | 2.1 /100 | #245 | Tragic 5.8% |
| Immigrants | Venezuela | 1.8 /100 | #246 | Tragic 5.8% |
| Iraqis | 1.4 /100 | #247 | Tragic 5.9% |
Demographics Similar to Immigrants from Singapore by Married-Couple Family Poverty
In terms of married-couple family poverty, the demographic groups most similar to Immigrants from Singapore are Bhutanese (4.1%, a difference of 0.020%), Eastern European (4.1%, a difference of 0.26%), Zimbabwean (4.1%, a difference of 0.37%), Maltese (4.1%, a difference of 0.40%), and Immigrants from Ireland (4.1%, a difference of 0.64%).
| Demographics | Rating | Rank | Married-Couple Family Poverty |
| Poles | 100.0 /100 | #15 | Exceptional 4.0% |
| Germans | 100.0 /100 | #16 | Exceptional 4.0% |
| Filipinos | 100.0 /100 | #17 | Exceptional 4.0% |
| Italians | 100.0 /100 | #18 | Exceptional 4.0% |
| Immigrants | Ireland | 99.9 /100 | #19 | Exceptional 4.1% |
| Maltese | 99.9 /100 | #20 | Exceptional 4.1% |
| Zimbabweans | 99.9 /100 | #21 | Exceptional 4.1% |
| Immigrants | Singapore | 99.9 /100 | #22 | Exceptional 4.1% |
| Bhutanese | 99.9 /100 | #23 | Exceptional 4.1% |
| Eastern Europeans | 99.9 /100 | #24 | Exceptional 4.1% |
| Immigrants | Taiwan | 99.9 /100 | #25 | Exceptional 4.1% |
| Cypriots | 99.9 /100 | #26 | Exceptional 4.1% |
| Danes | 99.9 /100 | #27 | Exceptional 4.1% |
| Scandinavians | 99.9 /100 | #28 | Exceptional 4.1% |
| Immigrants | Scotland | 99.9 /100 | #29 | Exceptional 4.2% |