Creek vs Northern European Female Poverty
COMPARE
Creek
Northern European
Female Poverty
Female Poverty Comparison
Creek
Northern Europeans
17.0%
FEMALE POVERTY
0.0/ 100
METRIC RATING
310th/ 347
METRIC RANK
12.4%
FEMALE POVERTY
96.6/ 100
METRIC RATING
84th/ 347
METRIC RANK
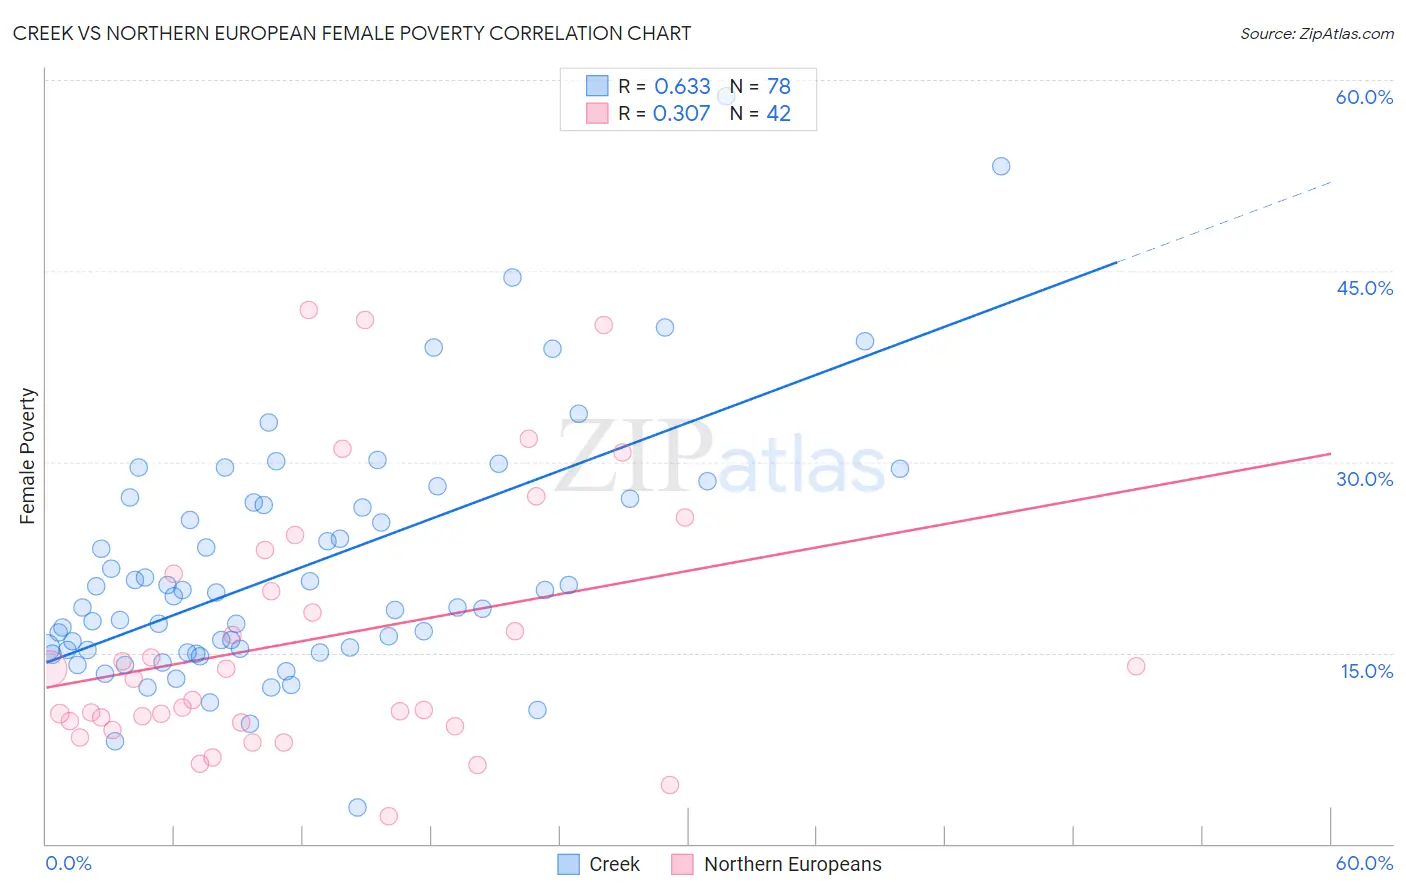
Creek vs Northern European Female Poverty Correlation Chart
The statistical analysis conducted on geographies consisting of 178,438,059 people shows a significant positive correlation between the proportion of Creek and poverty level among females in the United States with a correlation coefficient (R) of 0.633 and weighted average of 17.0%. Similarly, the statistical analysis conducted on geographies consisting of 405,818,739 people shows a mild positive correlation between the proportion of Northern Europeans and poverty level among females in the United States with a correlation coefficient (R) of 0.307 and weighted average of 12.4%, a difference of 37.6%.
Female Poverty Correlation Summary
| Measurement | Creek | Northern European |
| Minimum | 2.9% | 2.2% |
| Maximum | 58.7% | 41.9% |
| Range | 55.8% | 39.7% |
| Mean | 21.7% | 16.1% |
| Median | 19.0% | 12.1% |
| Interquartile 25% (IQ1) | 15.3% | 9.5% |
| Interquartile 75% (IQ3) | 26.8% | 21.2% |
| Interquartile Range (IQR) | 11.5% | 11.6% |
| Standard Deviation (Sample) | 9.8% | 10.2% |
| Standard Deviation (Population) | 9.8% | 10.1% |
Similar Demographics by Female Poverty
Demographics Similar to Creek by Female Poverty
In terms of female poverty, the demographic groups most similar to Creek are Immigrants from Guatemala (17.0%, a difference of 0.0%), Immigrants from Somalia (17.0%, a difference of 0.10%), British West Indian (17.0%, a difference of 0.17%), Immigrants from Mexico (17.0%, a difference of 0.24%), and Dutch West Indian (17.1%, a difference of 0.42%).
| Demographics | Rating | Rank | Female Poverty |
| Choctaw | 0.0 /100 | #303 | Tragic 16.8% |
| Immigrants | Central America | 0.0 /100 | #304 | Tragic 16.8% |
| Immigrants | Grenada | 0.0 /100 | #305 | Tragic 16.8% |
| Immigrants | Caribbean | 0.0 /100 | #306 | Tragic 16.9% |
| Seminole | 0.0 /100 | #307 | Tragic 16.9% |
| Africans | 0.0 /100 | #308 | Tragic 16.9% |
| Immigrants | Mexico | 0.0 /100 | #309 | Tragic 17.0% |
| Creek | 0.0 /100 | #310 | Tragic 17.0% |
| Immigrants | Guatemala | 0.0 /100 | #311 | Tragic 17.0% |
| Immigrants | Somalia | 0.0 /100 | #312 | Tragic 17.0% |
| British West Indians | 0.0 /100 | #313 | Tragic 17.0% |
| Dutch West Indians | 0.0 /100 | #314 | Tragic 17.1% |
| U.S. Virgin Islanders | 0.0 /100 | #315 | Tragic 17.3% |
| Hondurans | 0.0 /100 | #316 | Tragic 17.4% |
| Immigrants | Congo | 0.0 /100 | #317 | Tragic 17.4% |
Demographics Similar to Northern Europeans by Female Poverty
In terms of female poverty, the demographic groups most similar to Northern Europeans are Irish (12.4%, a difference of 0.050%), Dutch (12.4%, a difference of 0.080%), Okinawan (12.4%, a difference of 0.10%), Finnish (12.4%, a difference of 0.15%), and Immigrants from England (12.3%, a difference of 0.23%).
| Demographics | Rating | Rank | Female Poverty |
| Serbians | 97.2 /100 | #77 | Exceptional 12.3% |
| Egyptians | 97.2 /100 | #78 | Exceptional 12.3% |
| Immigrants | North America | 97.1 /100 | #79 | Exceptional 12.3% |
| Slovaks | 97.1 /100 | #80 | Exceptional 12.3% |
| Immigrants | Sweden | 97.1 /100 | #81 | Exceptional 12.3% |
| Jordanians | 97.1 /100 | #82 | Exceptional 12.3% |
| Immigrants | England | 96.9 /100 | #83 | Exceptional 12.3% |
| Northern Europeans | 96.6 /100 | #84 | Exceptional 12.4% |
| Irish | 96.5 /100 | #85 | Exceptional 12.4% |
| Dutch | 96.5 /100 | #86 | Exceptional 12.4% |
| Okinawans | 96.4 /100 | #87 | Exceptional 12.4% |
| Finns | 96.4 /100 | #88 | Exceptional 12.4% |
| English | 96.1 /100 | #89 | Exceptional 12.4% |
| Immigrants | Denmark | 95.8 /100 | #90 | Exceptional 12.4% |
| Belgians | 95.8 /100 | #91 | Exceptional 12.4% |