Creek vs Immigrants from Kuwait Female Poverty
COMPARE
Creek
Immigrants from Kuwait
Female Poverty
Female Poverty Comparison
Creek
Immigrants from Kuwait
17.0%
FEMALE POVERTY
0.0/ 100
METRIC RATING
310th/ 347
METRIC RANK
13.7%
FEMALE POVERTY
32.7/ 100
METRIC RATING
191st/ 347
METRIC RANK
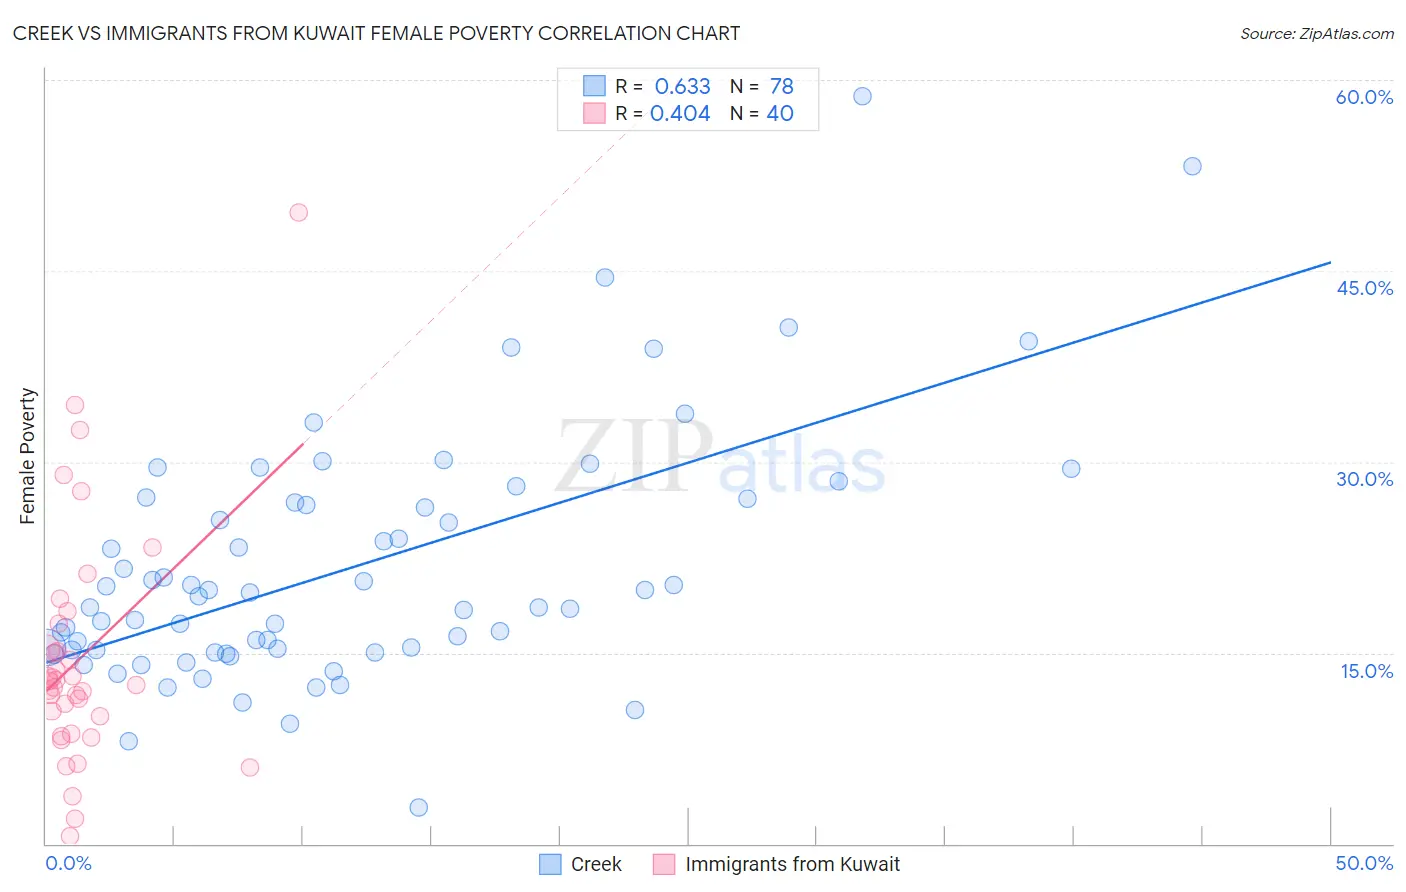
Creek vs Immigrants from Kuwait Female Poverty Correlation Chart
The statistical analysis conducted on geographies consisting of 178,438,059 people shows a significant positive correlation between the proportion of Creek and poverty level among females in the United States with a correlation coefficient (R) of 0.633 and weighted average of 17.0%. Similarly, the statistical analysis conducted on geographies consisting of 136,883,256 people shows a moderate positive correlation between the proportion of Immigrants from Kuwait and poverty level among females in the United States with a correlation coefficient (R) of 0.404 and weighted average of 13.7%, a difference of 24.3%.
Female Poverty Correlation Summary
| Measurement | Creek | Immigrants from Kuwait |
| Minimum | 2.9% | 0.62% |
| Maximum | 58.7% | 49.6% |
| Range | 55.8% | 49.0% |
| Mean | 21.7% | 14.6% |
| Median | 19.0% | 12.6% |
| Interquartile 25% (IQ1) | 15.3% | 9.3% |
| Interquartile 75% (IQ3) | 26.8% | 16.3% |
| Interquartile Range (IQR) | 11.5% | 7.0% |
| Standard Deviation (Sample) | 9.8% | 9.4% |
| Standard Deviation (Population) | 9.8% | 9.3% |
Similar Demographics by Female Poverty
Demographics Similar to Creek by Female Poverty
In terms of female poverty, the demographic groups most similar to Creek are Immigrants from Guatemala (17.0%, a difference of 0.0%), Immigrants from Somalia (17.0%, a difference of 0.10%), British West Indian (17.0%, a difference of 0.17%), Immigrants from Mexico (17.0%, a difference of 0.24%), and Dutch West Indian (17.1%, a difference of 0.42%).
| Demographics | Rating | Rank | Female Poverty |
| Choctaw | 0.0 /100 | #303 | Tragic 16.8% |
| Immigrants | Central America | 0.0 /100 | #304 | Tragic 16.8% |
| Immigrants | Grenada | 0.0 /100 | #305 | Tragic 16.8% |
| Immigrants | Caribbean | 0.0 /100 | #306 | Tragic 16.9% |
| Seminole | 0.0 /100 | #307 | Tragic 16.9% |
| Africans | 0.0 /100 | #308 | Tragic 16.9% |
| Immigrants | Mexico | 0.0 /100 | #309 | Tragic 17.0% |
| Creek | 0.0 /100 | #310 | Tragic 17.0% |
| Immigrants | Guatemala | 0.0 /100 | #311 | Tragic 17.0% |
| Immigrants | Somalia | 0.0 /100 | #312 | Tragic 17.0% |
| British West Indians | 0.0 /100 | #313 | Tragic 17.0% |
| Dutch West Indians | 0.0 /100 | #314 | Tragic 17.1% |
| U.S. Virgin Islanders | 0.0 /100 | #315 | Tragic 17.3% |
| Hondurans | 0.0 /100 | #316 | Tragic 17.4% |
| Immigrants | Congo | 0.0 /100 | #317 | Tragic 17.4% |
Demographics Similar to Immigrants from Kuwait by Female Poverty
In terms of female poverty, the demographic groups most similar to Immigrants from Kuwait are Sierra Leonean (13.7%, a difference of 0.040%), Immigrants from Costa Rica (13.7%, a difference of 0.090%), Iraqi (13.7%, a difference of 0.10%), Delaware (13.7%, a difference of 0.17%), and Immigrants from South America (13.7%, a difference of 0.23%).
| Demographics | Rating | Rank | Female Poverty |
| Immigrants | Sierra Leone | 43.2 /100 | #184 | Average 13.5% |
| Immigrants | Cameroon | 42.0 /100 | #185 | Average 13.5% |
| Immigrants | Portugal | 41.5 /100 | #186 | Average 13.6% |
| Immigrants | Venezuela | 41.0 /100 | #187 | Average 13.6% |
| Hawaiians | 39.9 /100 | #188 | Fair 13.6% |
| Uruguayans | 39.8 /100 | #189 | Fair 13.6% |
| Sierra Leoneans | 33.1 /100 | #190 | Fair 13.7% |
| Immigrants | Kuwait | 32.7 /100 | #191 | Fair 13.7% |
| Immigrants | Costa Rica | 31.9 /100 | #192 | Fair 13.7% |
| Iraqis | 31.8 /100 | #193 | Fair 13.7% |
| Delaware | 31.1 /100 | #194 | Fair 13.7% |
| Immigrants | South America | 30.6 /100 | #195 | Fair 13.7% |
| South American Indians | 28.9 /100 | #196 | Fair 13.7% |
| Arabs | 28.6 /100 | #197 | Fair 13.7% |
| Immigrants | Uganda | 28.5 /100 | #198 | Fair 13.7% |