Creek vs Northern European Single Female Poverty
COMPARE
Creek
Northern European
Single Female Poverty
Single Female Poverty Comparison
Creek
Northern Europeans
27.4%
SINGLE FEMALE POVERTY
0.0/ 100
METRIC RATING
326th/ 347
METRIC RANK
20.8%
SINGLE FEMALE POVERTY
68.4/ 100
METRIC RATING
162nd/ 347
METRIC RANK
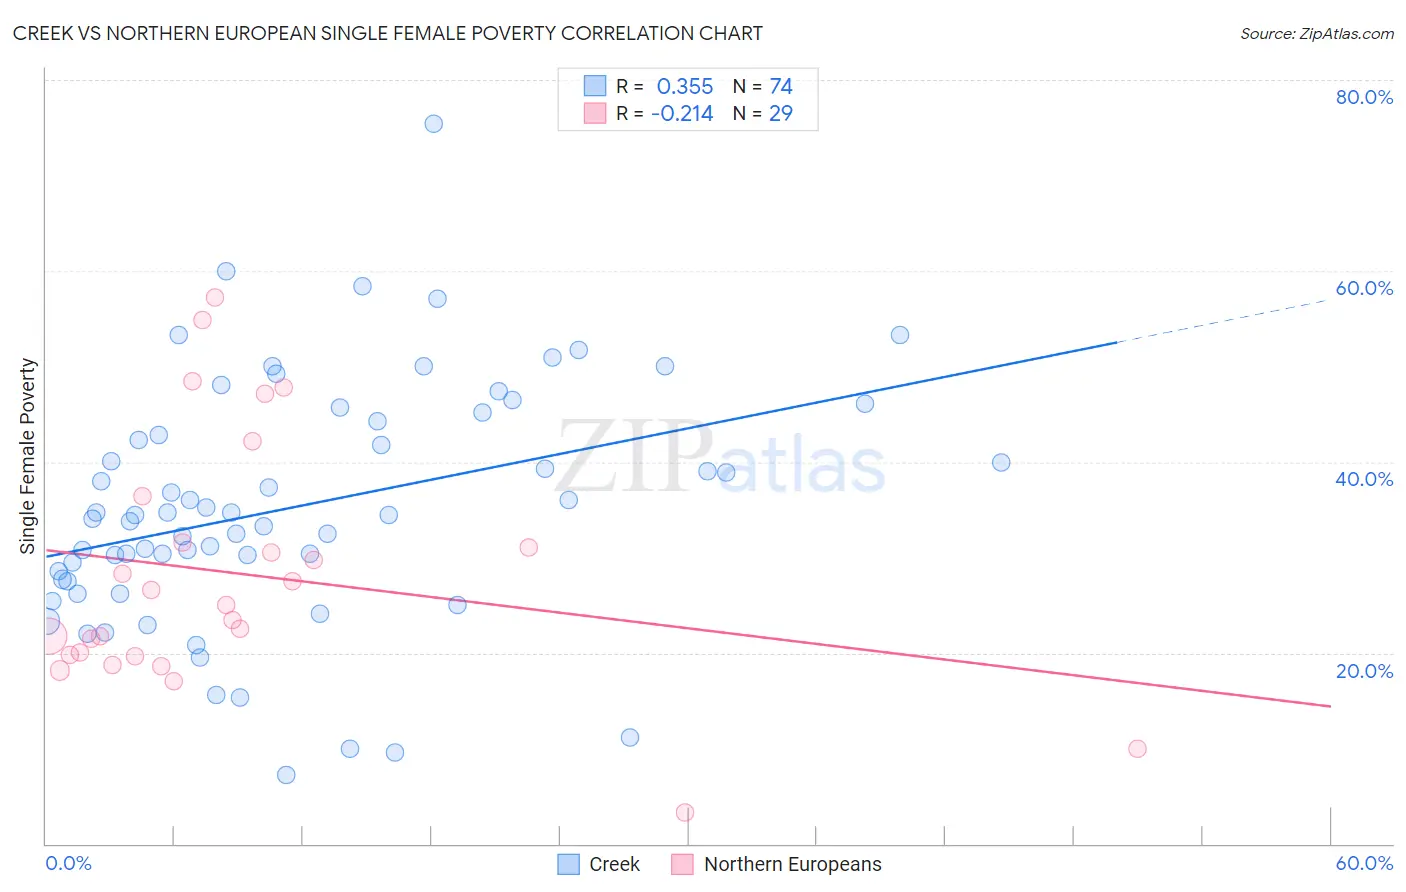
Creek vs Northern European Single Female Poverty Correlation Chart
The statistical analysis conducted on geographies consisting of 177,486,676 people shows a mild positive correlation between the proportion of Creek and poverty level among single females in the United States with a correlation coefficient (R) of 0.355 and weighted average of 27.4%. Similarly, the statistical analysis conducted on geographies consisting of 398,261,787 people shows a weak negative correlation between the proportion of Northern Europeans and poverty level among single females in the United States with a correlation coefficient (R) of -0.214 and weighted average of 20.8%, a difference of 32.2%.
Single Female Poverty Correlation Summary
| Measurement | Creek | Northern European |
| Minimum | 7.1% | 3.3% |
| Maximum | 75.4% | 57.3% |
| Range | 68.3% | 54.0% |
| Mean | 35.3% | 28.3% |
| Median | 34.4% | 25.0% |
| Interquartile 25% (IQ1) | 27.7% | 19.7% |
| Interquartile 75% (IQ3) | 44.3% | 34.0% |
| Interquartile Range (IQR) | 16.6% | 14.3% |
| Standard Deviation (Sample) | 12.7% | 13.0% |
| Standard Deviation (Population) | 12.6% | 12.8% |
Similar Demographics by Single Female Poverty
Demographics Similar to Creek by Single Female Poverty
In terms of single female poverty, the demographic groups most similar to Creek are Dutch West Indian (27.5%, a difference of 0.080%), Choctaw (27.2%, a difference of 0.88%), Apache (27.7%, a difference of 0.99%), Menominee (27.8%, a difference of 1.5%), and Kiowa (26.9%, a difference of 1.9%).
| Demographics | Rating | Rank | Single Female Poverty |
| Blacks/African Americans | 0.0 /100 | #319 | Tragic 26.4% |
| Arapaho | 0.0 /100 | #320 | Tragic 26.4% |
| Yup'ik | 0.0 /100 | #321 | Tragic 26.6% |
| Seminole | 0.0 /100 | #322 | Tragic 26.8% |
| Chippewa | 0.0 /100 | #323 | Tragic 26.8% |
| Kiowa | 0.0 /100 | #324 | Tragic 26.9% |
| Choctaw | 0.0 /100 | #325 | Tragic 27.2% |
| Creek | 0.0 /100 | #326 | Tragic 27.4% |
| Dutch West Indians | 0.0 /100 | #327 | Tragic 27.5% |
| Apache | 0.0 /100 | #328 | Tragic 27.7% |
| Menominee | 0.0 /100 | #329 | Tragic 27.8% |
| Hopi | 0.0 /100 | #330 | Tragic 28.0% |
| Natives/Alaskans | 0.0 /100 | #331 | Tragic 28.2% |
| Yakama | 0.0 /100 | #332 | Tragic 28.3% |
| Ute | 0.0 /100 | #333 | Tragic 28.4% |
Demographics Similar to Northern Europeans by Single Female Poverty
In terms of single female poverty, the demographic groups most similar to Northern Europeans are Kenyan (20.8%, a difference of 0.010%), Lebanese (20.8%, a difference of 0.050%), Arab (20.7%, a difference of 0.18%), Costa Rican (20.7%, a difference of 0.26%), and Iraqi (20.8%, a difference of 0.27%).
| Demographics | Rating | Rank | Single Female Poverty |
| Samoans | 76.0 /100 | #155 | Good 20.6% |
| South American Indians | 75.7 /100 | #156 | Good 20.6% |
| Immigrants | Oceania | 74.3 /100 | #157 | Good 20.7% |
| Danes | 73.0 /100 | #158 | Good 20.7% |
| Costa Ricans | 71.8 /100 | #159 | Good 20.7% |
| Arabs | 70.8 /100 | #160 | Good 20.7% |
| Kenyans | 68.5 /100 | #161 | Good 20.8% |
| Northern Europeans | 68.4 /100 | #162 | Good 20.8% |
| Lebanese | 67.6 /100 | #163 | Good 20.8% |
| Iraqis | 64.5 /100 | #164 | Good 20.8% |
| Ugandans | 64.0 /100 | #165 | Good 20.8% |
| Norwegians | 63.0 /100 | #166 | Good 20.8% |
| Immigrants | Norway | 63.0 /100 | #167 | Good 20.8% |
| Immigrants | Costa Rica | 61.5 /100 | #168 | Good 20.9% |
| Immigrants | Trinidad and Tobago | 56.3 /100 | #169 | Average 20.9% |