Creek vs Immigrants from Cuba Female Poverty
COMPARE
Creek
Immigrants from Cuba
Female Poverty
Female Poverty Comparison
Creek
Immigrants from Cuba
17.0%
FEMALE POVERTY
0.0/ 100
METRIC RATING
310th/ 347
METRIC RANK
16.1%
FEMALE POVERTY
0.0/ 100
METRIC RATING
283rd/ 347
METRIC RANK
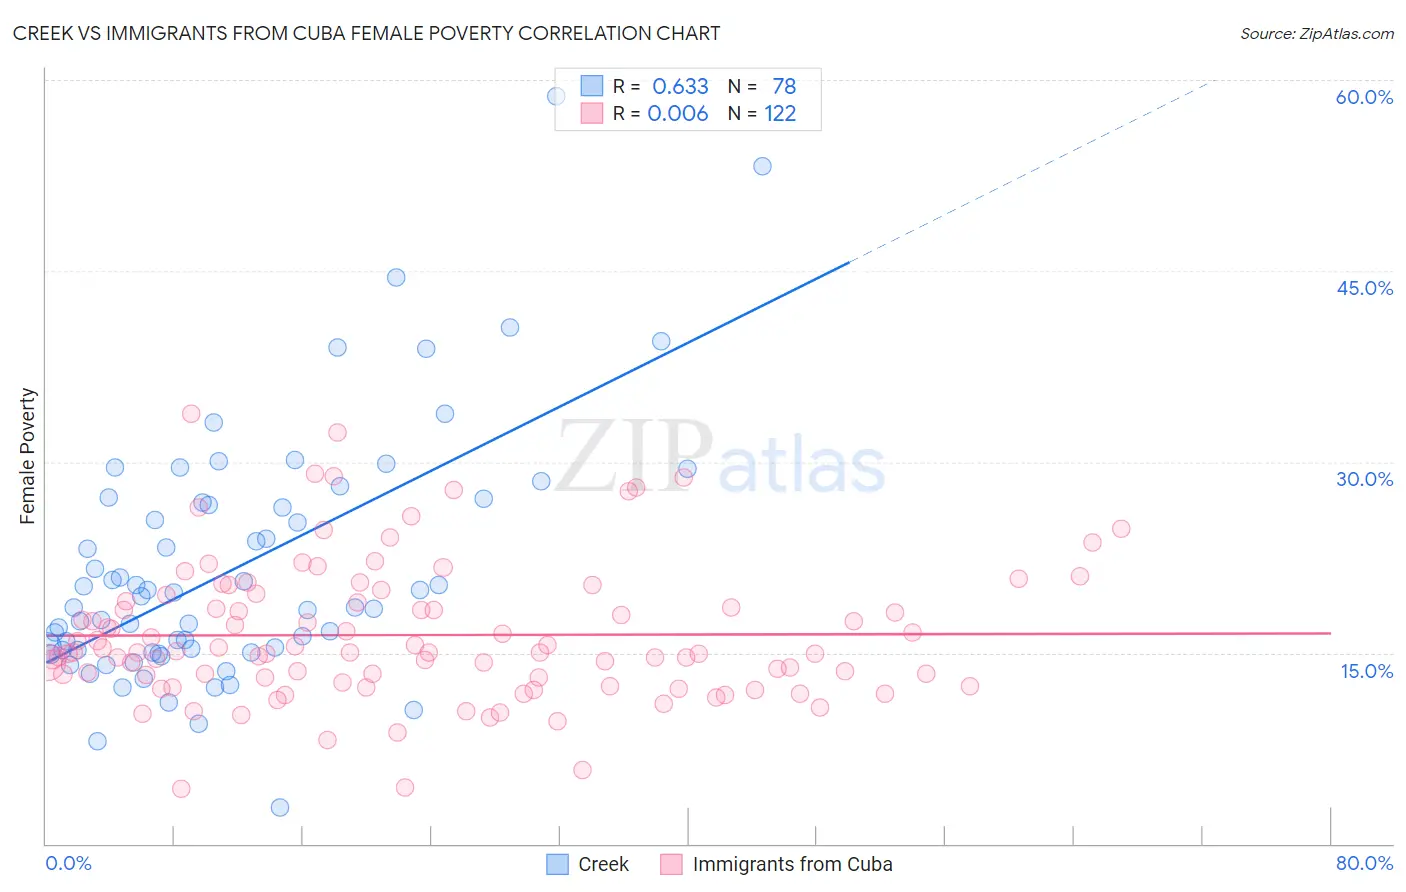
Creek vs Immigrants from Cuba Female Poverty Correlation Chart
The statistical analysis conducted on geographies consisting of 178,438,059 people shows a significant positive correlation between the proportion of Creek and poverty level among females in the United States with a correlation coefficient (R) of 0.633 and weighted average of 17.0%. Similarly, the statistical analysis conducted on geographies consisting of 325,939,480 people shows no correlation between the proportion of Immigrants from Cuba and poverty level among females in the United States with a correlation coefficient (R) of 0.006 and weighted average of 16.1%, a difference of 5.3%.
Female Poverty Correlation Summary
| Measurement | Creek | Immigrants from Cuba |
| Minimum | 2.9% | 4.3% |
| Maximum | 58.7% | 33.8% |
| Range | 55.8% | 29.5% |
| Mean | 21.7% | 16.4% |
| Median | 19.0% | 15.0% |
| Interquartile 25% (IQ1) | 15.3% | 13.0% |
| Interquartile 75% (IQ3) | 26.8% | 19.0% |
| Interquartile Range (IQR) | 11.5% | 6.0% |
| Standard Deviation (Sample) | 9.8% | 5.5% |
| Standard Deviation (Population) | 9.8% | 5.4% |
Similar Demographics by Female Poverty
Demographics Similar to Creek by Female Poverty
In terms of female poverty, the demographic groups most similar to Creek are Immigrants from Guatemala (17.0%, a difference of 0.0%), Immigrants from Somalia (17.0%, a difference of 0.10%), British West Indian (17.0%, a difference of 0.17%), Immigrants from Mexico (17.0%, a difference of 0.24%), and Dutch West Indian (17.1%, a difference of 0.42%).
| Demographics | Rating | Rank | Female Poverty |
| Choctaw | 0.0 /100 | #303 | Tragic 16.8% |
| Immigrants | Central America | 0.0 /100 | #304 | Tragic 16.8% |
| Immigrants | Grenada | 0.0 /100 | #305 | Tragic 16.8% |
| Immigrants | Caribbean | 0.0 /100 | #306 | Tragic 16.9% |
| Seminole | 0.0 /100 | #307 | Tragic 16.9% |
| Africans | 0.0 /100 | #308 | Tragic 16.9% |
| Immigrants | Mexico | 0.0 /100 | #309 | Tragic 17.0% |
| Creek | 0.0 /100 | #310 | Tragic 17.0% |
| Immigrants | Guatemala | 0.0 /100 | #311 | Tragic 17.0% |
| Immigrants | Somalia | 0.0 /100 | #312 | Tragic 17.0% |
| British West Indians | 0.0 /100 | #313 | Tragic 17.0% |
| Dutch West Indians | 0.0 /100 | #314 | Tragic 17.1% |
| U.S. Virgin Islanders | 0.0 /100 | #315 | Tragic 17.3% |
| Hondurans | 0.0 /100 | #316 | Tragic 17.4% |
| Immigrants | Congo | 0.0 /100 | #317 | Tragic 17.4% |
Demographics Similar to Immigrants from Cuba by Female Poverty
In terms of female poverty, the demographic groups most similar to Immigrants from Cuba are Spanish American (16.2%, a difference of 0.050%), Immigrants from Haiti (16.1%, a difference of 0.080%), Comanche (16.2%, a difference of 0.13%), West Indian (16.1%, a difference of 0.24%), and Vietnamese (16.1%, a difference of 0.26%).
| Demographics | Rating | Rank | Female Poverty |
| Central Americans | 0.0 /100 | #276 | Tragic 16.0% |
| Bangladeshis | 0.0 /100 | #277 | Tragic 16.0% |
| Immigrants | West Indies | 0.0 /100 | #278 | Tragic 16.1% |
| Immigrants | Bahamas | 0.0 /100 | #279 | Tragic 16.1% |
| Vietnamese | 0.0 /100 | #280 | Tragic 16.1% |
| West Indians | 0.0 /100 | #281 | Tragic 16.1% |
| Immigrants | Haiti | 0.0 /100 | #282 | Tragic 16.1% |
| Immigrants | Cuba | 0.0 /100 | #283 | Tragic 16.1% |
| Spanish Americans | 0.0 /100 | #284 | Tragic 16.2% |
| Comanche | 0.0 /100 | #285 | Tragic 16.2% |
| Inupiat | 0.0 /100 | #286 | Tragic 16.2% |
| Immigrants | Belize | 0.0 /100 | #287 | Tragic 16.3% |
| Indonesians | 0.0 /100 | #288 | Tragic 16.4% |
| Blackfeet | 0.0 /100 | #289 | Tragic 16.4% |
| Immigrants | Bangladesh | 0.0 /100 | #290 | Tragic 16.4% |