Creek vs Immigrants from Australia Female Poverty
COMPARE
Creek
Immigrants from Australia
Female Poverty
Female Poverty Comparison
Creek
Immigrants from Australia
17.0%
FEMALE POVERTY
0.0/ 100
METRIC RATING
310th/ 347
METRIC RANK
12.2%
FEMALE POVERTY
98.1/ 100
METRIC RATING
60th/ 347
METRIC RANK
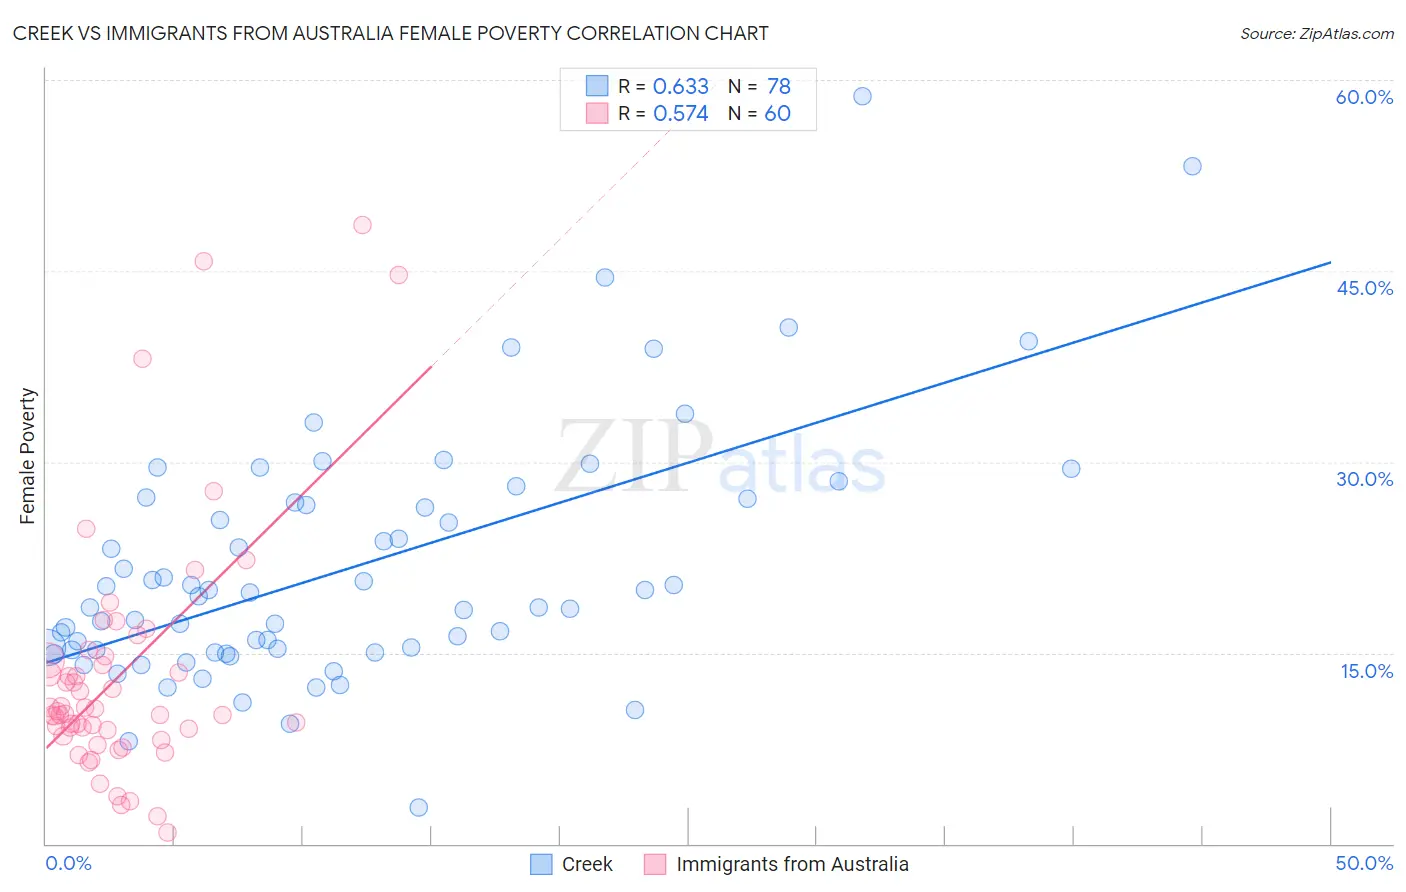
Creek vs Immigrants from Australia Female Poverty Correlation Chart
The statistical analysis conducted on geographies consisting of 178,438,059 people shows a significant positive correlation between the proportion of Creek and poverty level among females in the United States with a correlation coefficient (R) of 0.633 and weighted average of 17.0%. Similarly, the statistical analysis conducted on geographies consisting of 227,116,794 people shows a substantial positive correlation between the proportion of Immigrants from Australia and poverty level among females in the United States with a correlation coefficient (R) of 0.574 and weighted average of 12.2%, a difference of 39.7%.
Female Poverty Correlation Summary
| Measurement | Creek | Immigrants from Australia |
| Minimum | 2.9% | 0.92% |
| Maximum | 58.7% | 48.6% |
| Range | 55.8% | 47.6% |
| Mean | 21.7% | 13.4% |
| Median | 19.0% | 10.3% |
| Interquartile 25% (IQ1) | 15.3% | 8.7% |
| Interquartile 75% (IQ3) | 26.8% | 14.6% |
| Interquartile Range (IQR) | 11.5% | 5.9% |
| Standard Deviation (Sample) | 9.8% | 9.8% |
| Standard Deviation (Population) | 9.8% | 9.7% |
Similar Demographics by Female Poverty
Demographics Similar to Creek by Female Poverty
In terms of female poverty, the demographic groups most similar to Creek are Immigrants from Guatemala (17.0%, a difference of 0.0%), Immigrants from Somalia (17.0%, a difference of 0.10%), British West Indian (17.0%, a difference of 0.17%), Immigrants from Mexico (17.0%, a difference of 0.24%), and Dutch West Indian (17.1%, a difference of 0.42%).
| Demographics | Rating | Rank | Female Poverty |
| Choctaw | 0.0 /100 | #303 | Tragic 16.8% |
| Immigrants | Central America | 0.0 /100 | #304 | Tragic 16.8% |
| Immigrants | Grenada | 0.0 /100 | #305 | Tragic 16.8% |
| Immigrants | Caribbean | 0.0 /100 | #306 | Tragic 16.9% |
| Seminole | 0.0 /100 | #307 | Tragic 16.9% |
| Africans | 0.0 /100 | #308 | Tragic 16.9% |
| Immigrants | Mexico | 0.0 /100 | #309 | Tragic 17.0% |
| Creek | 0.0 /100 | #310 | Tragic 17.0% |
| Immigrants | Guatemala | 0.0 /100 | #311 | Tragic 17.0% |
| Immigrants | Somalia | 0.0 /100 | #312 | Tragic 17.0% |
| British West Indians | 0.0 /100 | #313 | Tragic 17.0% |
| Dutch West Indians | 0.0 /100 | #314 | Tragic 17.1% |
| U.S. Virgin Islanders | 0.0 /100 | #315 | Tragic 17.3% |
| Hondurans | 0.0 /100 | #316 | Tragic 17.4% |
| Immigrants | Congo | 0.0 /100 | #317 | Tragic 17.4% |
Demographics Similar to Immigrants from Australia by Female Poverty
In terms of female poverty, the demographic groups most similar to Immigrants from Australia are Immigrants from Asia (12.2%, a difference of 0.0%), Immigrants from Italy (12.2%, a difference of 0.030%), Ukrainian (12.2%, a difference of 0.11%), German (12.2%, a difference of 0.14%), and Indian (Asian) (12.2%, a difference of 0.17%).
| Demographics | Rating | Rank | Female Poverty |
| Immigrants | Austria | 98.7 /100 | #53 | Exceptional 12.0% |
| Immigrants | Philippines | 98.7 /100 | #54 | Exceptional 12.1% |
| Immigrants | Sri Lanka | 98.5 /100 | #55 | Exceptional 12.1% |
| Estonians | 98.3 /100 | #56 | Exceptional 12.1% |
| Immigrants | Serbia | 98.3 /100 | #57 | Exceptional 12.1% |
| Scandinavians | 98.2 /100 | #58 | Exceptional 12.1% |
| Immigrants | Europe | 98.2 /100 | #59 | Exceptional 12.1% |
| Immigrants | Australia | 98.1 /100 | #60 | Exceptional 12.2% |
| Immigrants | Asia | 98.1 /100 | #61 | Exceptional 12.2% |
| Immigrants | Italy | 98.0 /100 | #62 | Exceptional 12.2% |
| Ukrainians | 98.0 /100 | #63 | Exceptional 12.2% |
| Germans | 98.0 /100 | #64 | Exceptional 12.2% |
| Indians (Asian) | 97.9 /100 | #65 | Exceptional 12.2% |
| Austrians | 97.9 /100 | #66 | Exceptional 12.2% |
| Immigrants | Eastern Asia | 97.8 /100 | #67 | Exceptional 12.2% |