Jamaican vs Immigrants from Kuwait Female Poverty
COMPARE
Jamaican
Immigrants from Kuwait
Female Poverty
Female Poverty Comparison
Jamaicans
Immigrants from Kuwait
15.5%
FEMALE POVERTY
0.2/ 100
METRIC RATING
256th/ 347
METRIC RANK
13.7%
FEMALE POVERTY
32.7/ 100
METRIC RATING
191st/ 347
METRIC RANK
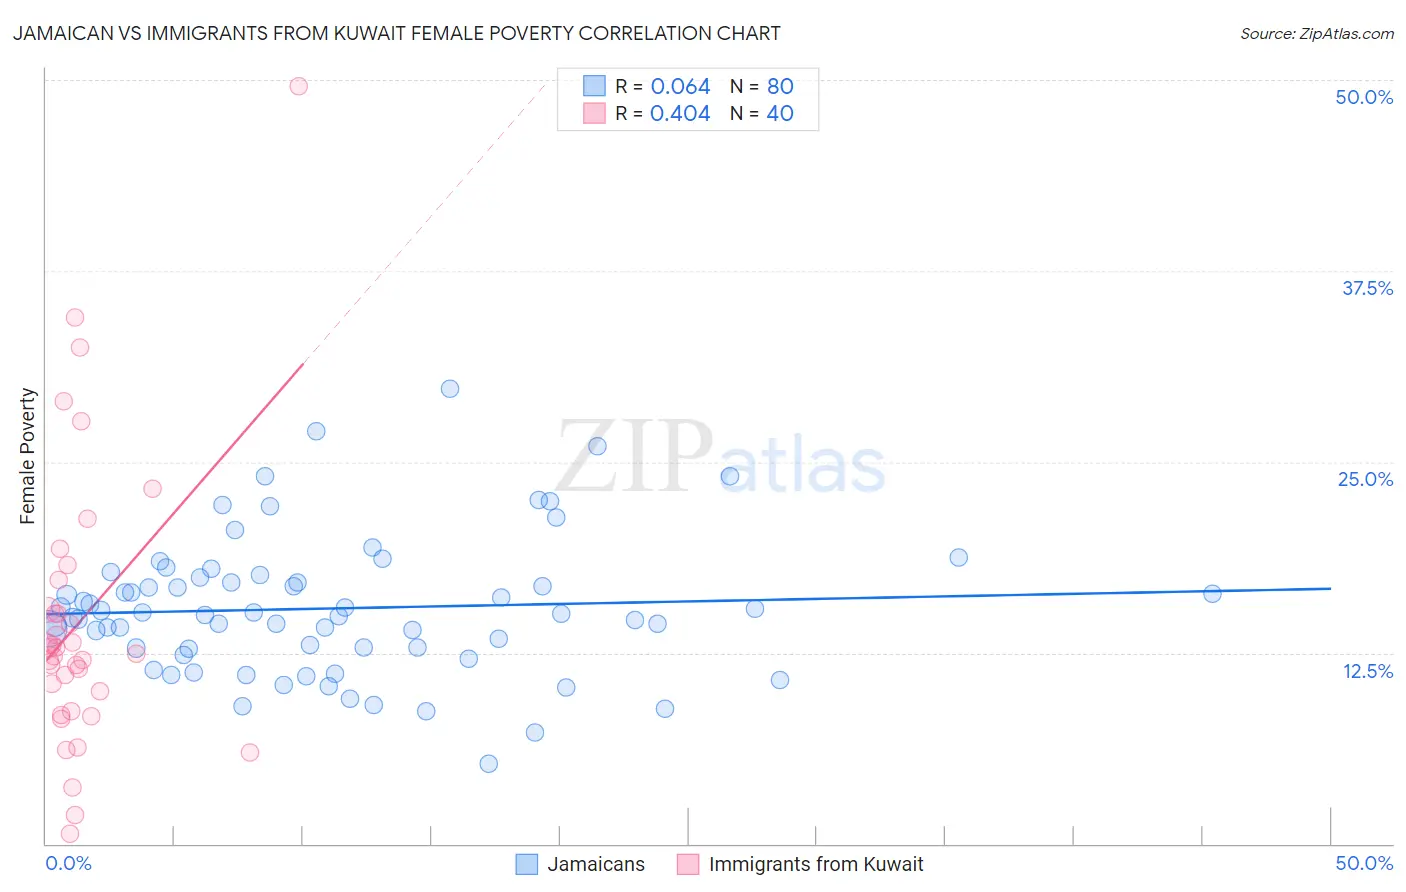
Jamaican vs Immigrants from Kuwait Female Poverty Correlation Chart
The statistical analysis conducted on geographies consisting of 367,594,174 people shows a slight positive correlation between the proportion of Jamaicans and poverty level among females in the United States with a correlation coefficient (R) of 0.064 and weighted average of 15.5%. Similarly, the statistical analysis conducted on geographies consisting of 136,883,256 people shows a moderate positive correlation between the proportion of Immigrants from Kuwait and poverty level among females in the United States with a correlation coefficient (R) of 0.404 and weighted average of 13.7%, a difference of 13.6%.
Female Poverty Correlation Summary
| Measurement | Jamaican | Immigrants from Kuwait |
| Minimum | 5.3% | 0.62% |
| Maximum | 29.8% | 49.6% |
| Range | 24.5% | 49.0% |
| Mean | 15.4% | 14.6% |
| Median | 15.0% | 12.6% |
| Interquartile 25% (IQ1) | 12.8% | 9.3% |
| Interquartile 75% (IQ3) | 17.3% | 16.3% |
| Interquartile Range (IQR) | 4.5% | 7.0% |
| Standard Deviation (Sample) | 4.5% | 9.4% |
| Standard Deviation (Population) | 4.5% | 9.3% |
Similar Demographics by Female Poverty
Demographics Similar to Jamaicans by Female Poverty
In terms of female poverty, the demographic groups most similar to Jamaicans are Immigrants from Jamaica (15.6%, a difference of 0.12%), Shoshone (15.6%, a difference of 0.19%), Ottawa (15.5%, a difference of 0.30%), Cape Verdean (15.6%, a difference of 0.30%), and Immigrants from Guyana (15.6%, a difference of 0.38%).
| Demographics | Rating | Rank | Female Poverty |
| Salvadorans | 0.3 /100 | #249 | Tragic 15.3% |
| Immigrants | Western Africa | 0.3 /100 | #250 | Tragic 15.3% |
| Immigrants | Trinidad and Tobago | 0.3 /100 | #251 | Tragic 15.4% |
| Immigrants | Burma/Myanmar | 0.3 /100 | #252 | Tragic 15.4% |
| Liberians | 0.2 /100 | #253 | Tragic 15.4% |
| Trinidadians and Tobagonians | 0.2 /100 | #254 | Tragic 15.4% |
| Ottawa | 0.2 /100 | #255 | Tragic 15.5% |
| Jamaicans | 0.2 /100 | #256 | Tragic 15.5% |
| Immigrants | Jamaica | 0.1 /100 | #257 | Tragic 15.6% |
| Shoshone | 0.1 /100 | #258 | Tragic 15.6% |
| Cape Verdeans | 0.1 /100 | #259 | Tragic 15.6% |
| Immigrants | Guyana | 0.1 /100 | #260 | Tragic 15.6% |
| Guyanese | 0.1 /100 | #261 | Tragic 15.6% |
| Mexican American Indians | 0.1 /100 | #262 | Tragic 15.6% |
| Cherokee | 0.1 /100 | #263 | Tragic 15.6% |
Demographics Similar to Immigrants from Kuwait by Female Poverty
In terms of female poverty, the demographic groups most similar to Immigrants from Kuwait are Sierra Leonean (13.7%, a difference of 0.040%), Immigrants from Costa Rica (13.7%, a difference of 0.090%), Iraqi (13.7%, a difference of 0.10%), Delaware (13.7%, a difference of 0.17%), and Immigrants from South America (13.7%, a difference of 0.23%).
| Demographics | Rating | Rank | Female Poverty |
| Immigrants | Sierra Leone | 43.2 /100 | #184 | Average 13.5% |
| Immigrants | Cameroon | 42.0 /100 | #185 | Average 13.5% |
| Immigrants | Portugal | 41.5 /100 | #186 | Average 13.6% |
| Immigrants | Venezuela | 41.0 /100 | #187 | Average 13.6% |
| Hawaiians | 39.9 /100 | #188 | Fair 13.6% |
| Uruguayans | 39.8 /100 | #189 | Fair 13.6% |
| Sierra Leoneans | 33.1 /100 | #190 | Fair 13.7% |
| Immigrants | Kuwait | 32.7 /100 | #191 | Fair 13.7% |
| Immigrants | Costa Rica | 31.9 /100 | #192 | Fair 13.7% |
| Iraqis | 31.8 /100 | #193 | Fair 13.7% |
| Delaware | 31.1 /100 | #194 | Fair 13.7% |
| Immigrants | South America | 30.6 /100 | #195 | Fair 13.7% |
| South American Indians | 28.9 /100 | #196 | Fair 13.7% |
| Arabs | 28.6 /100 | #197 | Fair 13.7% |
| Immigrants | Uganda | 28.5 /100 | #198 | Fair 13.7% |