Creek vs Immigrants from Cuba No Schooling Completed
COMPARE
Creek
Immigrants from Cuba
No Schooling Completed
No Schooling Completed Comparison
Creek
Immigrants from Cuba
1.6%
NO SCHOOLING COMPLETED
99.8/ 100
METRIC RATING
53rd/ 347
METRIC RANK
2.8%
NO SCHOOLING COMPLETED
0.0/ 100
METRIC RATING
297th/ 347
METRIC RANK
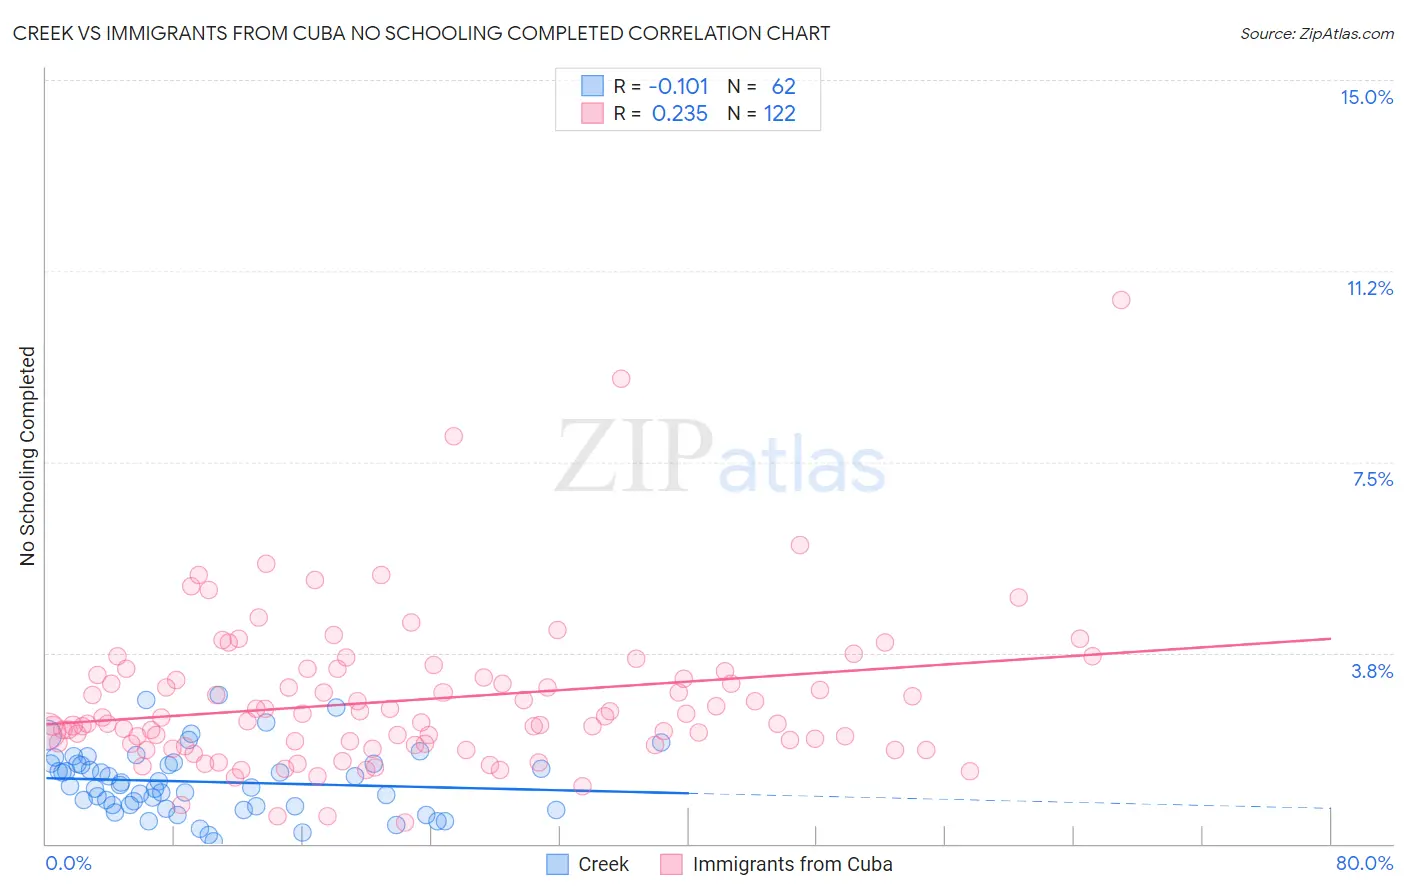
Creek vs Immigrants from Cuba No Schooling Completed Correlation Chart
The statistical analysis conducted on geographies consisting of 177,524,954 people shows a poor negative correlation between the proportion of Creek and percentage of population with no schooling in the United States with a correlation coefficient (R) of -0.101 and weighted average of 1.6%. Similarly, the statistical analysis conducted on geographies consisting of 324,009,430 people shows a weak positive correlation between the proportion of Immigrants from Cuba and percentage of population with no schooling in the United States with a correlation coefficient (R) of 0.235 and weighted average of 2.8%, a difference of 72.1%.
No Schooling Completed Correlation Summary
| Measurement | Creek | Immigrants from Cuba |
| Minimum | 0.049% | 0.42% |
| Maximum | 2.9% | 10.7% |
| Range | 2.9% | 10.3% |
| Mean | 1.2% | 2.8% |
| Median | 1.1% | 2.5% |
| Interquartile 25% (IQ1) | 0.74% | 2.0% |
| Interquartile 75% (IQ3) | 1.6% | 3.3% |
| Interquartile Range (IQR) | 0.82% | 1.4% |
| Standard Deviation (Sample) | 0.64% | 1.5% |
| Standard Deviation (Population) | 0.64% | 1.5% |
Similar Demographics by No Schooling Completed
Demographics Similar to Creek by No Schooling Completed
In terms of no schooling completed, the demographic groups most similar to Creek are Crow (1.6%, a difference of 0.030%), Immigrants from Canada (1.6%, a difference of 0.13%), Greek (1.6%, a difference of 0.15%), Immigrants from North America (1.6%, a difference of 0.15%), and Chippewa (1.6%, a difference of 0.20%).
| Demographics | Rating | Rank | No Schooling Completed |
| Maltese | 99.9 /100 | #46 | Exceptional 1.6% |
| Ottawa | 99.9 /100 | #47 | Exceptional 1.6% |
| Immigrants | Scotland | 99.9 /100 | #48 | Exceptional 1.6% |
| Whites/Caucasians | 99.9 /100 | #49 | Exceptional 1.6% |
| Celtics | 99.9 /100 | #50 | Exceptional 1.6% |
| Chippewa | 99.8 /100 | #51 | Exceptional 1.6% |
| Immigrants | Canada | 99.8 /100 | #52 | Exceptional 1.6% |
| Creek | 99.8 /100 | #53 | Exceptional 1.6% |
| Crow | 99.8 /100 | #54 | Exceptional 1.6% |
| Greeks | 99.8 /100 | #55 | Exceptional 1.6% |
| Immigrants | North America | 99.8 /100 | #56 | Exceptional 1.6% |
| Austrians | 99.8 /100 | #57 | Exceptional 1.6% |
| Kiowa | 99.8 /100 | #58 | Exceptional 1.6% |
| Slavs | 99.8 /100 | #59 | Exceptional 1.7% |
| Americans | 99.8 /100 | #60 | Exceptional 1.7% |
Demographics Similar to Immigrants from Cuba by No Schooling Completed
In terms of no schooling completed, the demographic groups most similar to Immigrants from Cuba are Immigrants from Dominica (2.8%, a difference of 0.33%), Central American Indian (2.8%, a difference of 0.84%), Immigrants (2.8%, a difference of 1.1%), Haitian (2.9%, a difference of 1.2%), and Houma (2.8%, a difference of 1.3%).
| Demographics | Rating | Rank | No Schooling Completed |
| Immigrants | Hong Kong | 0.0 /100 | #290 | Tragic 2.7% |
| British West Indians | 0.0 /100 | #291 | Tragic 2.7% |
| Immigrants | Grenada | 0.0 /100 | #292 | Tragic 2.8% |
| Malaysians | 0.0 /100 | #293 | Tragic 2.8% |
| Immigrants | Eritrea | 0.0 /100 | #294 | Tragic 2.8% |
| Houma | 0.0 /100 | #295 | Tragic 2.8% |
| Immigrants | Immigrants | 0.0 /100 | #296 | Tragic 2.8% |
| Immigrants | Cuba | 0.0 /100 | #297 | Tragic 2.8% |
| Immigrants | Dominica | 0.0 /100 | #298 | Tragic 2.8% |
| Central American Indians | 0.0 /100 | #299 | Tragic 2.8% |
| Haitians | 0.0 /100 | #300 | Tragic 2.9% |
| Immigrants | South Eastern Asia | 0.0 /100 | #301 | Tragic 2.9% |
| Immigrants | Caribbean | 0.0 /100 | #302 | Tragic 2.9% |
| Somalis | 0.0 /100 | #303 | Tragic 2.9% |
| Nicaraguans | 0.0 /100 | #304 | Tragic 2.9% |