Belgian vs French Canadian Receiving Food Stamps
COMPARE
Belgian
French Canadian
Receiving Food Stamps
Receiving Food Stamps Comparison
Belgians
French Canadians
10.2%
RECEIVING FOOD STAMPS
97.7/ 100
METRIC RATING
93rd/ 347
METRIC RANK
11.4%
RECEIVING FOOD STAMPS
69.5/ 100
METRIC RATING
160th/ 347
METRIC RANK
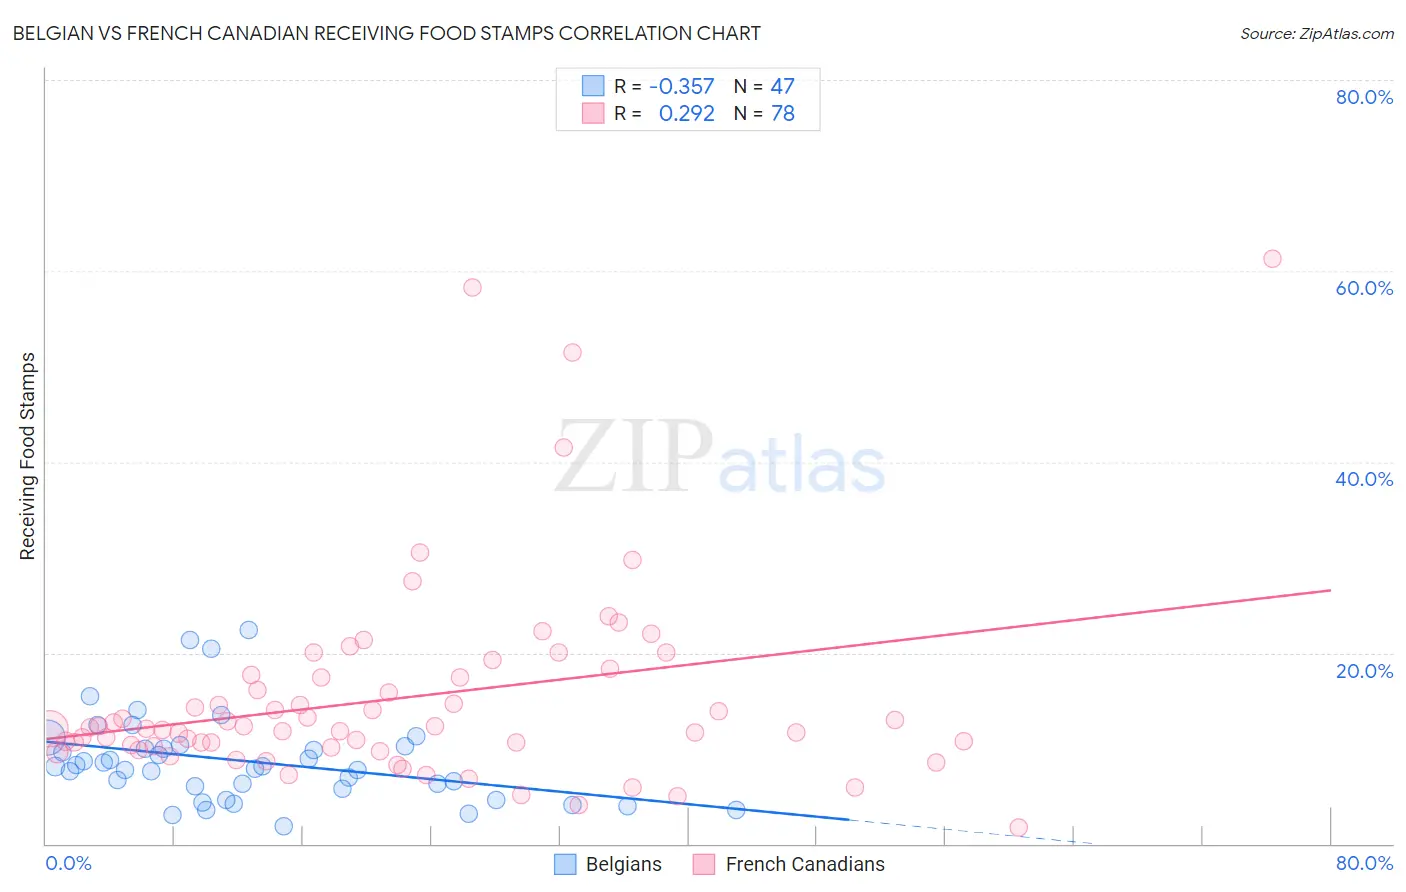
Belgian vs French Canadian Receiving Food Stamps Correlation Chart
The statistical analysis conducted on geographies consisting of 355,046,721 people shows a mild negative correlation between the proportion of Belgians and percentage of population receiving government assistance and/or food stamps in the United States with a correlation coefficient (R) of -0.357 and weighted average of 10.2%. Similarly, the statistical analysis conducted on geographies consisting of 500,490,947 people shows a weak positive correlation between the proportion of French Canadians and percentage of population receiving government assistance and/or food stamps in the United States with a correlation coefficient (R) of 0.292 and weighted average of 11.4%, a difference of 11.8%.
Receiving Food Stamps Correlation Summary
| Measurement | Belgian | French Canadian |
| Minimum | 1.8% | 1.7% |
| Maximum | 22.4% | 61.3% |
| Range | 20.6% | 59.6% |
| Mean | 8.7% | 15.3% |
| Median | 8.1% | 12.1% |
| Interquartile 25% (IQ1) | 5.8% | 10.2% |
| Interquartile 75% (IQ3) | 10.2% | 17.4% |
| Interquartile Range (IQR) | 4.4% | 7.3% |
| Standard Deviation (Sample) | 4.6% | 10.6% |
| Standard Deviation (Population) | 4.5% | 10.5% |
Similar Demographics by Receiving Food Stamps
Demographics Similar to Belgians by Receiving Food Stamps
In terms of receiving food stamps, the demographic groups most similar to Belgians are Irish (10.2%, a difference of 0.38%), Jordanian (10.2%, a difference of 0.39%), Finnish (10.2%, a difference of 0.42%), Immigrants from Greece (10.3%, a difference of 0.53%), and Basque (10.3%, a difference of 0.55%).
| Demographics | Rating | Rank | Receiving Food Stamps |
| Immigrants | Norway | 98.4 /100 | #86 | Exceptional 10.0% |
| Egyptians | 98.4 /100 | #87 | Exceptional 10.0% |
| Immigrants | Kuwait | 98.4 /100 | #88 | Exceptional 10.0% |
| Immigrants | France | 98.3 /100 | #89 | Exceptional 10.1% |
| Finns | 97.9 /100 | #90 | Exceptional 10.2% |
| Jordanians | 97.9 /100 | #91 | Exceptional 10.2% |
| Irish | 97.9 /100 | #92 | Exceptional 10.2% |
| Belgians | 97.7 /100 | #93 | Exceptional 10.2% |
| Immigrants | Greece | 97.4 /100 | #94 | Exceptional 10.3% |
| Basques | 97.4 /100 | #95 | Exceptional 10.3% |
| Welsh | 97.3 /100 | #96 | Exceptional 10.3% |
| Czechoslovakians | 97.2 /100 | #97 | Exceptional 10.3% |
| Immigrants | Egypt | 97.1 /100 | #98 | Exceptional 10.3% |
| Serbians | 97.0 /100 | #99 | Exceptional 10.3% |
| Immigrants | Western Europe | 96.9 /100 | #100 | Exceptional 10.3% |
Demographics Similar to French Canadians by Receiving Food Stamps
In terms of receiving food stamps, the demographic groups most similar to French Canadians are Immigrants from Oceania (11.4%, a difference of 0.16%), Pennsylvania German (11.4%, a difference of 0.18%), Alsatian (11.4%, a difference of 0.25%), Immigrants from Bosnia and Herzegovina (11.3%, a difference of 0.55%), and Immigrants from Southern Europe (11.5%, a difference of 0.61%).
| Demographics | Rating | Rank | Receiving Food Stamps |
| Lebanese | 81.6 /100 | #153 | Excellent 11.1% |
| Armenians | 81.4 /100 | #154 | Excellent 11.1% |
| Immigrants | Argentina | 80.4 /100 | #155 | Excellent 11.2% |
| Immigrants | Afghanistan | 75.6 /100 | #156 | Good 11.3% |
| Immigrants | Lebanon | 75.2 /100 | #157 | Good 11.3% |
| Immigrants | Bosnia and Herzegovina | 72.6 /100 | #158 | Good 11.3% |
| Immigrants | Oceania | 70.4 /100 | #159 | Good 11.4% |
| French Canadians | 69.5 /100 | #160 | Good 11.4% |
| Pennsylvania Germans | 68.4 /100 | #161 | Good 11.4% |
| Alsatians | 68.0 /100 | #162 | Good 11.4% |
| Immigrants | Southern Europe | 65.8 /100 | #163 | Good 11.5% |
| Immigrants | Chile | 65.0 /100 | #164 | Good 11.5% |
| Arabs | 64.7 /100 | #165 | Good 11.5% |
| Immigrants | Belarus | 62.8 /100 | #166 | Good 11.5% |
| Kenyans | 60.2 /100 | #167 | Good 11.6% |