Belgian vs Immigrants from Philippines Receiving Food Stamps
COMPARE
Belgian
Immigrants from Philippines
Receiving Food Stamps
Receiving Food Stamps Comparison
Belgians
Immigrants from Philippines
10.2%
RECEIVING FOOD STAMPS
97.7/ 100
METRIC RATING
93rd/ 347
METRIC RANK
10.7%
RECEIVING FOOD STAMPS
93.3/ 100
METRIC RATING
123rd/ 347
METRIC RANK
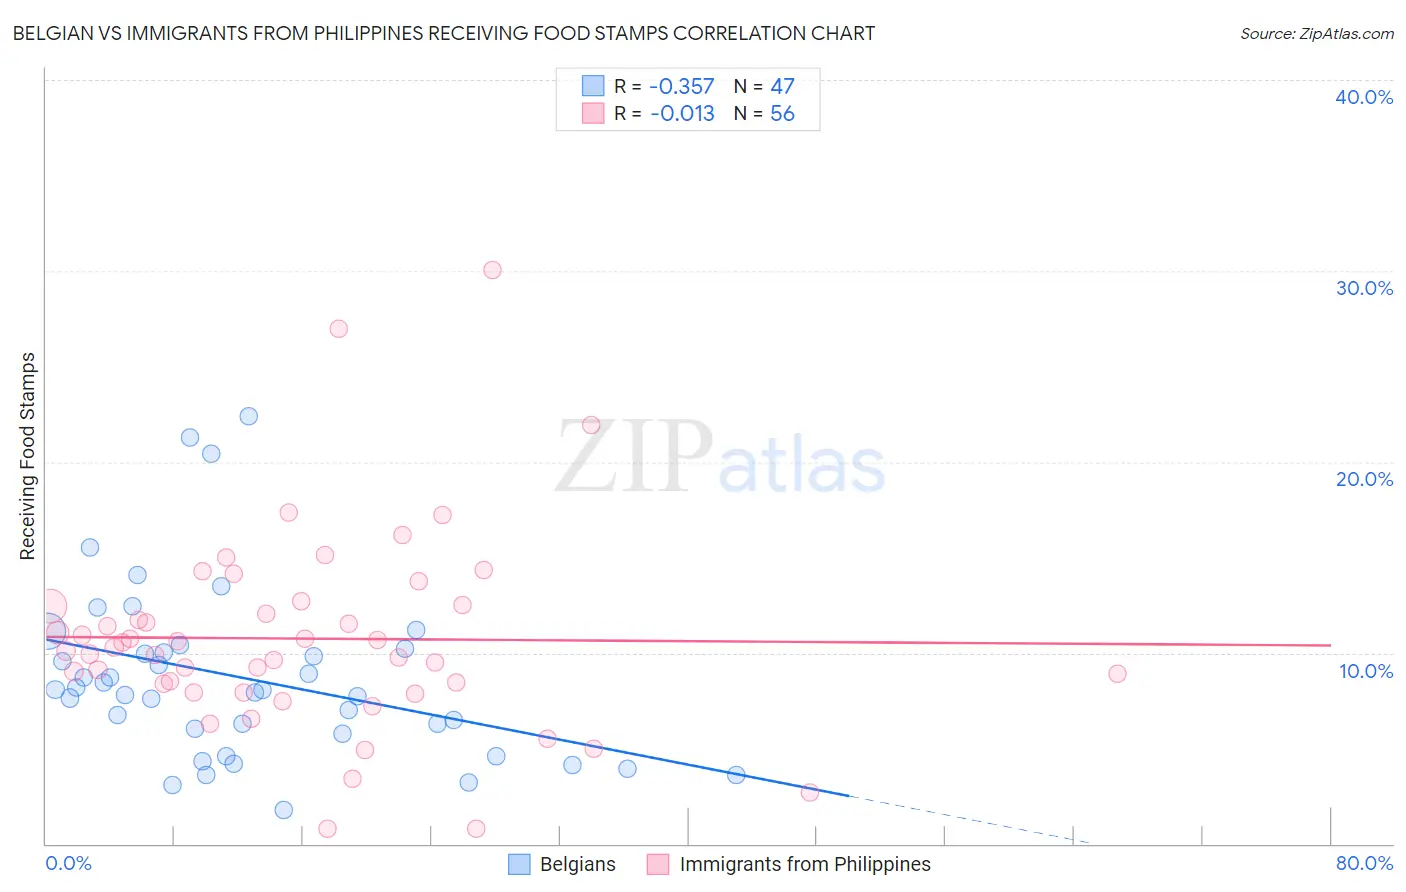
Belgian vs Immigrants from Philippines Receiving Food Stamps Correlation Chart
The statistical analysis conducted on geographies consisting of 355,046,721 people shows a mild negative correlation between the proportion of Belgians and percentage of population receiving government assistance and/or food stamps in the United States with a correlation coefficient (R) of -0.357 and weighted average of 10.2%. Similarly, the statistical analysis conducted on geographies consisting of 469,841,881 people shows no correlation between the proportion of Immigrants from Philippines and percentage of population receiving government assistance and/or food stamps in the United States with a correlation coefficient (R) of -0.013 and weighted average of 10.7%, a difference of 4.5%.
Receiving Food Stamps Correlation Summary
| Measurement | Belgian | Immigrants from Philippines |
| Minimum | 1.8% | 0.80% |
| Maximum | 22.4% | 30.1% |
| Range | 20.6% | 29.3% |
| Mean | 8.7% | 10.7% |
| Median | 8.1% | 10.2% |
| Interquartile 25% (IQ1) | 5.8% | 8.1% |
| Interquartile 75% (IQ3) | 10.2% | 12.5% |
| Interquartile Range (IQR) | 4.4% | 4.3% |
| Standard Deviation (Sample) | 4.6% | 5.2% |
| Standard Deviation (Population) | 4.5% | 5.2% |
Similar Demographics by Receiving Food Stamps
Demographics Similar to Belgians by Receiving Food Stamps
In terms of receiving food stamps, the demographic groups most similar to Belgians are Irish (10.2%, a difference of 0.38%), Jordanian (10.2%, a difference of 0.39%), Finnish (10.2%, a difference of 0.42%), Immigrants from Greece (10.3%, a difference of 0.53%), and Basque (10.3%, a difference of 0.55%).
| Demographics | Rating | Rank | Receiving Food Stamps |
| Immigrants | Norway | 98.4 /100 | #86 | Exceptional 10.0% |
| Egyptians | 98.4 /100 | #87 | Exceptional 10.0% |
| Immigrants | Kuwait | 98.4 /100 | #88 | Exceptional 10.0% |
| Immigrants | France | 98.3 /100 | #89 | Exceptional 10.1% |
| Finns | 97.9 /100 | #90 | Exceptional 10.2% |
| Jordanians | 97.9 /100 | #91 | Exceptional 10.2% |
| Irish | 97.9 /100 | #92 | Exceptional 10.2% |
| Belgians | 97.7 /100 | #93 | Exceptional 10.2% |
| Immigrants | Greece | 97.4 /100 | #94 | Exceptional 10.3% |
| Basques | 97.4 /100 | #95 | Exceptional 10.3% |
| Welsh | 97.3 /100 | #96 | Exceptional 10.3% |
| Czechoslovakians | 97.2 /100 | #97 | Exceptional 10.3% |
| Immigrants | Egypt | 97.1 /100 | #98 | Exceptional 10.3% |
| Serbians | 97.0 /100 | #99 | Exceptional 10.3% |
| Immigrants | Western Europe | 96.9 /100 | #100 | Exceptional 10.3% |
Demographics Similar to Immigrants from Philippines by Receiving Food Stamps
In terms of receiving food stamps, the demographic groups most similar to Immigrants from Philippines are Paraguayan (10.7%, a difference of 0.21%), Sri Lankan (10.6%, a difference of 0.25%), Ukrainian (10.7%, a difference of 0.29%), Slavic (10.6%, a difference of 0.33%), and Immigrants from Poland (10.6%, a difference of 0.36%).
| Demographics | Rating | Rank | Receiving Food Stamps |
| Canadians | 94.8 /100 | #116 | Exceptional 10.5% |
| Immigrants | Nepal | 94.6 /100 | #117 | Exceptional 10.6% |
| Assyrians/Chaldeans/Syriacs | 94.1 /100 | #118 | Exceptional 10.6% |
| Immigrants | Poland | 93.9 /100 | #119 | Exceptional 10.6% |
| Ethiopians | 93.9 /100 | #120 | Exceptional 10.6% |
| Slavs | 93.8 /100 | #121 | Exceptional 10.6% |
| Sri Lankans | 93.7 /100 | #122 | Exceptional 10.6% |
| Immigrants | Philippines | 93.3 /100 | #123 | Exceptional 10.7% |
| Paraguayans | 93.0 /100 | #124 | Exceptional 10.7% |
| Ukrainians | 92.8 /100 | #125 | Exceptional 10.7% |
| Afghans | 92.6 /100 | #126 | Exceptional 10.7% |
| Immigrants | Ethiopia | 92.6 /100 | #127 | Exceptional 10.7% |
| Immigrants | Jordan | 92.5 /100 | #128 | Exceptional 10.7% |
| Yugoslavians | 92.5 /100 | #129 | Exceptional 10.7% |
| Israelis | 92.4 /100 | #130 | Exceptional 10.7% |