Alaskan Athabascan vs French Canadian Receiving Food Stamps
COMPARE
Alaskan Athabascan
French Canadian
Receiving Food Stamps
Receiving Food Stamps Comparison
Alaskan Athabascans
French Canadians
14.7%
RECEIVING FOOD STAMPS
0.1/ 100
METRIC RATING
273rd/ 347
METRIC RANK
11.4%
RECEIVING FOOD STAMPS
69.5/ 100
METRIC RATING
160th/ 347
METRIC RANK
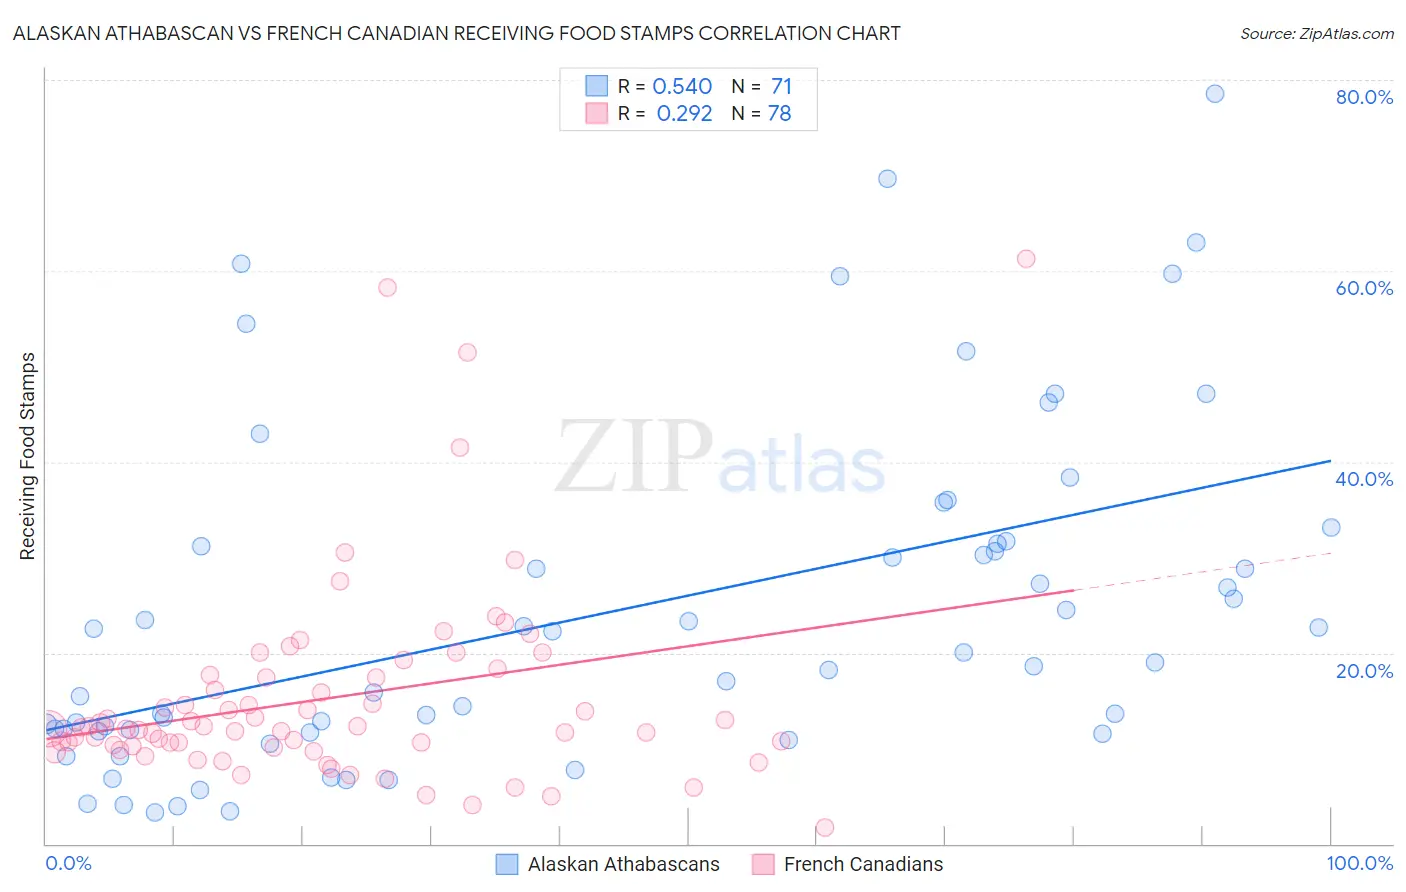
Alaskan Athabascan vs French Canadian Receiving Food Stamps Correlation Chart
The statistical analysis conducted on geographies consisting of 45,801,504 people shows a substantial positive correlation between the proportion of Alaskan Athabascans and percentage of population receiving government assistance and/or food stamps in the United States with a correlation coefficient (R) of 0.540 and weighted average of 14.7%. Similarly, the statistical analysis conducted on geographies consisting of 500,490,947 people shows a weak positive correlation between the proportion of French Canadians and percentage of population receiving government assistance and/or food stamps in the United States with a correlation coefficient (R) of 0.292 and weighted average of 11.4%, a difference of 28.8%.
Receiving Food Stamps Correlation Summary
| Measurement | Alaskan Athabascan | French Canadian |
| Minimum | 3.3% | 1.7% |
| Maximum | 78.5% | 61.3% |
| Range | 75.2% | 59.6% |
| Mean | 24.2% | 15.3% |
| Median | 19.0% | 12.1% |
| Interquartile 25% (IQ1) | 11.8% | 10.2% |
| Interquartile 75% (IQ3) | 31.4% | 17.4% |
| Interquartile Range (IQR) | 19.6% | 7.3% |
| Standard Deviation (Sample) | 17.7% | 10.6% |
| Standard Deviation (Population) | 17.5% | 10.5% |
Similar Demographics by Receiving Food Stamps
Demographics Similar to Alaskan Athabascans by Receiving Food Stamps
In terms of receiving food stamps, the demographic groups most similar to Alaskan Athabascans are Immigrants from Western Africa (14.7%, a difference of 0.020%), Chippewa (14.7%, a difference of 0.030%), Ute (14.7%, a difference of 0.10%), Immigrants from Guatemala (14.6%, a difference of 0.25%), and Mexican (14.6%, a difference of 0.35%).
| Demographics | Rating | Rank | Receiving Food Stamps |
| Cheyenne | 0.2 /100 | #266 | Tragic 14.3% |
| Dutch West Indians | 0.2 /100 | #267 | Tragic 14.3% |
| Guatemalans | 0.1 /100 | #268 | Tragic 14.4% |
| Nepalese | 0.1 /100 | #269 | Tragic 14.6% |
| Mexicans | 0.1 /100 | #270 | Tragic 14.6% |
| Immigrants | Guatemala | 0.1 /100 | #271 | Tragic 14.6% |
| Chippewa | 0.1 /100 | #272 | Tragic 14.7% |
| Alaskan Athabascans | 0.1 /100 | #273 | Tragic 14.7% |
| Immigrants | Western Africa | 0.1 /100 | #274 | Tragic 14.7% |
| Ute | 0.1 /100 | #275 | Tragic 14.7% |
| Liberians | 0.1 /100 | #276 | Tragic 14.8% |
| Seminole | 0.1 /100 | #277 | Tragic 14.8% |
| Belizeans | 0.1 /100 | #278 | Tragic 14.8% |
| Kiowa | 0.0 /100 | #279 | Tragic 14.9% |
| Ecuadorians | 0.0 /100 | #280 | Tragic 14.9% |
Demographics Similar to French Canadians by Receiving Food Stamps
In terms of receiving food stamps, the demographic groups most similar to French Canadians are Immigrants from Oceania (11.4%, a difference of 0.16%), Pennsylvania German (11.4%, a difference of 0.18%), Alsatian (11.4%, a difference of 0.25%), Immigrants from Bosnia and Herzegovina (11.3%, a difference of 0.55%), and Immigrants from Southern Europe (11.5%, a difference of 0.61%).
| Demographics | Rating | Rank | Receiving Food Stamps |
| Lebanese | 81.6 /100 | #153 | Excellent 11.1% |
| Armenians | 81.4 /100 | #154 | Excellent 11.1% |
| Immigrants | Argentina | 80.4 /100 | #155 | Excellent 11.2% |
| Immigrants | Afghanistan | 75.6 /100 | #156 | Good 11.3% |
| Immigrants | Lebanon | 75.2 /100 | #157 | Good 11.3% |
| Immigrants | Bosnia and Herzegovina | 72.6 /100 | #158 | Good 11.3% |
| Immigrants | Oceania | 70.4 /100 | #159 | Good 11.4% |
| French Canadians | 69.5 /100 | #160 | Good 11.4% |
| Pennsylvania Germans | 68.4 /100 | #161 | Good 11.4% |
| Alsatians | 68.0 /100 | #162 | Good 11.4% |
| Immigrants | Southern Europe | 65.8 /100 | #163 | Good 11.5% |
| Immigrants | Chile | 65.0 /100 | #164 | Good 11.5% |
| Arabs | 64.7 /100 | #165 | Good 11.5% |
| Immigrants | Belarus | 62.8 /100 | #166 | Good 11.5% |
| Kenyans | 60.2 /100 | #167 | Good 11.6% |