Belgian vs Sudanese Receiving Food Stamps

COMPARE

Belgian
Race
Ancestry
AfghanAfricanAlaska NativeAlaskan AthabascanAlbanianAleutAlsatianAmericanApacheArabArapahoArgentineanArmenianAssyrian/Chaldean/SyriacAustralianAustrianBahamianBangladeshiBarbadianBasqueBelgianBelizeanBermudanBhutaneseBlackfeetBolivianBrazilianBritishBritish West IndianBulgarianBurmeseCajunCambodianCanadianCape VerdeanCarpatho RusynCelticCentral AmericanCentral American IndianCherokeeCheyenneChickasawChileanChineseChippewaChoctawColombianColvilleComancheCosta RicanCreeCreekCroatianCrowCubanCypriotCzechCzechoslovakianDanishDelawareDominicanDutchDutch West IndianEastern EuropeanEcuadorianEgyptianEnglishEstonianEthiopianEuropeanFijianFilipinoFinnishFrenchFrench American IndianFrench CanadianGermanGerman RussianGhanaianGreekGuamanian/ChamorroGuatemalanGuyaneseHaitianHmongHonduranHopiHoumaHungarianIcelanderIndian (Asian)IndonesianInupiatIranianIraqiIrishIroquoisIsraeliItalianJamaicanJapaneseJordanianKenyanKiowaKoreanLaotianLatvianLebaneseLiberianLithuanianLumbeeLuxembourgerMacedonianMalaysianMalteseMarshalleseMenomineeMexicanMexican American IndianMongolianMoroccanNative HawaiianNavajoNepaleseNew ZealanderNicaraguanNigerianNorthern EuropeanNorwegianOkinawanOsageOttawaPaiutePakistaniPalestinianPanamanianParaguayanPennsylvania GermanPeruvianPimaPolishPortuguesePotawatomiPuebloPuerto RicanPuget Sound SalishRomanianRussianSalvadoranSamoanScandinavianScotch-IrishScottishSeminoleSenegaleseSerbianShoshoneSierra LeoneanSiouxSlavicSlovakSloveneSomaliSouth AfricanSouth AmericanSouth American IndianSoviet UnionSpaniardSpanishSpanish AmericanSpanish American IndianSri LankanSubsaharan AfricanSwedishSwissSyrianTaiwaneseThaiTlingit-HaidaTohono O'OdhamTonganTrinidadian and TobagonianTsimshianTurkishU.S. Virgin IslanderUgandanUkrainianUruguayanUteVenezuelanVietnameseWelshWest IndianYakamaYaquiYugoslavianYumanYup'ikZimbabwean
Immigration
NonimmigrantsImmigrantsAfghanistanAfricaAlbaniaArgentinaArmeniaAsiaAustraliaAustriaBahamasBangladeshBarbadosBelarusBelgiumBelizeBoliviaBosnia and HerzegovinaBrazilBulgariaBurma/MyanmarCabo VerdeCambodiaCameroonCanadaCaribbeanCentral AmericaChileChinaColombiaCongoCosta RicaCroatiaCubaCzechoslovakiaDenmarkDominicaDominican RepublicEastern AfricaEastern AsiaEastern EuropeEcuadorEgyptEl SalvadorEnglandEritreaEthiopiaEuropeFijiFranceGermanyGhanaGreeceGrenadaGuatemalaGuyanaHaitiHondurasHong KongHungaryIndiaIndonesiaIranIraqIrelandIsraelItalyJamaicaJapanJordanKazakhstanKenyaKoreaKuwaitLaosLatin AmericaLatviaLebanonLiberiaLithuaniaMalaysiaMexicoMicronesiaMiddle AfricaMoldovaMoroccoNepalNetherlandsNicaraguaNigeriaNorth AmericaNorth MacedoniaNorthern AfricaNorthern EuropeNorwayOceaniaPakistanPanamaPeruPhilippinesPolandPortugalRomaniaRussiaSaudi ArabiaScotlandSenegalSerbiaSierra LeoneSingaporeSomaliaSouth AfricaSouth AmericaSouth Central AsiaSouth Eastern AsiaSouthern EuropeSpainSri LankaSt. Vincent and the GrenadinesSudanSwedenSwitzerlandSyriaTaiwanThailandTrinidad and TobagoTurkeyUgandaUkraineUruguayUzbekistanVenezuelaVietnamWest IndiesWestern AfricaWestern AsiaWestern EuropeYemenZaireZimbabweAzores
Sudanese
Race
Ancestry
AfghanAfricanAlaska NativeAlaskan AthabascanAlbanianAleutAlsatianAmericanApacheArabArapahoArgentineanArmenianAssyrian/Chaldean/SyriacAustralianAustrianBahamianBangladeshiBarbadianBasqueBelizeanBermudanBhutaneseBlackfeetBolivianBrazilianBritishBritish West IndianBulgarianBurmeseCajunCambodianCanadianCape VerdeanCarpatho RusynCelticCentral AmericanCentral American IndianCherokeeCheyenneChickasawChileanChineseChippewaChoctawColombianColvilleComancheCosta RicanCreeCreekCroatianCrowCubanCypriotCzechCzechoslovakianDanishDelawareDominicanDutchDutch West IndianEastern EuropeanEcuadorianEgyptianEnglishEstonianEthiopianEuropeanFijianFilipinoFinnishFrenchFrench American IndianFrench CanadianGermanGerman RussianGhanaianGreekGuamanian/ChamorroGuatemalanGuyaneseHaitianHmongHonduranHopiHoumaHungarianIcelanderIndian (Asian)IndonesianInupiatIranianIraqiIrishIroquoisIsraeliItalianJamaicanJapaneseJordanianKenyanKiowaKoreanLaotianLatvianLebaneseLiberianLithuanianLumbeeLuxembourgerMacedonianMalaysianMalteseMarshalleseMenomineeMexicanMexican American IndianMongolianMoroccanNative HawaiianNavajoNepaleseNew ZealanderNicaraguanNigerianNorthern EuropeanNorwegianOkinawanOsageOttawaPaiutePakistaniPalestinianPanamanianParaguayanPennsylvania GermanPeruvianPimaPolishPortuguesePotawatomiPuebloPuerto RicanPuget Sound SalishRomanianRussianSalvadoranSamoanScandinavianScotch-IrishScottishSeminoleSenegaleseSerbianShoshoneSierra LeoneanSiouxSlavicSlovakSloveneSomaliSouth AfricanSouth AmericanSouth American IndianSoviet UnionSpaniardSpanishSpanish AmericanSpanish American IndianSri LankanSubsaharan AfricanSudaneseSwedishSwissSyrianTaiwaneseThaiTlingit-HaidaTohono O'OdhamTonganTrinidadian and TobagonianTsimshianTurkishU.S. Virgin IslanderUgandanUkrainianUruguayanUteVenezuelanVietnameseWelshWest IndianYakamaYaquiYugoslavianYumanYup'ikZimbabwean
Immigration
NonimmigrantsImmigrantsAfghanistanAfricaAlbaniaArgentinaArmeniaAsiaAustraliaAustriaBahamasBangladeshBarbadosBelarusBelgiumBelizeBoliviaBosnia and HerzegovinaBrazilBulgariaBurma/MyanmarCabo VerdeCambodiaCameroonCanadaCaribbeanCentral AmericaChileChinaColombiaCongoCosta RicaCroatiaCubaCzechoslovakiaDenmarkDominicaDominican RepublicEastern AfricaEastern AsiaEastern EuropeEcuadorEgyptEl SalvadorEnglandEritreaEthiopiaEuropeFijiFranceGermanyGhanaGreeceGrenadaGuatemalaGuyanaHaitiHondurasHong KongHungaryIndiaIndonesiaIranIraqIrelandIsraelItalyJamaicaJapanJordanKazakhstanKenyaKoreaKuwaitLaosLatin AmericaLatviaLebanonLiberiaLithuaniaMalaysiaMexicoMicronesiaMiddle AfricaMoldovaMoroccoNepalNetherlandsNicaraguaNigeriaNorth AmericaNorth MacedoniaNorthern AfricaNorthern EuropeNorwayOceaniaPakistanPanamaPeruPhilippinesPolandPortugalRomaniaRussiaSaudi ArabiaScotlandSenegalSerbiaSierra LeoneSingaporeSomaliaSouth AfricaSouth AmericaSouth Central AsiaSouth Eastern AsiaSouthern EuropeSpainSri LankaSt. Vincent and the GrenadinesSudanSwedenSwitzerlandSyriaTaiwanThailandTrinidad and TobagoTurkeyUgandaUkraineUruguayUzbekistanVenezuelaVietnamWest IndiesWestern AfricaWestern AsiaWestern EuropeYemenZaireZimbabweAzores
Receiving Food Stamps
Income
Poverty
Unemployment
Labor Participation
Family Structure
Vehicle Availability
Education Level
Disability

Receiving Food Stamps Comparison

Belgians

Sudanese

Exceptional
Fair
10.2%
RECEIVING FOOD STAMPS
97.7/ 100
METRIC RATING
93rd/ 347
METRIC RANK
12.0%
RECEIVING FOOD STAMPS
33.4/ 100
METRIC RATING
188th/ 347
METRIC RANK

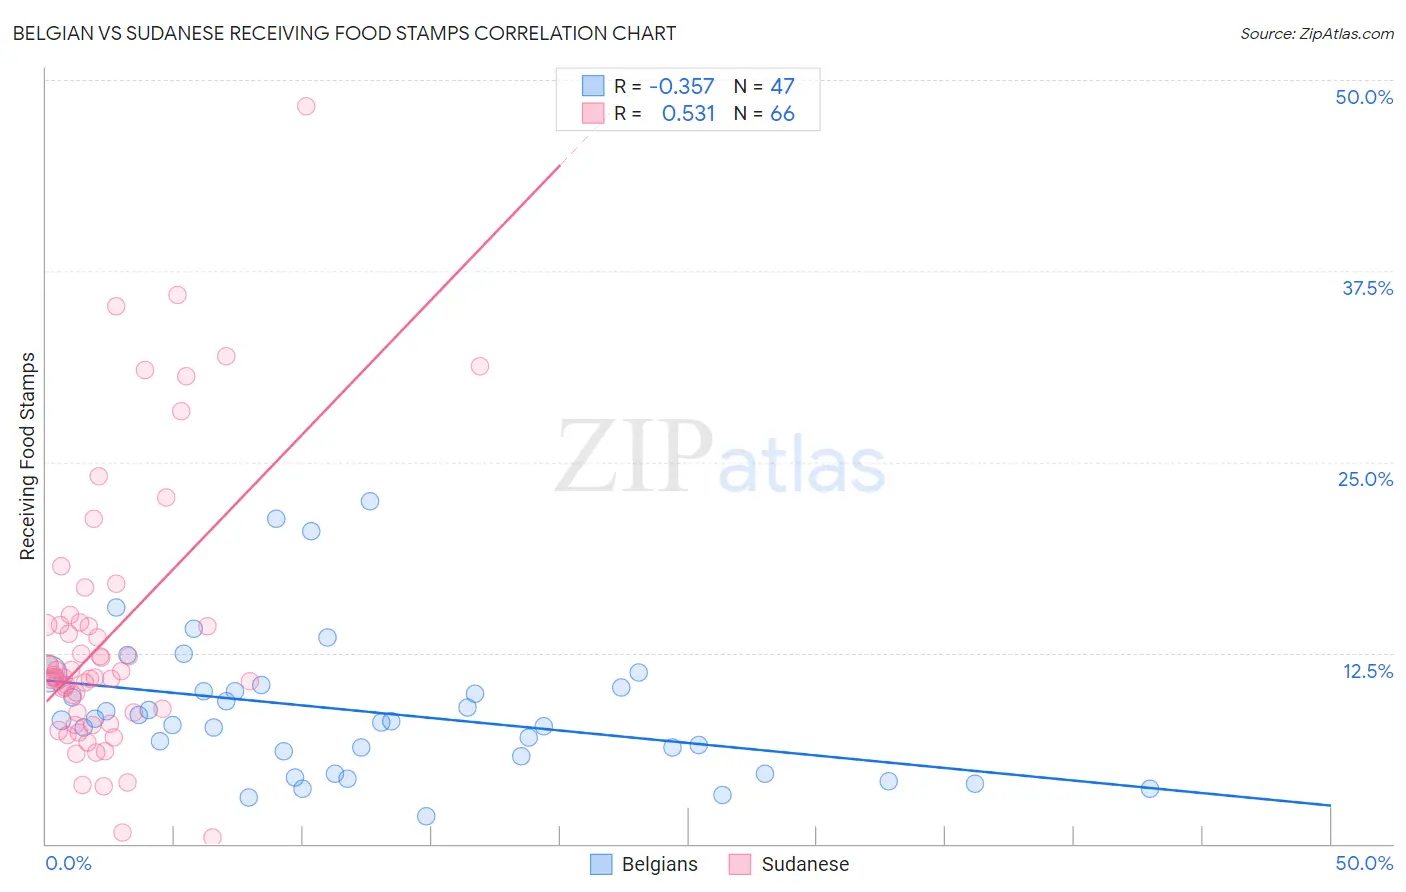
Belgian vs Sudanese Receiving Food Stamps Correlation Chart

The statistical analysis conducted on geographies consisting of 355,046,721 people shows a mild negative correlation between the proportion of Belgians and percentage of population receiving government assistance and/or food stamps in the United States with a correlation coefficient (R) of -0.357 and weighted average of 10.2%. Similarly, the statistical analysis conducted on geographies consisting of 110,066,934 people shows a substantial positive correlation between the proportion of Sudanese and percentage of population receiving government assistance and/or food stamps in the United States with a correlation coefficient (R) of 0.531 and weighted average of 12.0%, a difference of 17.9%.
Belgian vs Sudanese Receiving Food Stamps

Receiving Food Stamps Correlation Summary

MeasurementBelgianSudanese
Minimum1.8%0.40%
Maximum22.4%48.3%
Range20.6%47.9%
Mean8.7%13.6%
Median8.1%10.9%
Interquartile 25% (IQ1)5.8%8.6%
Interquartile 75% (IQ3)10.2%14.3%
Interquartile Range (IQR)4.4%5.8%
Standard Deviation (Sample)4.6%9.0%
Standard Deviation (Population)4.5%8.9%

Similar Demographics by Receiving Food Stamps

Demographics Similar to Belgians by Receiving Food Stamps

In terms of receiving food stamps, the demographic groups most similar to Belgians are Irish (10.2%, a difference of 0.38%), Jordanian (10.2%, a difference of 0.39%), Finnish (10.2%, a difference of 0.42%), Immigrants from Greece (10.3%, a difference of 0.53%), and Basque (10.3%, a difference of 0.55%).
DemographicsRating | RankReceiving Food Stamps
Immigrants | Norway
98.4
/100
|
#86
Exceptional
10.0%
Egyptians
98.4
/100
|
#87
Exceptional
10.0%
Immigrants | Kuwait
98.4
/100
|
#88
Exceptional
10.0%
Immigrants | France
98.3
/100
|
#89
Exceptional
10.1%
Finns
97.9
/100
|
#90
Exceptional
10.2%
Jordanians
97.9
/100
|
#91
Exceptional
10.2%
Irish
97.9
/100
|
#92
Exceptional
10.2%
Belgians
97.7
/100
|
#93
Exceptional
10.2%
Immigrants | Greece
97.4
/100
|
#94
Exceptional
10.3%
Basques
97.4
/100
|
#95
Exceptional
10.3%
Welsh
97.3
/100
|
#96
Exceptional
10.3%
Czechoslovakians
97.2
/100
|
#97
Exceptional
10.3%
Immigrants | Egypt
97.1
/100
|
#98
Exceptional
10.3%
Serbians
97.0
/100
|
#99
Exceptional
10.3%
Immigrants | Western Europe
96.9
/100
|
#100
Exceptional
10.3%

Demographics Similar to Sudanese by Receiving Food Stamps

In terms of receiving food stamps, the demographic groups most similar to Sudanese are Immigrants from Cameroon (12.0%, a difference of 0.14%), Immigrants from Peru (12.0%, a difference of 0.20%), Venezuelan (12.0%, a difference of 0.20%), Albanian (12.0%, a difference of 0.31%), and Samoan (12.1%, a difference of 0.38%).
DemographicsRating | RankReceiving Food Stamps
South American Indians
41.7
/100
|
#181
Average
11.9%
Immigrants | Morocco
40.7
/100
|
#182
Average
11.9%
Immigrants | Uganda
40.3
/100
|
#183
Average
11.9%
Spaniards
39.8
/100
|
#184
Fair
11.9%
Immigrants | Iraq
37.1
/100
|
#185
Fair
12.0%
Spanish
36.9
/100
|
#186
Fair
12.0%
Albanians
35.4
/100
|
#187
Fair
12.0%
Sudanese
33.4
/100
|
#188
Fair
12.0%
Immigrants | Cameroon
32.5
/100
|
#189
Fair
12.0%
Immigrants | Peru
32.2
/100
|
#190
Fair
12.0%
Venezuelans
32.1
/100
|
#191
Fair
12.0%
Samoans
31.0
/100
|
#192
Fair
12.1%
Immigrants | Fiji
27.8
/100
|
#193
Fair
12.1%
Immigrants | Sudan
27.1
/100
|
#194
Fair
12.1%
Americans
26.7
/100
|
#195
Fair
12.2%