Basque vs Filipino Married-Couple Family Poverty
COMPARE
Basque
Filipino
Married-Couple Family Poverty
Married-Couple Family Poverty Comparison
Basques
Filipinos
4.6%
MARRIED-COUPLE FAMILY POVERTY
98.5/ 100
METRIC RATING
91st/ 347
METRIC RANK
4.0%
MARRIED-COUPLE FAMILY POVERTY
100.0/ 100
METRIC RATING
17th/ 347
METRIC RANK
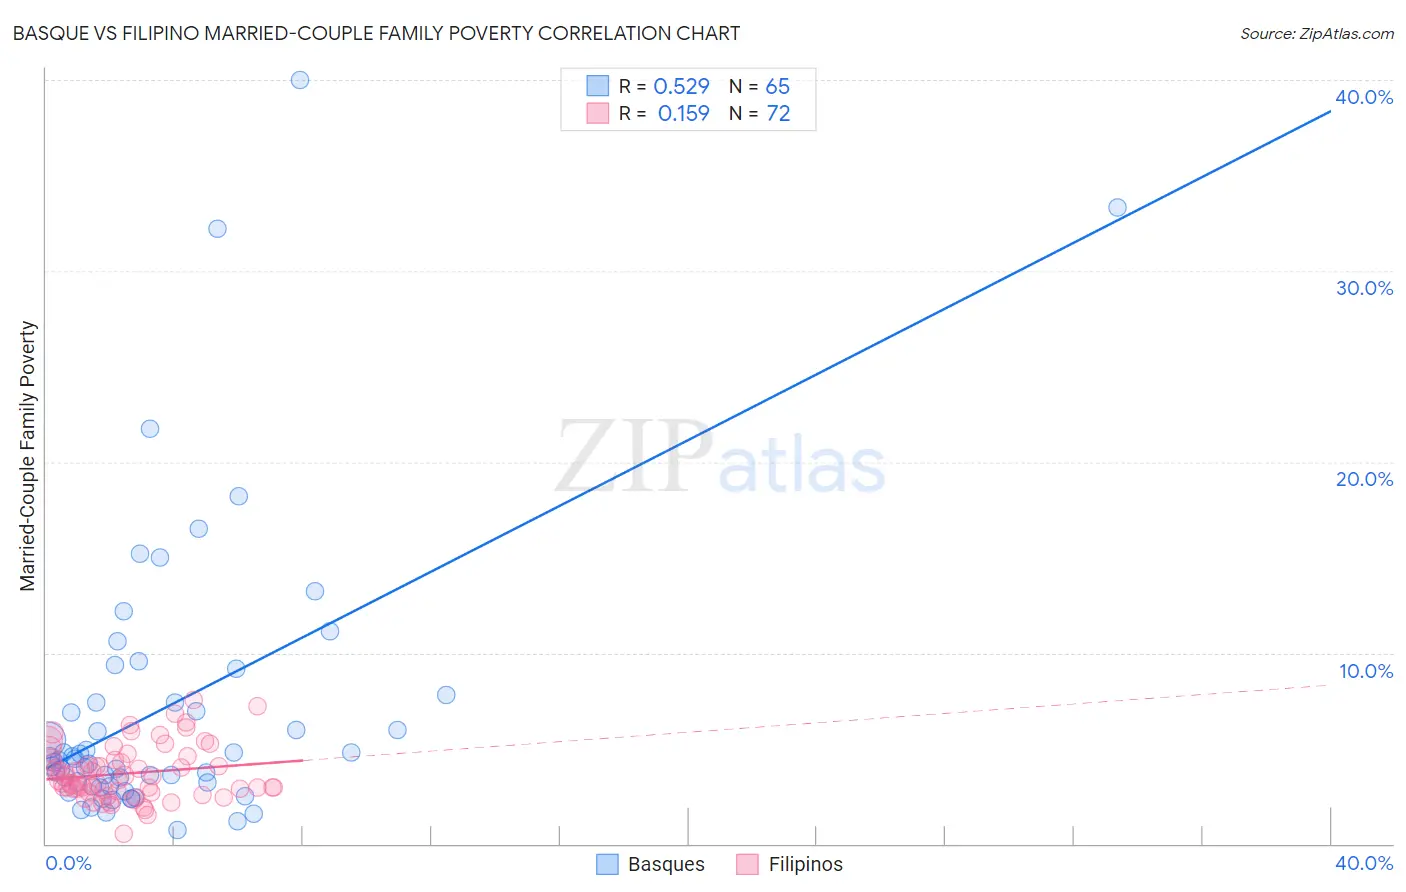
Basque vs Filipino Married-Couple Family Poverty Correlation Chart
The statistical analysis conducted on geographies consisting of 165,263,383 people shows a substantial positive correlation between the proportion of Basques and poverty level among married-couple families in the United States with a correlation coefficient (R) of 0.529 and weighted average of 4.6%. Similarly, the statistical analysis conducted on geographies consisting of 252,645,683 people shows a poor positive correlation between the proportion of Filipinos and poverty level among married-couple families in the United States with a correlation coefficient (R) of 0.159 and weighted average of 4.0%, a difference of 13.7%.
Married-Couple Family Poverty Correlation Summary
| Measurement | Basque | Filipino |
| Minimum | 0.72% | 0.49% |
| Maximum | 40.0% | 7.5% |
| Range | 39.3% | 7.0% |
| Mean | 7.1% | 3.7% |
| Median | 4.4% | 3.3% |
| Interquartile 25% (IQ1) | 3.0% | 2.8% |
| Interquartile 75% (IQ3) | 7.6% | 4.4% |
| Interquartile Range (IQR) | 4.6% | 1.6% |
| Standard Deviation (Sample) | 7.6% | 1.4% |
| Standard Deviation (Population) | 7.6% | 1.4% |
Similar Demographics by Married-Couple Family Poverty
Demographics Similar to Basques by Married-Couple Family Poverty
In terms of married-couple family poverty, the demographic groups most similar to Basques are Immigrants from Switzerland (4.6%, a difference of 0.040%), Immigrants from Norway (4.6%, a difference of 0.080%), Immigrants from Czechoslovakia (4.6%, a difference of 0.11%), Bolivian (4.6%, a difference of 0.22%), and Korean (4.6%, a difference of 0.26%).
| Demographics | Rating | Rank | Married-Couple Family Poverty |
| Immigrants | Croatia | 98.7 /100 | #84 | Exceptional 4.6% |
| South Africans | 98.7 /100 | #85 | Exceptional 4.6% |
| Immigrants | Turkey | 98.6 /100 | #86 | Exceptional 4.6% |
| Immigrants | North Macedonia | 98.6 /100 | #87 | Exceptional 4.6% |
| Bolivians | 98.6 /100 | #88 | Exceptional 4.6% |
| Immigrants | Czechoslovakia | 98.5 /100 | #89 | Exceptional 4.6% |
| Immigrants | Switzerland | 98.5 /100 | #90 | Exceptional 4.6% |
| Basques | 98.5 /100 | #91 | Exceptional 4.6% |
| Immigrants | Norway | 98.4 /100 | #92 | Exceptional 4.6% |
| Koreans | 98.3 /100 | #93 | Exceptional 4.6% |
| Immigrants | Italy | 98.3 /100 | #94 | Exceptional 4.6% |
| Portuguese | 98.3 /100 | #95 | Exceptional 4.6% |
| Immigrants | Poland | 98.3 /100 | #96 | Exceptional 4.6% |
| Immigrants | Belgium | 98.2 /100 | #97 | Exceptional 4.6% |
| Native Hawaiians | 98.0 /100 | #98 | Exceptional 4.6% |
Demographics Similar to Filipinos by Married-Couple Family Poverty
In terms of married-couple family poverty, the demographic groups most similar to Filipinos are Italian (4.0%, a difference of 0.010%), German (4.0%, a difference of 0.030%), Polish (4.0%, a difference of 0.30%), Slovak (4.0%, a difference of 0.33%), and Czech (4.0%, a difference of 0.37%).
| Demographics | Rating | Rank | Married-Couple Family Poverty |
| Carpatho Rusyns | 100.0 /100 | #10 | Exceptional 3.9% |
| Lithuanians | 100.0 /100 | #11 | Exceptional 4.0% |
| Bulgarians | 100.0 /100 | #12 | Exceptional 4.0% |
| Czechs | 100.0 /100 | #13 | Exceptional 4.0% |
| Slovaks | 100.0 /100 | #14 | Exceptional 4.0% |
| Poles | 100.0 /100 | #15 | Exceptional 4.0% |
| Germans | 100.0 /100 | #16 | Exceptional 4.0% |
| Filipinos | 100.0 /100 | #17 | Exceptional 4.0% |
| Italians | 100.0 /100 | #18 | Exceptional 4.0% |
| Immigrants | Ireland | 99.9 /100 | #19 | Exceptional 4.1% |
| Maltese | 99.9 /100 | #20 | Exceptional 4.1% |
| Zimbabweans | 99.9 /100 | #21 | Exceptional 4.1% |
| Immigrants | Singapore | 99.9 /100 | #22 | Exceptional 4.1% |
| Bhutanese | 99.9 /100 | #23 | Exceptional 4.1% |
| Eastern Europeans | 99.9 /100 | #24 | Exceptional 4.1% |