Bahamian vs Immigrants from Fiji Family Poverty
COMPARE
Bahamian
Immigrants from Fiji
Family Poverty
Family Poverty Comparison
Bahamians
Immigrants from Fiji
11.7%
FAMILY POVERTY
0.0/ 100
METRIC RATING
301st/ 347
METRIC RANK
8.9%
FAMILY POVERTY
56.4/ 100
METRIC RATING
173rd/ 347
METRIC RANK
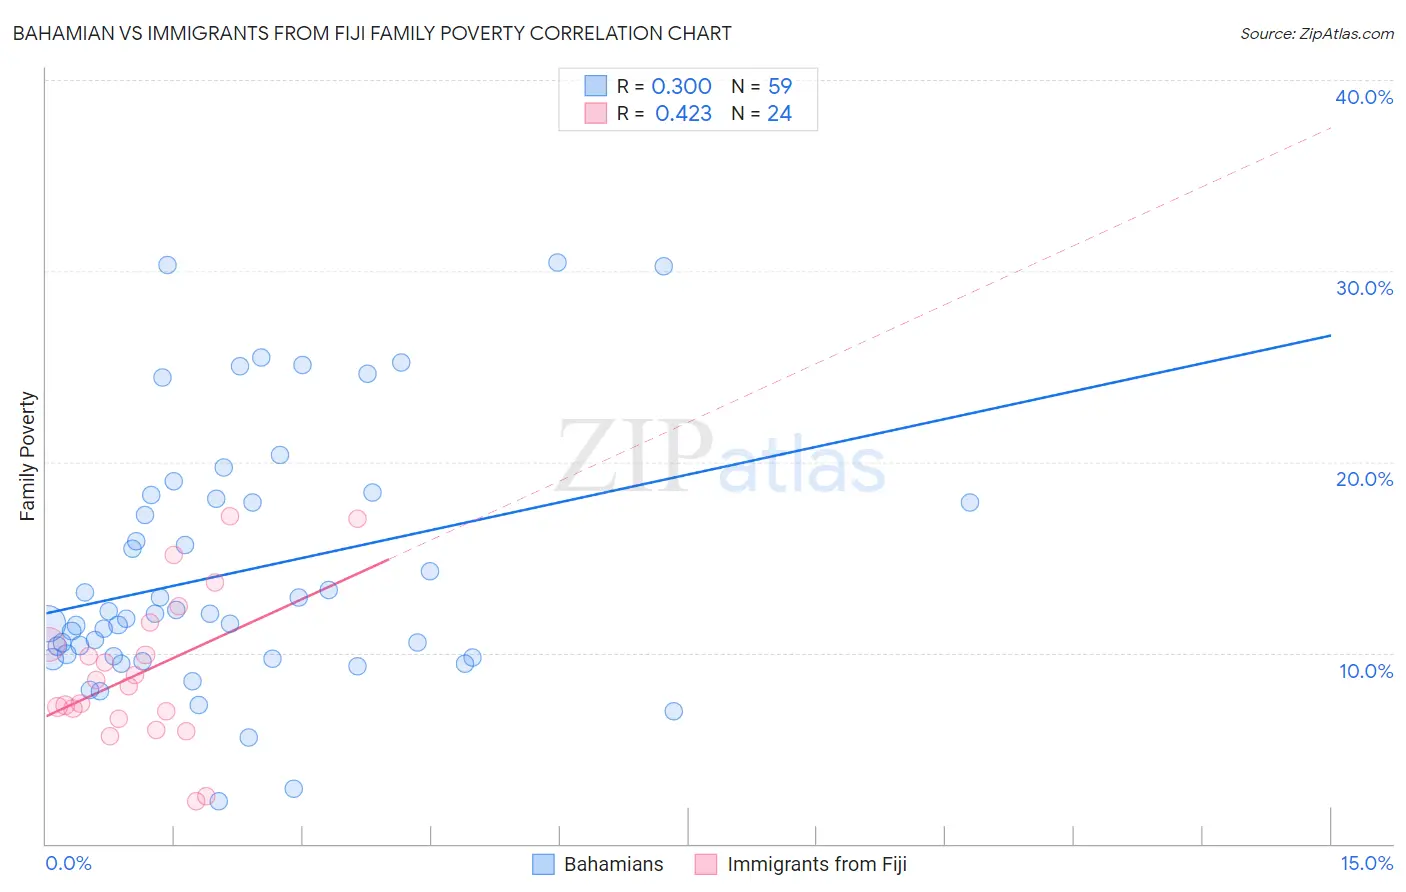
Bahamian vs Immigrants from Fiji Family Poverty Correlation Chart
The statistical analysis conducted on geographies consisting of 112,580,407 people shows a weak positive correlation between the proportion of Bahamians and poverty level among families in the United States with a correlation coefficient (R) of 0.300 and weighted average of 11.7%. Similarly, the statistical analysis conducted on geographies consisting of 93,742,503 people shows a moderate positive correlation between the proportion of Immigrants from Fiji and poverty level among families in the United States with a correlation coefficient (R) of 0.423 and weighted average of 8.9%, a difference of 31.1%.
Family Poverty Correlation Summary
| Measurement | Bahamian | Immigrants from Fiji |
| Minimum | 2.2% | 2.3% |
| Maximum | 30.4% | 17.2% |
| Range | 28.2% | 14.9% |
| Mean | 14.2% | 9.0% |
| Median | 12.1% | 8.4% |
| Interquartile 25% (IQ1) | 9.7% | 6.7% |
| Interquartile 75% (IQ3) | 18.1% | 11.0% |
| Interquartile Range (IQR) | 8.3% | 4.3% |
| Standard Deviation (Sample) | 6.6% | 3.9% |
| Standard Deviation (Population) | 6.6% | 3.8% |
Similar Demographics by Family Poverty
Demographics Similar to Bahamians by Family Poverty
In terms of family poverty, the demographic groups most similar to Bahamians are Guatemalan (11.7%, a difference of 0.040%), Immigrants from Bangladesh (11.7%, a difference of 0.25%), Dutch West Indian (11.7%, a difference of 0.27%), Immigrants from Senegal (11.7%, a difference of 0.36%), and Creek (11.7%, a difference of 0.50%).
| Demographics | Rating | Rank | Family Poverty |
| Immigrants | St. Vincent and the Grenadines | 0.0 /100 | #294 | Tragic 11.6% |
| Immigrants | Haiti | 0.0 /100 | #295 | Tragic 11.6% |
| Choctaw | 0.0 /100 | #296 | Tragic 11.6% |
| Creek | 0.0 /100 | #297 | Tragic 11.7% |
| Immigrants | Senegal | 0.0 /100 | #298 | Tragic 11.7% |
| Dutch West Indians | 0.0 /100 | #299 | Tragic 11.7% |
| Immigrants | Bangladesh | 0.0 /100 | #300 | Tragic 11.7% |
| Bahamians | 0.0 /100 | #301 | Tragic 11.7% |
| Guatemalans | 0.0 /100 | #302 | Tragic 11.7% |
| Africans | 0.0 /100 | #303 | Tragic 11.8% |
| Immigrants | Latin America | 0.0 /100 | #304 | Tragic 11.8% |
| Mexicans | 0.0 /100 | #305 | Tragic 11.8% |
| Cajuns | 0.0 /100 | #306 | Tragic 11.9% |
| Immigrants | Congo | 0.0 /100 | #307 | Tragic 11.9% |
| Seminole | 0.0 /100 | #308 | Tragic 11.9% |
Demographics Similar to Immigrants from Fiji by Family Poverty
In terms of family poverty, the demographic groups most similar to Immigrants from Fiji are Immigrants from Peru (8.9%, a difference of 0.15%), Lebanese (8.9%, a difference of 0.16%), Kenyan (8.9%, a difference of 0.25%), Immigrants from Chile (8.9%, a difference of 0.44%), and Israeli (8.9%, a difference of 0.79%).
| Demographics | Rating | Rank | Family Poverty |
| Afghans | 63.5 /100 | #166 | Good 8.8% |
| Immigrants | Ethiopia | 62.5 /100 | #167 | Good 8.9% |
| Israelis | 62.1 /100 | #168 | Good 8.9% |
| Immigrants | Chile | 59.6 /100 | #169 | Average 8.9% |
| Kenyans | 58.2 /100 | #170 | Average 8.9% |
| Lebanese | 57.6 /100 | #171 | Average 8.9% |
| Immigrants | Peru | 57.5 /100 | #172 | Average 8.9% |
| Immigrants | Fiji | 56.4 /100 | #173 | Average 8.9% |
| Immigrants | Albania | 50.0 /100 | #174 | Average 9.0% |
| Costa Ricans | 49.3 /100 | #175 | Average 9.0% |
| Immigrants | Syria | 47.5 /100 | #176 | Average 9.0% |
| Hawaiians | 47.2 /100 | #177 | Average 9.0% |
| Immigrants | Cameroon | 47.1 /100 | #178 | Average 9.0% |
| Immigrants | Iraq | 44.4 /100 | #179 | Average 9.1% |
| Immigrants | Uganda | 43.4 /100 | #180 | Average 9.1% |