Bahamian vs Tohono O'odham Family Poverty
COMPARE
Bahamian
Tohono O'odham
Family Poverty
Family Poverty Comparison
Bahamians
Tohono O'odham
11.7%
FAMILY POVERTY
0.0/ 100
METRIC RATING
301st/ 347
METRIC RANK
20.4%
FAMILY POVERTY
0.0/ 100
METRIC RATING
347th/ 347
METRIC RANK
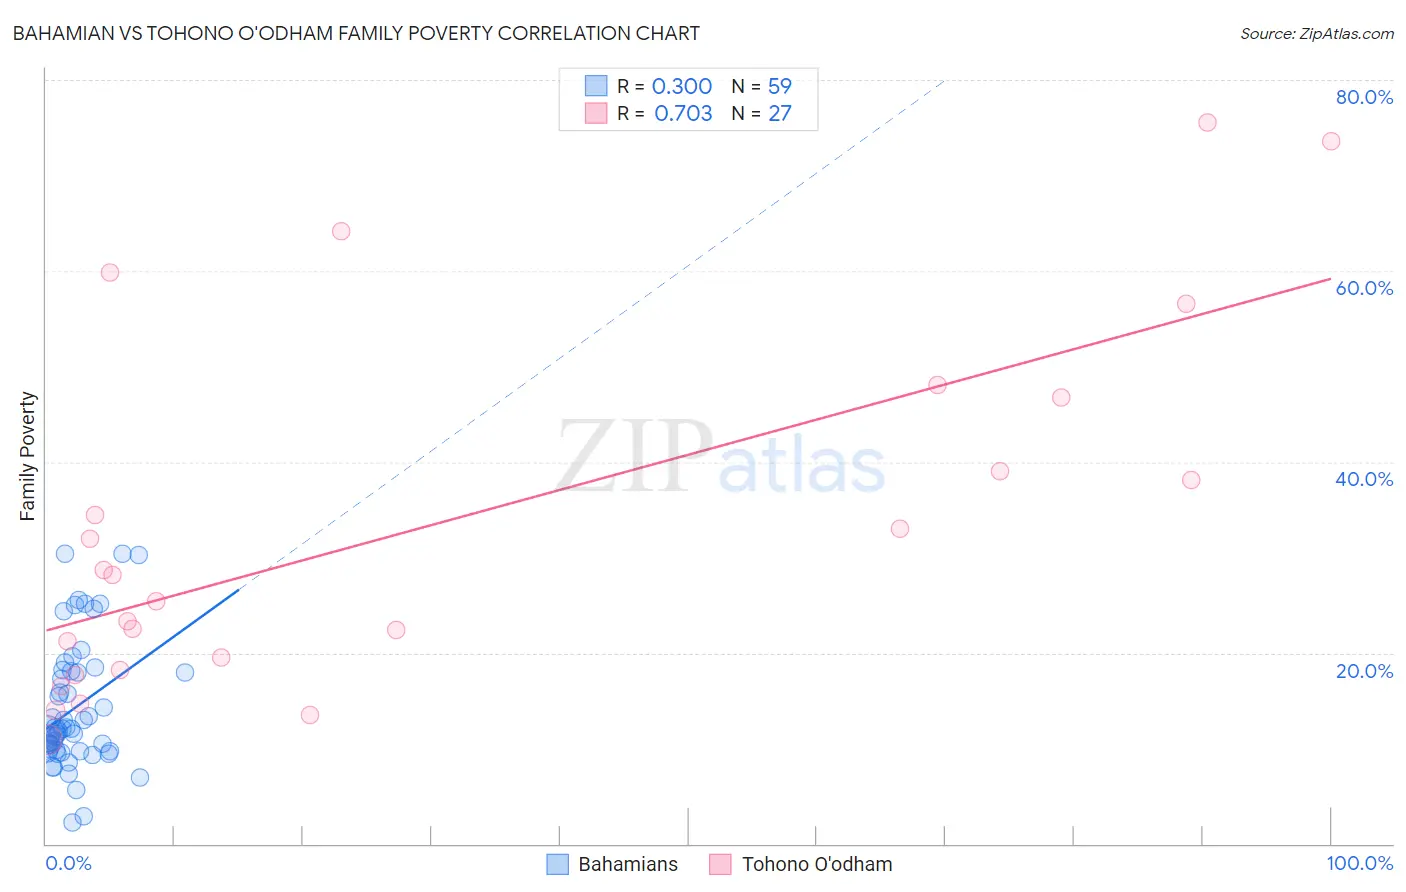
Bahamian vs Tohono O'odham Family Poverty Correlation Chart
The statistical analysis conducted on geographies consisting of 112,580,407 people shows a weak positive correlation between the proportion of Bahamians and poverty level among families in the United States with a correlation coefficient (R) of 0.300 and weighted average of 11.7%. Similarly, the statistical analysis conducted on geographies consisting of 58,710,760 people shows a strong positive correlation between the proportion of Tohono O'odham and poverty level among families in the United States with a correlation coefficient (R) of 0.703 and weighted average of 20.4%, a difference of 74.2%.
Family Poverty Correlation Summary
| Measurement | Bahamian | Tohono O'odham |
| Minimum | 2.2% | 10.9% |
| Maximum | 30.4% | 75.6% |
| Range | 28.2% | 64.7% |
| Mean | 14.2% | 33.2% |
| Median | 12.1% | 28.2% |
| Interquartile 25% (IQ1) | 9.7% | 18.3% |
| Interquartile 75% (IQ3) | 18.1% | 46.7% |
| Interquartile Range (IQR) | 8.3% | 28.5% |
| Standard Deviation (Sample) | 6.6% | 18.8% |
| Standard Deviation (Population) | 6.6% | 18.5% |
Similar Demographics by Family Poverty
Demographics Similar to Bahamians by Family Poverty
In terms of family poverty, the demographic groups most similar to Bahamians are Guatemalan (11.7%, a difference of 0.040%), Immigrants from Bangladesh (11.7%, a difference of 0.25%), Dutch West Indian (11.7%, a difference of 0.27%), Immigrants from Senegal (11.7%, a difference of 0.36%), and Creek (11.7%, a difference of 0.50%).
| Demographics | Rating | Rank | Family Poverty |
| Immigrants | St. Vincent and the Grenadines | 0.0 /100 | #294 | Tragic 11.6% |
| Immigrants | Haiti | 0.0 /100 | #295 | Tragic 11.6% |
| Choctaw | 0.0 /100 | #296 | Tragic 11.6% |
| Creek | 0.0 /100 | #297 | Tragic 11.7% |
| Immigrants | Senegal | 0.0 /100 | #298 | Tragic 11.7% |
| Dutch West Indians | 0.0 /100 | #299 | Tragic 11.7% |
| Immigrants | Bangladesh | 0.0 /100 | #300 | Tragic 11.7% |
| Bahamians | 0.0 /100 | #301 | Tragic 11.7% |
| Guatemalans | 0.0 /100 | #302 | Tragic 11.7% |
| Africans | 0.0 /100 | #303 | Tragic 11.8% |
| Immigrants | Latin America | 0.0 /100 | #304 | Tragic 11.8% |
| Mexicans | 0.0 /100 | #305 | Tragic 11.8% |
| Cajuns | 0.0 /100 | #306 | Tragic 11.9% |
| Immigrants | Congo | 0.0 /100 | #307 | Tragic 11.9% |
| Seminole | 0.0 /100 | #308 | Tragic 11.9% |
Demographics Similar to Tohono O'odham by Family Poverty
In terms of family poverty, the demographic groups most similar to Tohono O'odham are Puerto Rican (20.3%, a difference of 0.37%), Navajo (18.8%, a difference of 8.5%), Yup'ik (18.7%, a difference of 9.0%), Pima (18.4%, a difference of 11.1%), and Immigrants from Yemen (17.5%, a difference of 16.8%).
| Demographics | Rating | Rank | Family Poverty |
| Immigrants | Dominican Republic | 0.0 /100 | #333 | Tragic 14.4% |
| Houma | 0.0 /100 | #334 | Tragic 14.6% |
| Apache | 0.0 /100 | #335 | Tragic 14.7% |
| Sioux | 0.0 /100 | #336 | Tragic 15.9% |
| Hopi | 0.0 /100 | #337 | Tragic 15.9% |
| Crow | 0.0 /100 | #338 | Tragic 16.1% |
| Yuman | 0.0 /100 | #339 | Tragic 16.6% |
| Pueblo | 0.0 /100 | #340 | Tragic 17.0% |
| Lumbee | 0.0 /100 | #341 | Tragic 17.0% |
| Immigrants | Yemen | 0.0 /100 | #342 | Tragic 17.5% |
| Pima | 0.0 /100 | #343 | Tragic 18.4% |
| Yup'ik | 0.0 /100 | #344 | Tragic 18.7% |
| Navajo | 0.0 /100 | #345 | Tragic 18.8% |
| Puerto Ricans | 0.0 /100 | #346 | Tragic 20.3% |
| Tohono O'odham | 0.0 /100 | #347 | Tragic 20.4% |