Armenian vs Immigrants from Fiji Family Poverty
COMPARE
Armenian
Immigrants from Fiji
Family Poverty
Family Poverty Comparison
Armenians
Immigrants from Fiji
8.5%
FAMILY POVERTY
84.6/ 100
METRIC RATING
138th/ 347
METRIC RANK
8.9%
FAMILY POVERTY
56.4/ 100
METRIC RATING
173rd/ 347
METRIC RANK
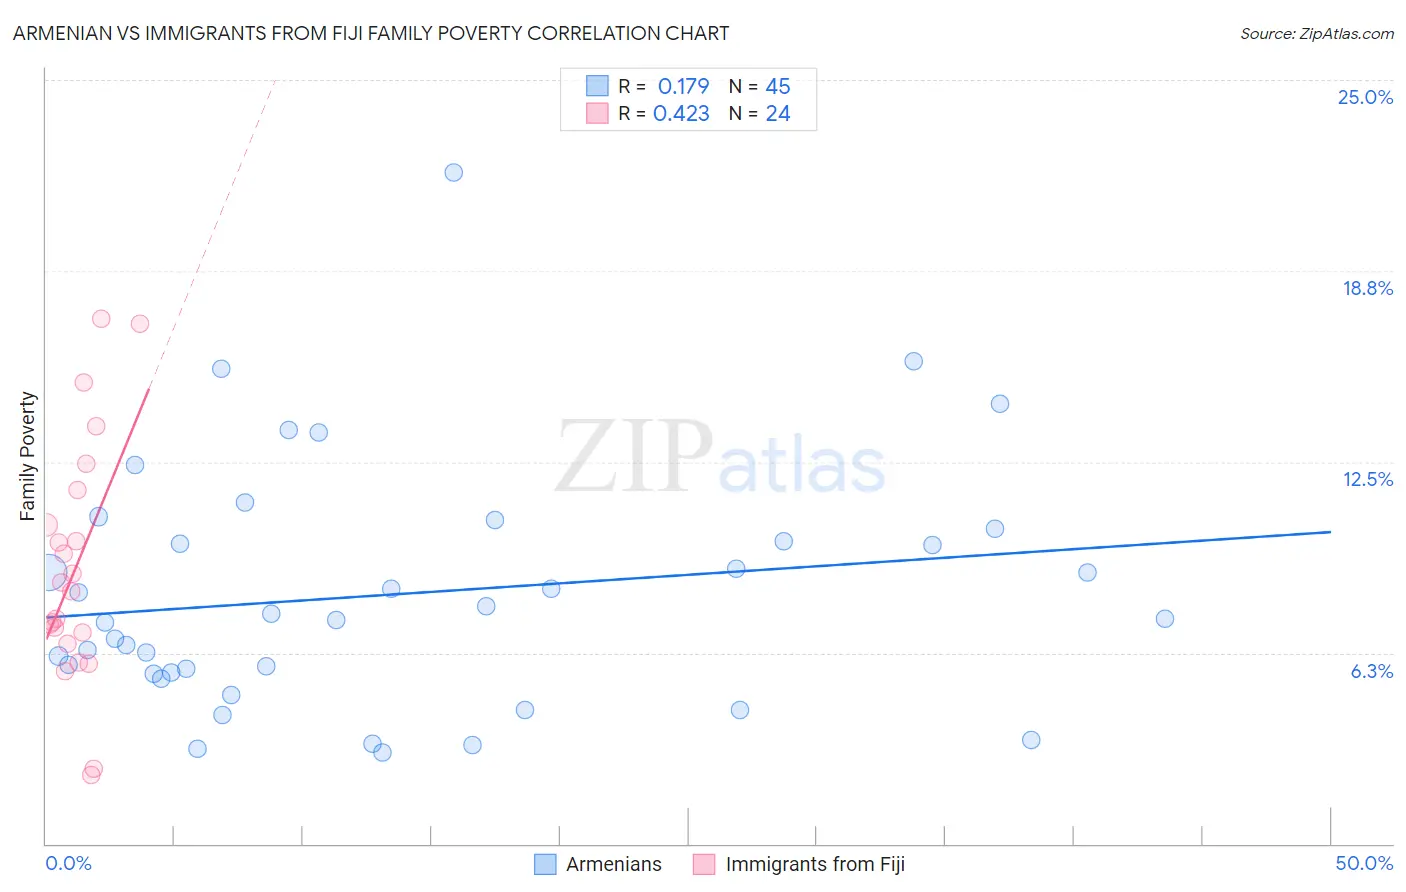
Armenian vs Immigrants from Fiji Family Poverty Correlation Chart
The statistical analysis conducted on geographies consisting of 310,074,733 people shows a poor positive correlation between the proportion of Armenians and poverty level among families in the United States with a correlation coefficient (R) of 0.179 and weighted average of 8.5%. Similarly, the statistical analysis conducted on geographies consisting of 93,742,503 people shows a moderate positive correlation between the proportion of Immigrants from Fiji and poverty level among families in the United States with a correlation coefficient (R) of 0.423 and weighted average of 8.9%, a difference of 5.0%.
Family Poverty Correlation Summary
| Measurement | Armenian | Immigrants from Fiji |
| Minimum | 3.0% | 2.3% |
| Maximum | 22.0% | 17.2% |
| Range | 19.0% | 14.9% |
| Mean | 8.2% | 9.0% |
| Median | 7.4% | 8.4% |
| Interquartile 25% (IQ1) | 5.6% | 6.7% |
| Interquartile 75% (IQ3) | 10.1% | 11.0% |
| Interquartile Range (IQR) | 4.5% | 4.3% |
| Standard Deviation (Sample) | 4.0% | 3.9% |
| Standard Deviation (Population) | 3.9% | 3.8% |
Similar Demographics by Family Poverty
Demographics Similar to Armenians by Family Poverty
In terms of family poverty, the demographic groups most similar to Armenians are Immigrants from Nepal (8.5%, a difference of 0.12%), Immigrants from Kazakhstan (8.5%, a difference of 0.15%), Immigrants from Ukraine (8.5%, a difference of 0.18%), Yugoslavian (8.5%, a difference of 0.30%), and Immigrants from Germany (8.5%, a difference of 0.33%).
| Demographics | Rating | Rank | Family Poverty |
| Puget Sound Salish | 88.6 /100 | #131 | Excellent 8.4% |
| Immigrants | Argentina | 88.2 /100 | #132 | Excellent 8.4% |
| Sri Lankans | 86.6 /100 | #133 | Excellent 8.5% |
| Chileans | 86.6 /100 | #134 | Excellent 8.5% |
| Immigrants | Malaysia | 86.5 /100 | #135 | Excellent 8.5% |
| Immigrants | Brazil | 86.3 /100 | #136 | Excellent 8.5% |
| Immigrants | Southern Europe | 86.0 /100 | #137 | Excellent 8.5% |
| Armenians | 84.6 /100 | #138 | Excellent 8.5% |
| Immigrants | Nepal | 84.2 /100 | #139 | Excellent 8.5% |
| Immigrants | Kazakhstan | 84.1 /100 | #140 | Excellent 8.5% |
| Immigrants | Ukraine | 83.9 /100 | #141 | Excellent 8.5% |
| Yugoslavians | 83.5 /100 | #142 | Excellent 8.5% |
| Immigrants | Germany | 83.3 /100 | #143 | Excellent 8.5% |
| Albanians | 83.3 /100 | #144 | Excellent 8.5% |
| Immigrants | South Eastern Asia | 83.2 /100 | #145 | Excellent 8.5% |
Demographics Similar to Immigrants from Fiji by Family Poverty
In terms of family poverty, the demographic groups most similar to Immigrants from Fiji are Immigrants from Peru (8.9%, a difference of 0.15%), Lebanese (8.9%, a difference of 0.16%), Kenyan (8.9%, a difference of 0.25%), Immigrants from Chile (8.9%, a difference of 0.44%), and Israeli (8.9%, a difference of 0.79%).
| Demographics | Rating | Rank | Family Poverty |
| Afghans | 63.5 /100 | #166 | Good 8.8% |
| Immigrants | Ethiopia | 62.5 /100 | #167 | Good 8.9% |
| Israelis | 62.1 /100 | #168 | Good 8.9% |
| Immigrants | Chile | 59.6 /100 | #169 | Average 8.9% |
| Kenyans | 58.2 /100 | #170 | Average 8.9% |
| Lebanese | 57.6 /100 | #171 | Average 8.9% |
| Immigrants | Peru | 57.5 /100 | #172 | Average 8.9% |
| Immigrants | Fiji | 56.4 /100 | #173 | Average 8.9% |
| Immigrants | Albania | 50.0 /100 | #174 | Average 9.0% |
| Costa Ricans | 49.3 /100 | #175 | Average 9.0% |
| Immigrants | Syria | 47.5 /100 | #176 | Average 9.0% |
| Hawaiians | 47.2 /100 | #177 | Average 9.0% |
| Immigrants | Cameroon | 47.1 /100 | #178 | Average 9.0% |
| Immigrants | Iraq | 44.4 /100 | #179 | Average 9.1% |
| Immigrants | Uganda | 43.4 /100 | #180 | Average 9.1% |