Bahamian vs Immigrants from Canada Family Poverty
COMPARE
Bahamian
Immigrants from Canada
Family Poverty
Family Poverty Comparison
Bahamians
Immigrants from Canada
11.7%
FAMILY POVERTY
0.0/ 100
METRIC RATING
301st/ 347
METRIC RANK
7.8%
FAMILY POVERTY
98.2/ 100
METRIC RATING
70th/ 347
METRIC RANK
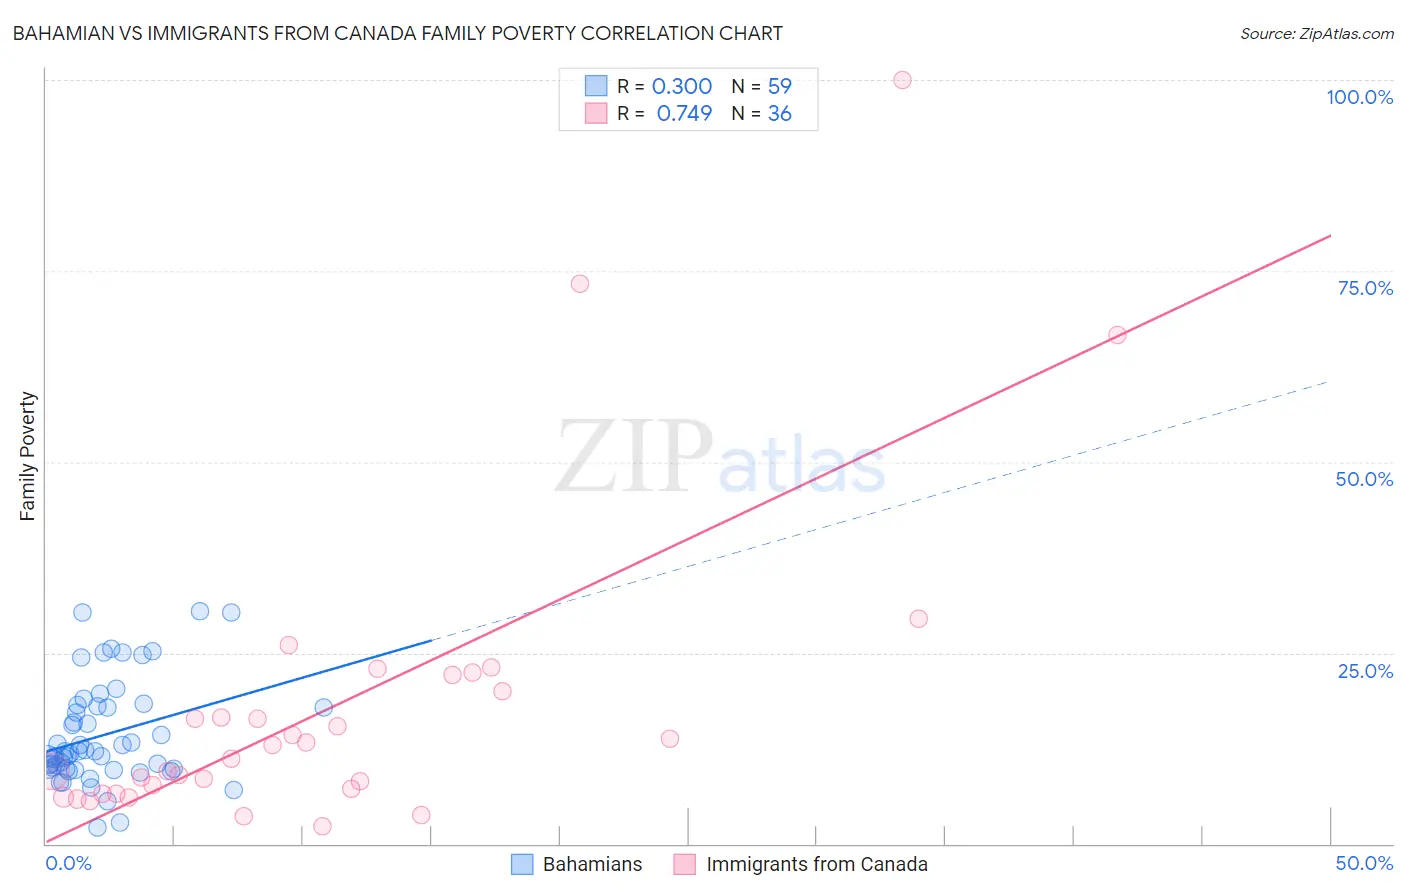
Bahamian vs Immigrants from Canada Family Poverty Correlation Chart
The statistical analysis conducted on geographies consisting of 112,580,407 people shows a weak positive correlation between the proportion of Bahamians and poverty level among families in the United States with a correlation coefficient (R) of 0.300 and weighted average of 11.7%. Similarly, the statistical analysis conducted on geographies consisting of 457,293,796 people shows a strong positive correlation between the proportion of Immigrants from Canada and poverty level among families in the United States with a correlation coefficient (R) of 0.749 and weighted average of 7.8%, a difference of 49.7%.
Family Poverty Correlation Summary
| Measurement | Bahamian | Immigrants from Canada |
| Minimum | 2.2% | 2.3% |
| Maximum | 30.4% | 100.0% |
| Range | 28.2% | 97.7% |
| Mean | 14.2% | 18.1% |
| Median | 12.1% | 12.1% |
| Interquartile 25% (IQ1) | 9.7% | 6.9% |
| Interquartile 75% (IQ3) | 18.1% | 21.0% |
| Interquartile Range (IQR) | 8.3% | 14.2% |
| Standard Deviation (Sample) | 6.6% | 20.6% |
| Standard Deviation (Population) | 6.6% | 20.3% |
Similar Demographics by Family Poverty
Demographics Similar to Bahamians by Family Poverty
In terms of family poverty, the demographic groups most similar to Bahamians are Guatemalan (11.7%, a difference of 0.040%), Immigrants from Bangladesh (11.7%, a difference of 0.25%), Dutch West Indian (11.7%, a difference of 0.27%), Immigrants from Senegal (11.7%, a difference of 0.36%), and Creek (11.7%, a difference of 0.50%).
| Demographics | Rating | Rank | Family Poverty |
| Immigrants | St. Vincent and the Grenadines | 0.0 /100 | #294 | Tragic 11.6% |
| Immigrants | Haiti | 0.0 /100 | #295 | Tragic 11.6% |
| Choctaw | 0.0 /100 | #296 | Tragic 11.6% |
| Creek | 0.0 /100 | #297 | Tragic 11.7% |
| Immigrants | Senegal | 0.0 /100 | #298 | Tragic 11.7% |
| Dutch West Indians | 0.0 /100 | #299 | Tragic 11.7% |
| Immigrants | Bangladesh | 0.0 /100 | #300 | Tragic 11.7% |
| Bahamians | 0.0 /100 | #301 | Tragic 11.7% |
| Guatemalans | 0.0 /100 | #302 | Tragic 11.7% |
| Africans | 0.0 /100 | #303 | Tragic 11.8% |
| Immigrants | Latin America | 0.0 /100 | #304 | Tragic 11.8% |
| Mexicans | 0.0 /100 | #305 | Tragic 11.8% |
| Cajuns | 0.0 /100 | #306 | Tragic 11.9% |
| Immigrants | Congo | 0.0 /100 | #307 | Tragic 11.9% |
| Seminole | 0.0 /100 | #308 | Tragic 11.9% |
Demographics Similar to Immigrants from Canada by Family Poverty
In terms of family poverty, the demographic groups most similar to Immigrants from Canada are Cambodian (7.8%, a difference of 0.020%), Immigrants from Belgium (7.8%, a difference of 0.040%), Australian (7.8%, a difference of 0.060%), Immigrants from Romania (7.8%, a difference of 0.080%), and Austrian (7.8%, a difference of 0.080%).
| Demographics | Rating | Rank | Family Poverty |
| Zimbabweans | 98.4 /100 | #63 | Exceptional 7.8% |
| Koreans | 98.3 /100 | #64 | Exceptional 7.8% |
| Immigrants | Bulgaria | 98.3 /100 | #65 | Exceptional 7.8% |
| Dutch | 98.3 /100 | #66 | Exceptional 7.8% |
| Northern Europeans | 98.3 /100 | #67 | Exceptional 7.8% |
| Australians | 98.2 /100 | #68 | Exceptional 7.8% |
| Immigrants | Belgium | 98.2 /100 | #69 | Exceptional 7.8% |
| Immigrants | Canada | 98.2 /100 | #70 | Exceptional 7.8% |
| Cambodians | 98.2 /100 | #71 | Exceptional 7.8% |
| Immigrants | Romania | 98.2 /100 | #72 | Exceptional 7.8% |
| Austrians | 98.2 /100 | #73 | Exceptional 7.8% |
| Immigrants | China | 98.1 /100 | #74 | Exceptional 7.8% |
| Immigrants | Croatia | 98.1 /100 | #75 | Exceptional 7.8% |
| Immigrants | Latvia | 98.0 /100 | #76 | Exceptional 7.9% |
| Ukrainians | 98.0 /100 | #77 | Exceptional 7.9% |