Bahamian vs Inupiat Family Poverty
COMPARE
Bahamian
Inupiat
Family Poverty
Family Poverty Comparison
Bahamians
Inupiat
11.7%
FAMILY POVERTY
0.0/ 100
METRIC RATING
301st/ 347
METRIC RANK
12.5%
FAMILY POVERTY
0.0/ 100
METRIC RATING
320th/ 347
METRIC RANK
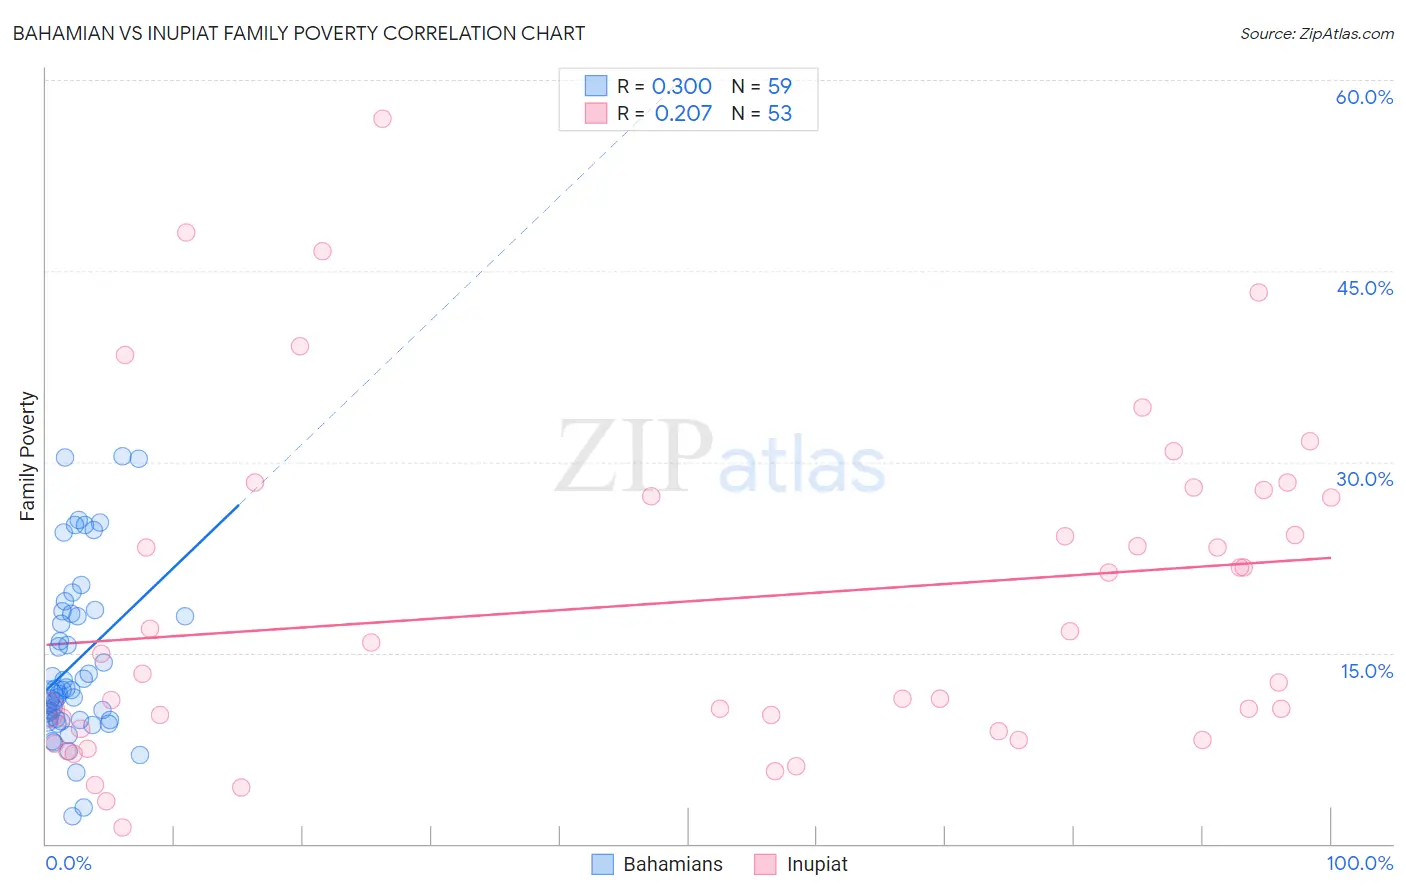
Bahamian vs Inupiat Family Poverty Correlation Chart
The statistical analysis conducted on geographies consisting of 112,580,407 people shows a weak positive correlation between the proportion of Bahamians and poverty level among families in the United States with a correlation coefficient (R) of 0.300 and weighted average of 11.7%. Similarly, the statistical analysis conducted on geographies consisting of 96,272,852 people shows a weak positive correlation between the proportion of Inupiat and poverty level among families in the United States with a correlation coefficient (R) of 0.207 and weighted average of 12.5%, a difference of 6.4%.
Family Poverty Correlation Summary
| Measurement | Bahamian | Inupiat |
| Minimum | 2.2% | 1.3% |
| Maximum | 30.4% | 56.9% |
| Range | 28.2% | 55.6% |
| Mean | 14.2% | 19.0% |
| Median | 12.1% | 14.9% |
| Interquartile 25% (IQ1) | 9.7% | 8.9% |
| Interquartile 75% (IQ3) | 18.1% | 27.5% |
| Interquartile Range (IQR) | 8.3% | 18.6% |
| Standard Deviation (Sample) | 6.6% | 12.9% |
| Standard Deviation (Population) | 6.6% | 12.8% |
Demographics Similar to Bahamians and Inupiat by Family Poverty
In terms of family poverty, the demographic groups most similar to Bahamians are Guatemalan (11.7%, a difference of 0.040%), Immigrants from Bangladesh (11.7%, a difference of 0.25%), African (11.8%, a difference of 0.54%), Immigrants from Latin America (11.8%, a difference of 0.73%), and Mexican (11.8%, a difference of 0.92%). Similarly, the demographic groups most similar to Inupiat are British West Indian (12.4%, a difference of 0.48%), U.S. Virgin Islander (12.4%, a difference of 0.53%), Immigrants from Grenada (12.4%, a difference of 0.54%), Honduran (12.4%, a difference of 0.76%), and Immigrants from Mexico (12.3%, a difference of 1.5%).
| Demographics | Rating | Rank | Family Poverty |
| Immigrants | Bangladesh | 0.0 /100 | #300 | Tragic 11.7% |
| Bahamians | 0.0 /100 | #301 | Tragic 11.7% |
| Guatemalans | 0.0 /100 | #302 | Tragic 11.7% |
| Africans | 0.0 /100 | #303 | Tragic 11.8% |
| Immigrants | Latin America | 0.0 /100 | #304 | Tragic 11.8% |
| Mexicans | 0.0 /100 | #305 | Tragic 11.8% |
| Cajuns | 0.0 /100 | #306 | Tragic 11.9% |
| Immigrants | Congo | 0.0 /100 | #307 | Tragic 11.9% |
| Seminole | 0.0 /100 | #308 | Tragic 11.9% |
| Hispanics or Latinos | 0.0 /100 | #309 | Tragic 12.0% |
| Immigrants | Guatemala | 0.0 /100 | #310 | Tragic 12.0% |
| Ute | 0.0 /100 | #311 | Tragic 12.1% |
| Immigrants | Central America | 0.0 /100 | #312 | Tragic 12.1% |
| Immigrants | Caribbean | 0.0 /100 | #313 | Tragic 12.2% |
| Kiowa | 0.0 /100 | #314 | Tragic 12.2% |
| Immigrants | Mexico | 0.0 /100 | #315 | Tragic 12.3% |
| Hondurans | 0.0 /100 | #316 | Tragic 12.4% |
| Immigrants | Grenada | 0.0 /100 | #317 | Tragic 12.4% |
| U.S. Virgin Islanders | 0.0 /100 | #318 | Tragic 12.4% |
| British West Indians | 0.0 /100 | #319 | Tragic 12.4% |
| Inupiat | 0.0 /100 | #320 | Tragic 12.5% |