Immigrants from Peru vs Immigrants from Fiji Family Poverty
COMPARE
Immigrants from Peru
Immigrants from Fiji
Family Poverty
Family Poverty Comparison
Immigrants from Peru
Immigrants from Fiji
8.9%
FAMILY POVERTY
57.5/ 100
METRIC RATING
172nd/ 347
METRIC RANK
8.9%
FAMILY POVERTY
56.4/ 100
METRIC RATING
173rd/ 347
METRIC RANK
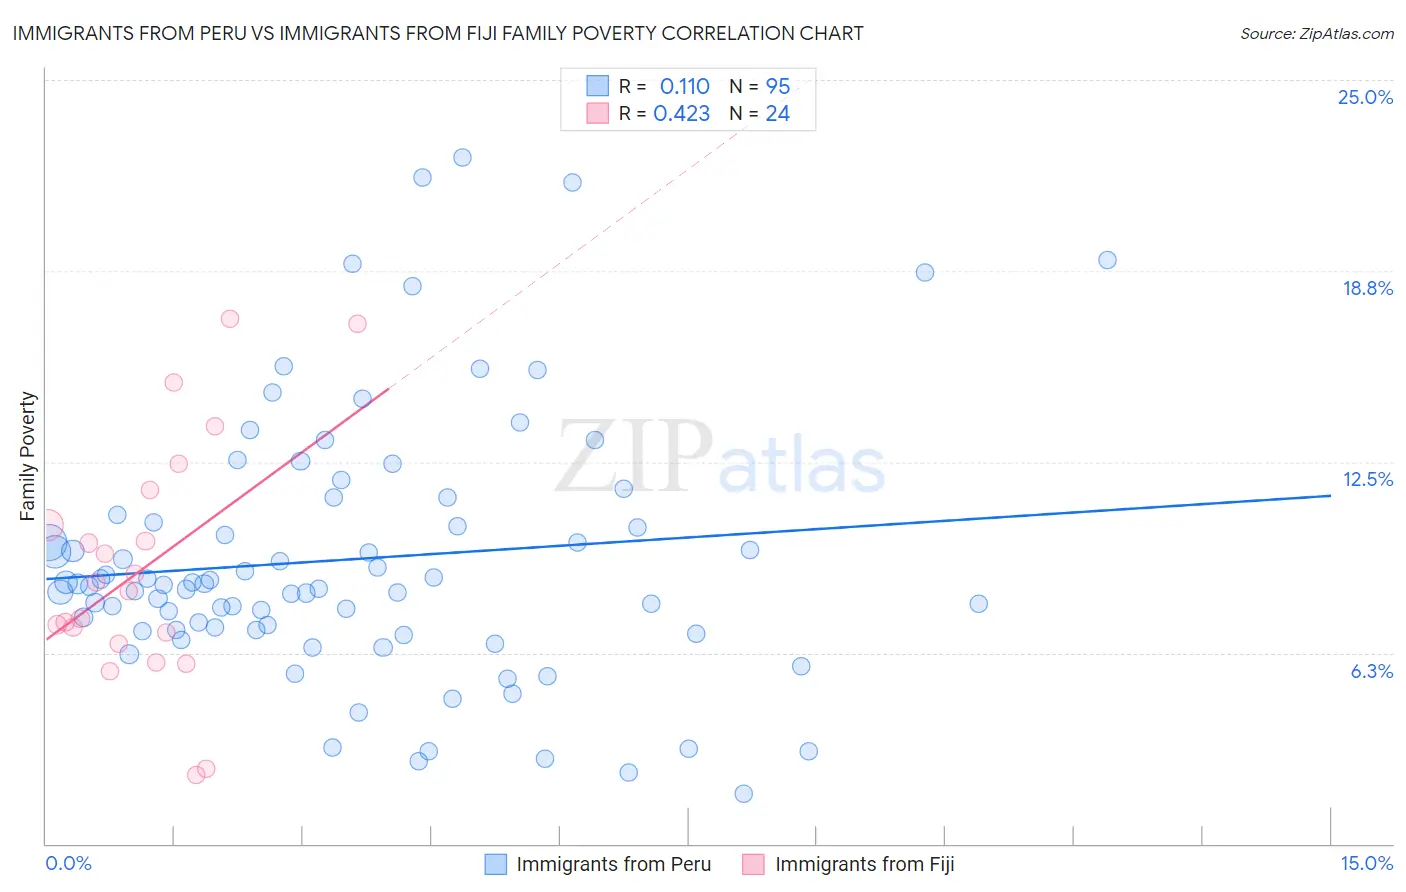
Immigrants from Peru vs Immigrants from Fiji Family Poverty Correlation Chart
The statistical analysis conducted on geographies consisting of 328,434,488 people shows a poor positive correlation between the proportion of Immigrants from Peru and poverty level among families in the United States with a correlation coefficient (R) of 0.110 and weighted average of 8.9%. Similarly, the statistical analysis conducted on geographies consisting of 93,742,503 people shows a moderate positive correlation between the proportion of Immigrants from Fiji and poverty level among families in the United States with a correlation coefficient (R) of 0.423 and weighted average of 8.9%, a difference of 0.15%.
Family Poverty Correlation Summary
| Measurement | Immigrants from Peru | Immigrants from Fiji |
| Minimum | 1.6% | 2.3% |
| Maximum | 22.5% | 17.2% |
| Range | 20.8% | 14.9% |
| Mean | 9.3% | 9.0% |
| Median | 8.5% | 8.4% |
| Interquartile 25% (IQ1) | 7.0% | 6.7% |
| Interquartile 75% (IQ3) | 10.8% | 11.0% |
| Interquartile Range (IQR) | 3.8% | 4.3% |
| Standard Deviation (Sample) | 4.3% | 3.9% |
| Standard Deviation (Population) | 4.3% | 3.8% |
Demographics Similar to Immigrants from Peru and Immigrants from Fiji by Family Poverty
In terms of family poverty, the demographic groups most similar to Immigrants from Peru are Lebanese (8.9%, a difference of 0.010%), Kenyan (8.9%, a difference of 0.090%), Immigrants from Chile (8.9%, a difference of 0.29%), Israeli (8.9%, a difference of 0.63%), and Immigrants from Ethiopia (8.9%, a difference of 0.69%). Similarly, the demographic groups most similar to Immigrants from Fiji are Lebanese (8.9%, a difference of 0.16%), Kenyan (8.9%, a difference of 0.25%), Immigrants from Chile (8.9%, a difference of 0.44%), Israeli (8.9%, a difference of 0.79%), and Immigrants from Ethiopia (8.9%, a difference of 0.85%).
| Demographics | Rating | Rank | Family Poverty |
| Ethiopians | 66.3 /100 | #162 | Good 8.8% |
| Pennsylvania Germans | 66.0 /100 | #163 | Good 8.8% |
| Celtics | 64.9 /100 | #164 | Good 8.8% |
| Guamanians/Chamorros | 64.7 /100 | #165 | Good 8.8% |
| Afghans | 63.5 /100 | #166 | Good 8.8% |
| Immigrants | Ethiopia | 62.5 /100 | #167 | Good 8.9% |
| Israelis | 62.1 /100 | #168 | Good 8.9% |
| Immigrants | Chile | 59.6 /100 | #169 | Average 8.9% |
| Kenyans | 58.2 /100 | #170 | Average 8.9% |
| Lebanese | 57.6 /100 | #171 | Average 8.9% |
| Immigrants | Peru | 57.5 /100 | #172 | Average 8.9% |
| Immigrants | Fiji | 56.4 /100 | #173 | Average 8.9% |
| Immigrants | Albania | 50.0 /100 | #174 | Average 9.0% |
| Costa Ricans | 49.3 /100 | #175 | Average 9.0% |
| Immigrants | Syria | 47.5 /100 | #176 | Average 9.0% |
| Hawaiians | 47.2 /100 | #177 | Average 9.0% |
| Immigrants | Cameroon | 47.1 /100 | #178 | Average 9.0% |
| Immigrants | Iraq | 44.4 /100 | #179 | Average 9.1% |
| Immigrants | Uganda | 43.4 /100 | #180 | Average 9.1% |
| Hmong | 40.2 /100 | #181 | Average 9.1% |
| Immigrants | Morocco | 40.2 /100 | #182 | Average 9.1% |