Arab vs Chickasaw Family Poverty
COMPARE
Arab
Chickasaw
Family Poverty
Family Poverty Comparison
Arabs
Chickasaw
9.2%
FAMILY POVERTY
31.5/ 100
METRIC RATING
190th/ 347
METRIC RANK
10.8%
FAMILY POVERTY
0.2/ 100
METRIC RATING
256th/ 347
METRIC RANK
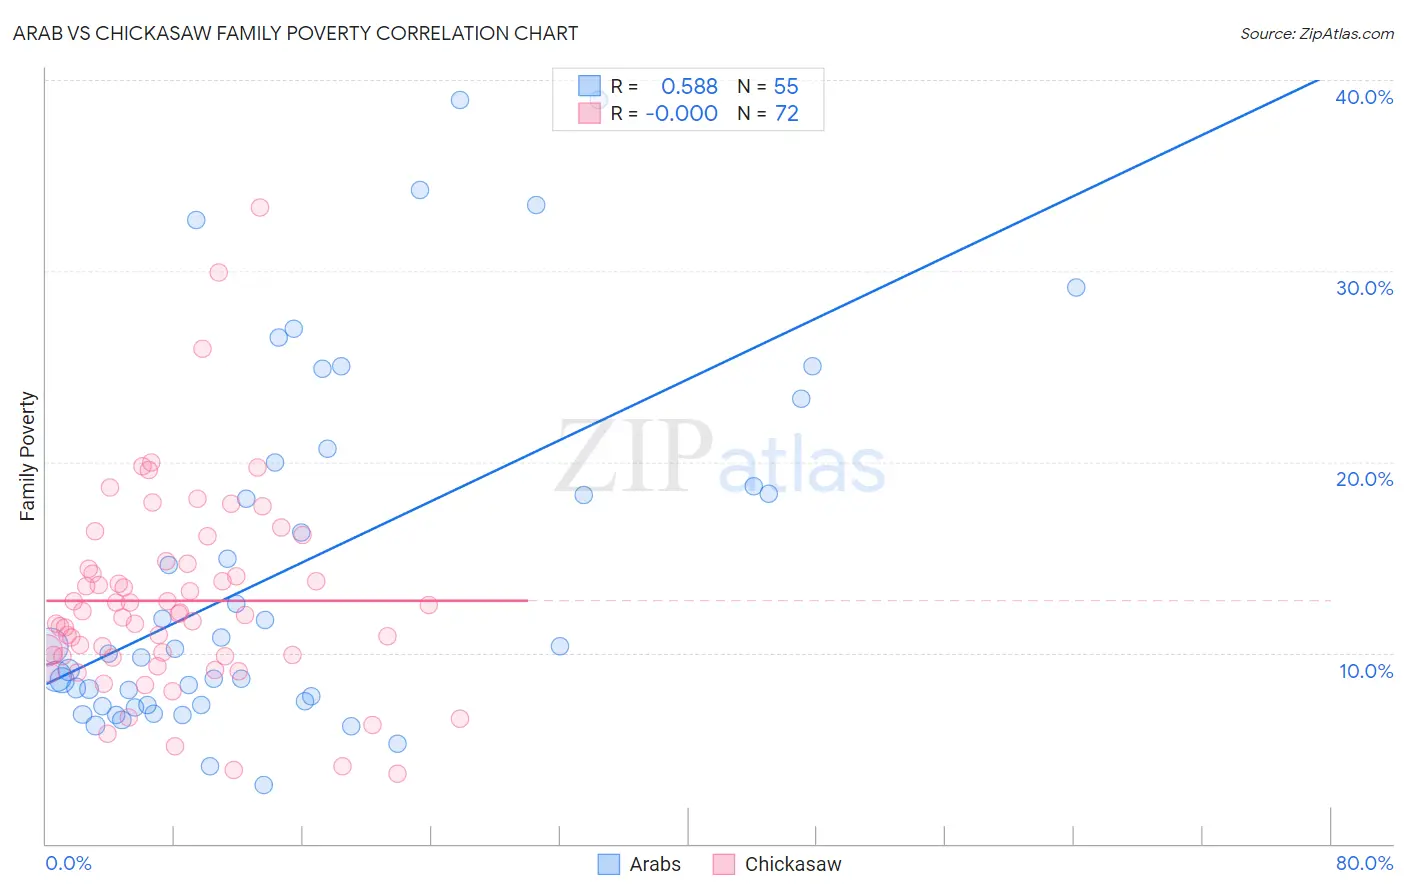
Arab vs Chickasaw Family Poverty Correlation Chart
The statistical analysis conducted on geographies consisting of 484,664,597 people shows a substantial positive correlation between the proportion of Arabs and poverty level among families in the United States with a correlation coefficient (R) of 0.588 and weighted average of 9.2%. Similarly, the statistical analysis conducted on geographies consisting of 147,601,652 people shows no correlation between the proportion of Chickasaw and poverty level among families in the United States with a correlation coefficient (R) of -0.000 and weighted average of 10.8%, a difference of 17.4%.
Family Poverty Correlation Summary
| Measurement | Arab | Chickasaw |
| Minimum | 3.1% | 3.7% |
| Maximum | 39.0% | 33.3% |
| Range | 35.9% | 29.7% |
| Mean | 14.5% | 12.7% |
| Median | 10.2% | 12.0% |
| Interquartile 25% (IQ1) | 7.3% | 9.8% |
| Interquartile 75% (IQ3) | 19.9% | 14.5% |
| Interquartile Range (IQR) | 12.6% | 4.7% |
| Standard Deviation (Sample) | 9.5% | 5.3% |
| Standard Deviation (Population) | 9.4% | 5.2% |
Similar Demographics by Family Poverty
Demographics Similar to Arabs by Family Poverty
In terms of family poverty, the demographic groups most similar to Arabs are Immigrants from Afghanistan (9.2%, a difference of 0.090%), Immigrants from Kenya (9.2%, a difference of 0.37%), Ugandan (9.3%, a difference of 0.41%), Spanish (9.3%, a difference of 0.42%), and Immigrants from Western Asia (9.3%, a difference of 0.50%).
| Demographics | Rating | Rank | Family Poverty |
| Uruguayans | 39.2 /100 | #183 | Fair 9.1% |
| South American Indians | 38.7 /100 | #184 | Fair 9.1% |
| Immigrants | Saudi Arabia | 38.6 /100 | #185 | Fair 9.1% |
| Colombians | 36.1 /100 | #186 | Fair 9.2% |
| Delaware | 35.4 /100 | #187 | Fair 9.2% |
| Immigrants | Kenya | 34.0 /100 | #188 | Fair 9.2% |
| Immigrants | Afghanistan | 32.1 /100 | #189 | Fair 9.2% |
| Arabs | 31.5 /100 | #190 | Fair 9.2% |
| Ugandans | 28.7 /100 | #191 | Fair 9.3% |
| Spanish | 28.7 /100 | #192 | Fair 9.3% |
| Immigrants | Western Asia | 28.2 /100 | #193 | Fair 9.3% |
| South Americans | 28.1 /100 | #194 | Fair 9.3% |
| Venezuelans | 27.4 /100 | #195 | Fair 9.3% |
| Immigrants | Venezuela | 26.1 /100 | #196 | Fair 9.3% |
| Immigrants | Colombia | 24.4 /100 | #197 | Fair 9.3% |
Demographics Similar to Chickasaw by Family Poverty
In terms of family poverty, the demographic groups most similar to Chickasaw are Immigrants from Ghana (10.8%, a difference of 0.040%), Subsaharan African (10.9%, a difference of 0.070%), Mexican American Indian (10.9%, a difference of 0.11%), Immigrants from Liberia (10.8%, a difference of 0.26%), and Bangladeshi (10.9%, a difference of 0.46%).
| Demographics | Rating | Rank | Family Poverty |
| Cubans | 0.4 /100 | #249 | Tragic 10.6% |
| Salvadorans | 0.3 /100 | #250 | Tragic 10.7% |
| Iroquois | 0.3 /100 | #251 | Tragic 10.7% |
| Immigrants | Zaire | 0.3 /100 | #252 | Tragic 10.7% |
| Immigrants | Western Africa | 0.3 /100 | #253 | Tragic 10.7% |
| Ecuadorians | 0.2 /100 | #254 | Tragic 10.8% |
| Immigrants | Liberia | 0.2 /100 | #255 | Tragic 10.8% |
| Chickasaw | 0.2 /100 | #256 | Tragic 10.8% |
| Immigrants | Ghana | 0.2 /100 | #257 | Tragic 10.8% |
| Sub-Saharan Africans | 0.2 /100 | #258 | Tragic 10.9% |
| Mexican American Indians | 0.2 /100 | #259 | Tragic 10.9% |
| Bangladeshis | 0.2 /100 | #260 | Tragic 10.9% |
| Shoshone | 0.2 /100 | #261 | Tragic 10.9% |
| Spanish American Indians | 0.2 /100 | #262 | Tragic 10.9% |
| Cape Verdeans | 0.1 /100 | #263 | Tragic 10.9% |