Zip Codes with the Highest Percentage of Households Heated by Bottled Gas / Liquid Propane in Pottstown, PA
RELATED REPORTS & OPTIONS
Bottled Gas / LP Heating
Pottstown
Compare Zip Codes
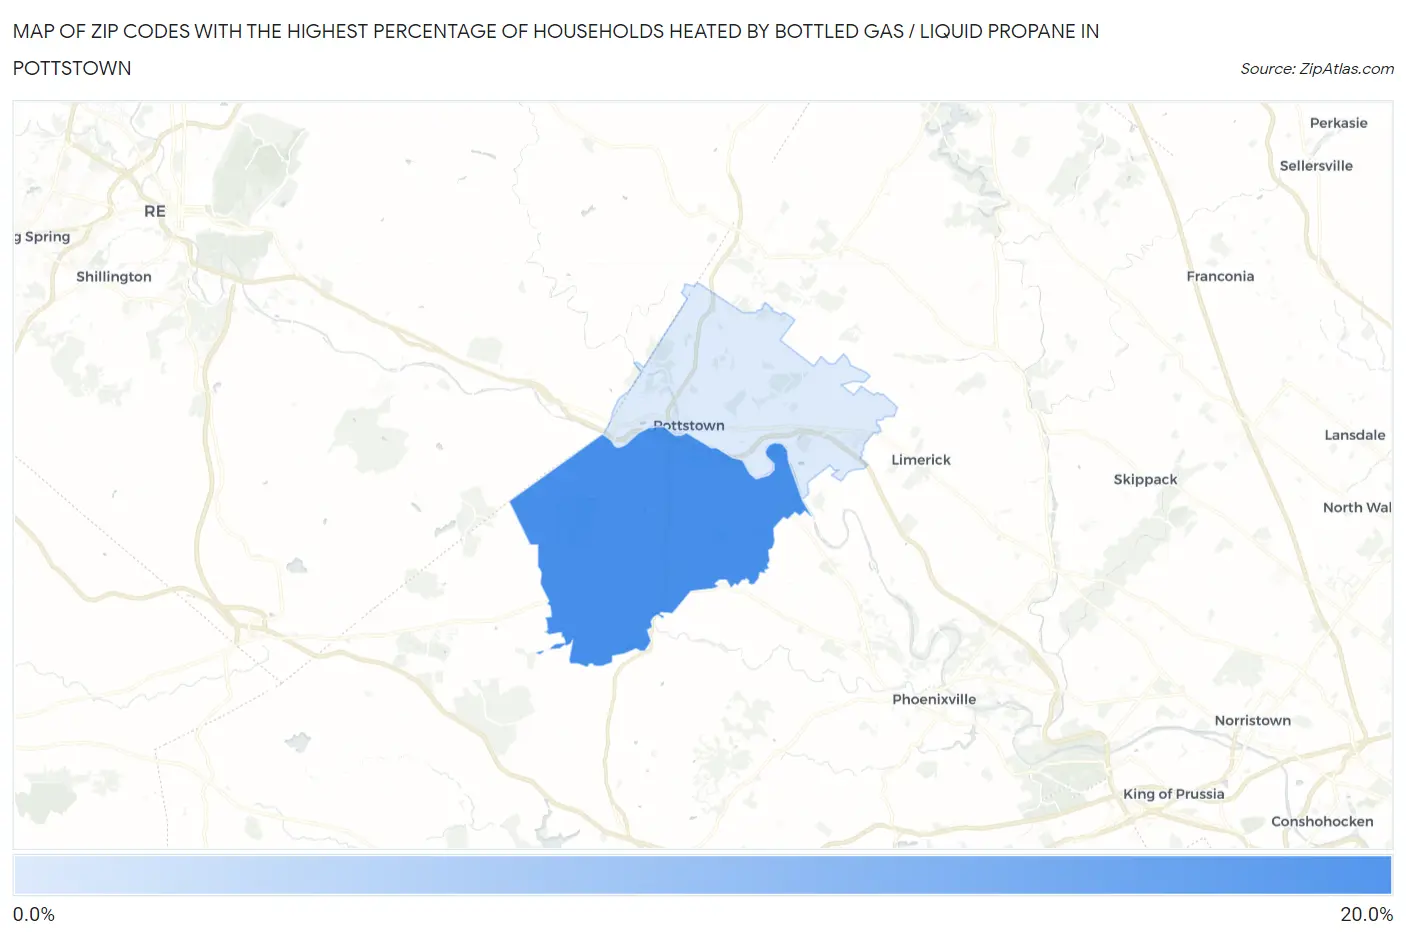
Map of Zip Codes with the Highest Percentage of Households Heated by Bottled Gas / Liquid Propane in Pottstown
3.1%
15.6%
Zip Codes with the Highest Percentage of Households Heated by Bottled Gas / Liquid Propane in Pottstown, PA
| Zip Code | Bottled Gas / LP Heating | vs State | vs National | |
| 1. | 19465 | 15.6% | 4.8%(+10.8)#231 | 4.9%(+10.7)#10,973 |
| 2. | 19464 | 3.1% | 4.8%(-1.70)#988 | 4.9%(-1.80)#20,812 |
1
Common Questions
What are the Top Zip Codes with the Highest Percentage of Households Heated by Bottled Gas / Liquid Propane in Pottstown, PA?
Top Zip Codes with the Highest Percentage of Households Heated by Bottled Gas / Liquid Propane in Pottstown, PA are:
What zip code has the Highest Percentage of Households Heated by Bottled Gas / Liquid Propane in Pottstown, PA?
19465 has the Highest Percentage of Households Heated by Bottled Gas / Liquid Propane in Pottstown, PA with 15.6%.
What is the Percentage of Households Heated by Bottled Gas / Liquid Propane in Pennsylvania?
Percentage of Households Heated by Bottled Gas / Liquid Propane in Pennsylvania is 4.8%.
What is the Percentage of Households Heated by Bottled Gas / Liquid Propane in the United States?
Percentage of Households Heated by Bottled Gas / Liquid Propane in the United States is 4.9%.