Zip Codes with the Highest Percentage of Population Employed in Transportation & Warehousing in Bethlehem, PA
RELATED REPORTS & OPTIONS
Transportation & Warehousing
Bethlehem
Compare Zip Codes
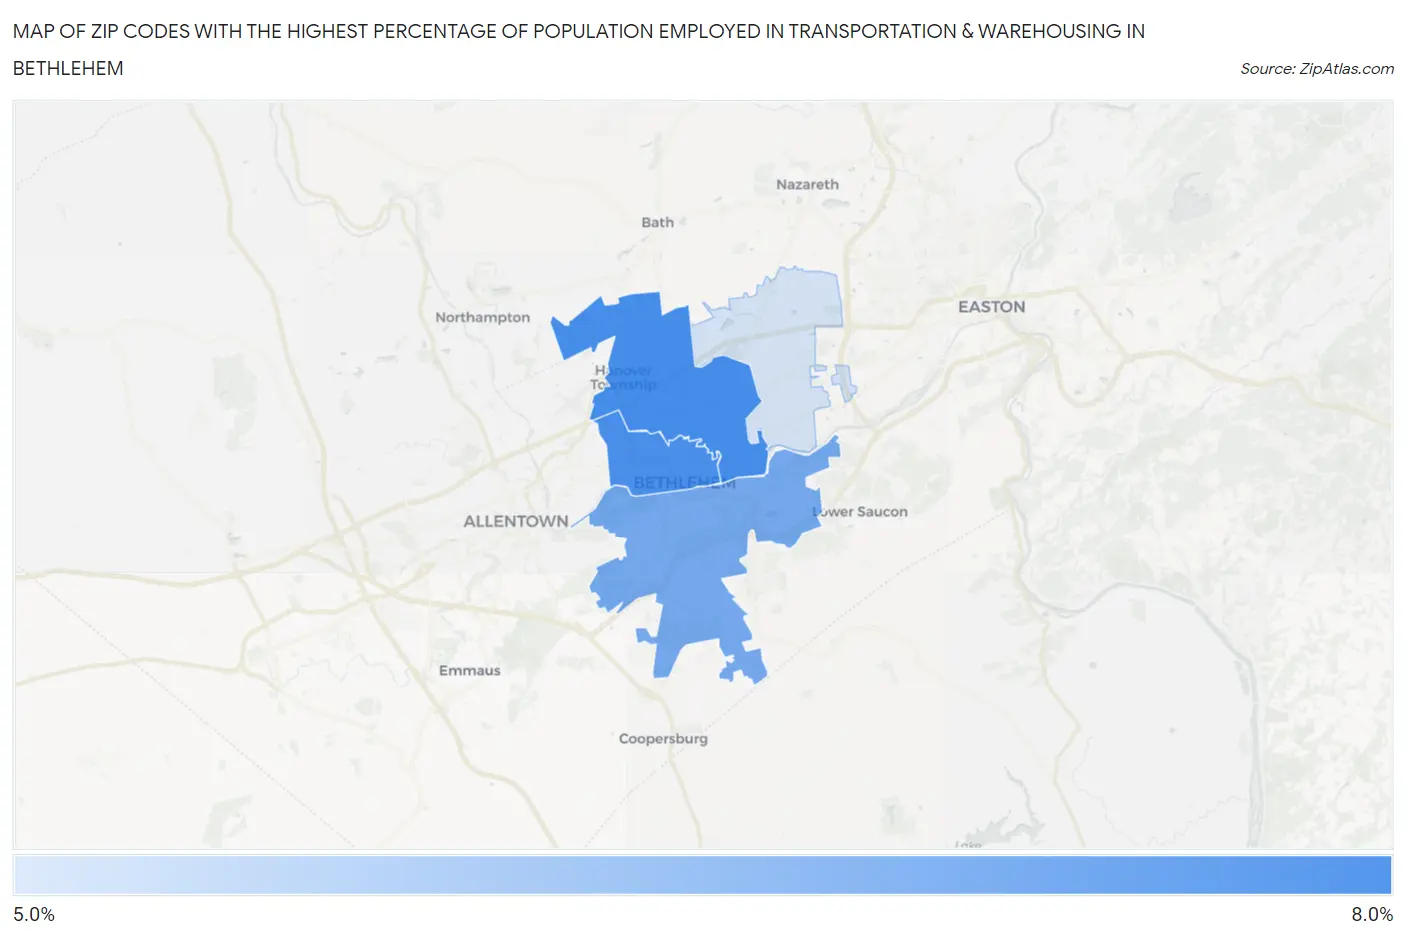
Map of Zip Codes with the Highest Percentage of Population Employed in Transportation & Warehousing in Bethlehem
0.0%
8.0%
Zip Codes with the Highest Percentage of Population Employed in Transportation & Warehousing in Bethlehem, PA
| Zip Code | % Employed | vs State | vs National | |
| 1. | 18017 | 6.6% | 5.0%(+1.62)#503 | 4.9%(+1.66)#7,354 |
| 2. | 18018 | 6.6% | 5.0%(+1.57)#516 | 4.9%(+1.61)#7,450 |
| 3. | 18015 | 6.2% | 5.0%(+1.19)#574 | 4.9%(+1.23)#8,345 |
| 4. | 18020 | 5.3% | 5.0%(+0.290)#745 | 4.9%(+0.335)#10,965 |
1
Common Questions
What are the Top 3 Zip Codes with the Highest Percentage of Population Employed in Transportation & Warehousing in Bethlehem, PA?
Top 3 Zip Codes with the Highest Percentage of Population Employed in Transportation & Warehousing in Bethlehem, PA are:
What zip code has the Highest Percentage of Population Employed in Transportation & Warehousing in Bethlehem, PA?
18017 has the Highest Percentage of Population Employed in Transportation & Warehousing in Bethlehem, PA with 6.6%.
What is the Percentage of Population Employed in Transportation & Warehousing in Bethlehem, PA?
Percentage of Population Employed in Transportation & Warehousing in Bethlehem is 6.8%.
What is the Percentage of Population Employed in Transportation & Warehousing in Pennsylvania?
Percentage of Population Employed in Transportation & Warehousing in Pennsylvania is 5.0%.
What is the Percentage of Population Employed in Transportation & Warehousing in the United States?
Percentage of Population Employed in Transportation & Warehousing in the United States is 4.9%.