Zip Codes with the Highest Percentage of Households Without a Vehicle in Youngstown, OH
RELATED REPORTS & OPTIONS
Households without a Cars
Youngstown
Compare Zip Codes
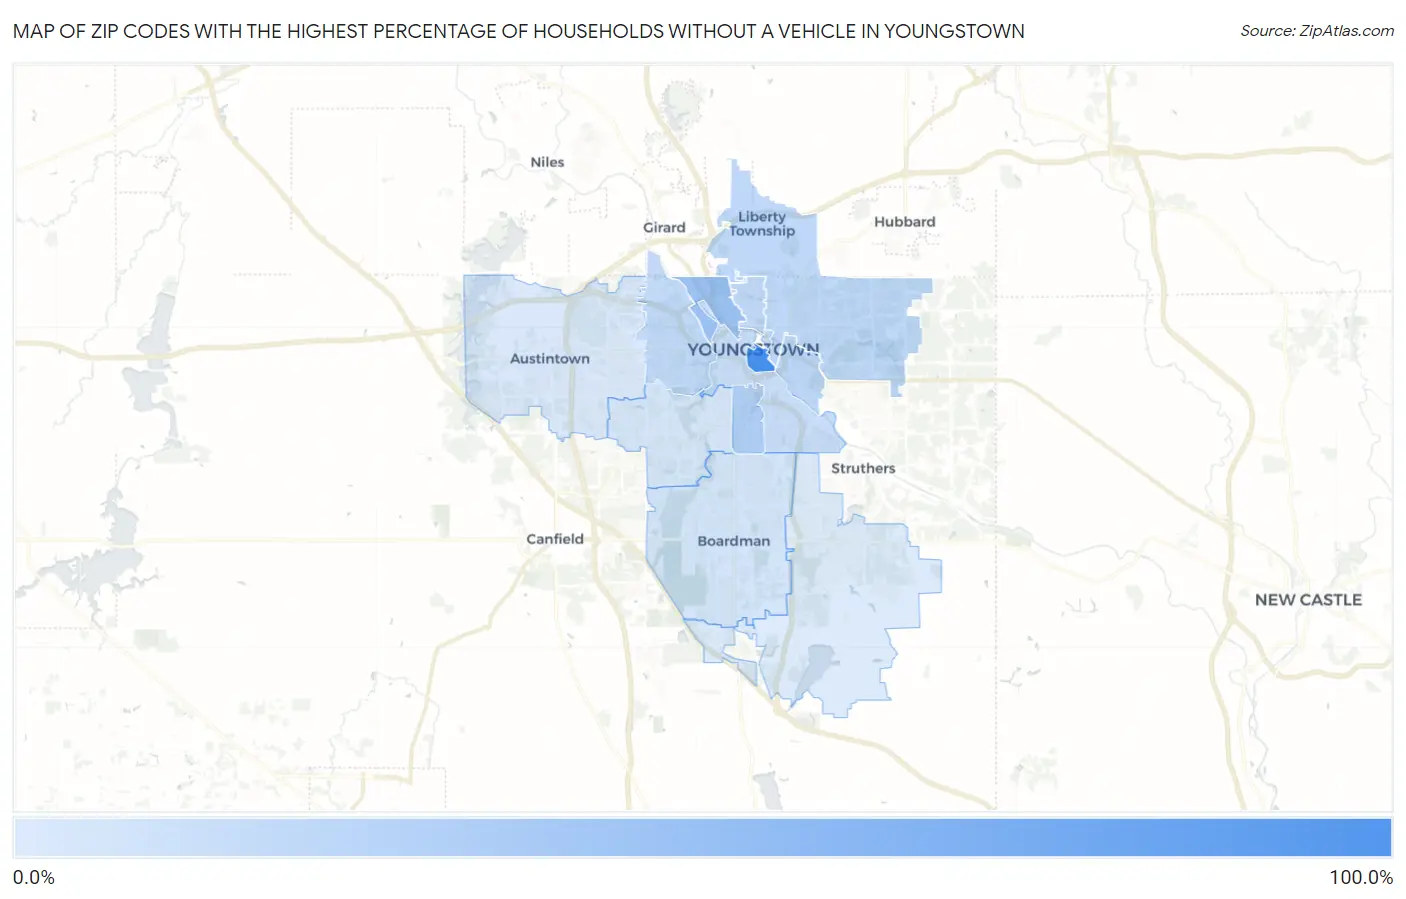
Map of Zip Codes with the Highest Percentage of Households Without a Vehicle in Youngstown
3.7%
83.4%
Zip Codes with the Highest Percentage of Households Without a Vehicle in Youngstown, OH
| Zip Code | Housholds Without a Car | vs State | vs National | |
| 1. | 44503 | 83.4% | 7.4%(+76.0)#1 | 8.3%(+75.1)#114 |
| 2. | 44510 | 32.3% | 7.4%(+24.9)#29 | 8.3%(+24.0)#719 |
| 3. | 44507 | 23.4% | 7.4%(+16.0)#53 | 8.3%(+15.1)#1,185 |
| 4. | 44506 | 16.9% | 7.4%(+9.50)#91 | 8.3%(+8.60)#1,983 |
| 5. | 44505 | 16.2% | 7.4%(+8.80)#98 | 8.3%(+7.90)#2,108 |
| 6. | 44509 | 15.6% | 7.4%(+8.20)#108 | 8.3%(+7.30)#2,236 |
| 7. | 44504 | 15.4% | 7.4%(+8.00)#110 | 8.3%(+7.10)#2,280 |
| 8. | 44502 | 12.6% | 7.4%(+5.20)#158 | 8.3%(+4.30)#3,287 |
| 9. | 44512 | 7.0% | 7.4%(-0.400)#348 | 8.3%(-1.30)#8,543 |
| 10. | 44511 | 6.2% | 7.4%(-1.20)#401 | 8.3%(-2.10)#10,030 |
| 11. | 44515 | 4.7% | 7.4%(-2.70)#533 | 8.3%(-3.60)#13,665 |
| 12. | 44514 | 3.7% | 7.4%(-3.70)#665 | 8.3%(-4.60)#16,690 |
1
Common Questions
What are the Top 10 Zip Codes with the Highest Percentage of Households Without a Vehicle in Youngstown, OH?
Top 10 Zip Codes with the Highest Percentage of Households Without a Vehicle in Youngstown, OH are:
What zip code has the Highest Percentage of Households Without a Vehicle in Youngstown, OH?
44503 has the Highest Percentage of Households Without a Vehicle in Youngstown, OH with 83.4%.
What is the Percentage of Households Without a Vehicle in Youngstown, OH?
Percentage of Households Without a Vehicle in Youngstown is 17.0%.
What is the Percentage of Households Without a Vehicle in Ohio?
Percentage of Households Without a Vehicle in Ohio is 7.4%.
What is the Percentage of Households Without a Vehicle in the United States?
Percentage of Households Without a Vehicle in the United States is 8.3%.