Zip Codes with the Highest Percentage of Population Employed in Administrative & Support Services in Youngstown, OH
RELATED REPORTS & OPTIONS
Administrative & Support Services
Youngstown
Compare Zip Codes
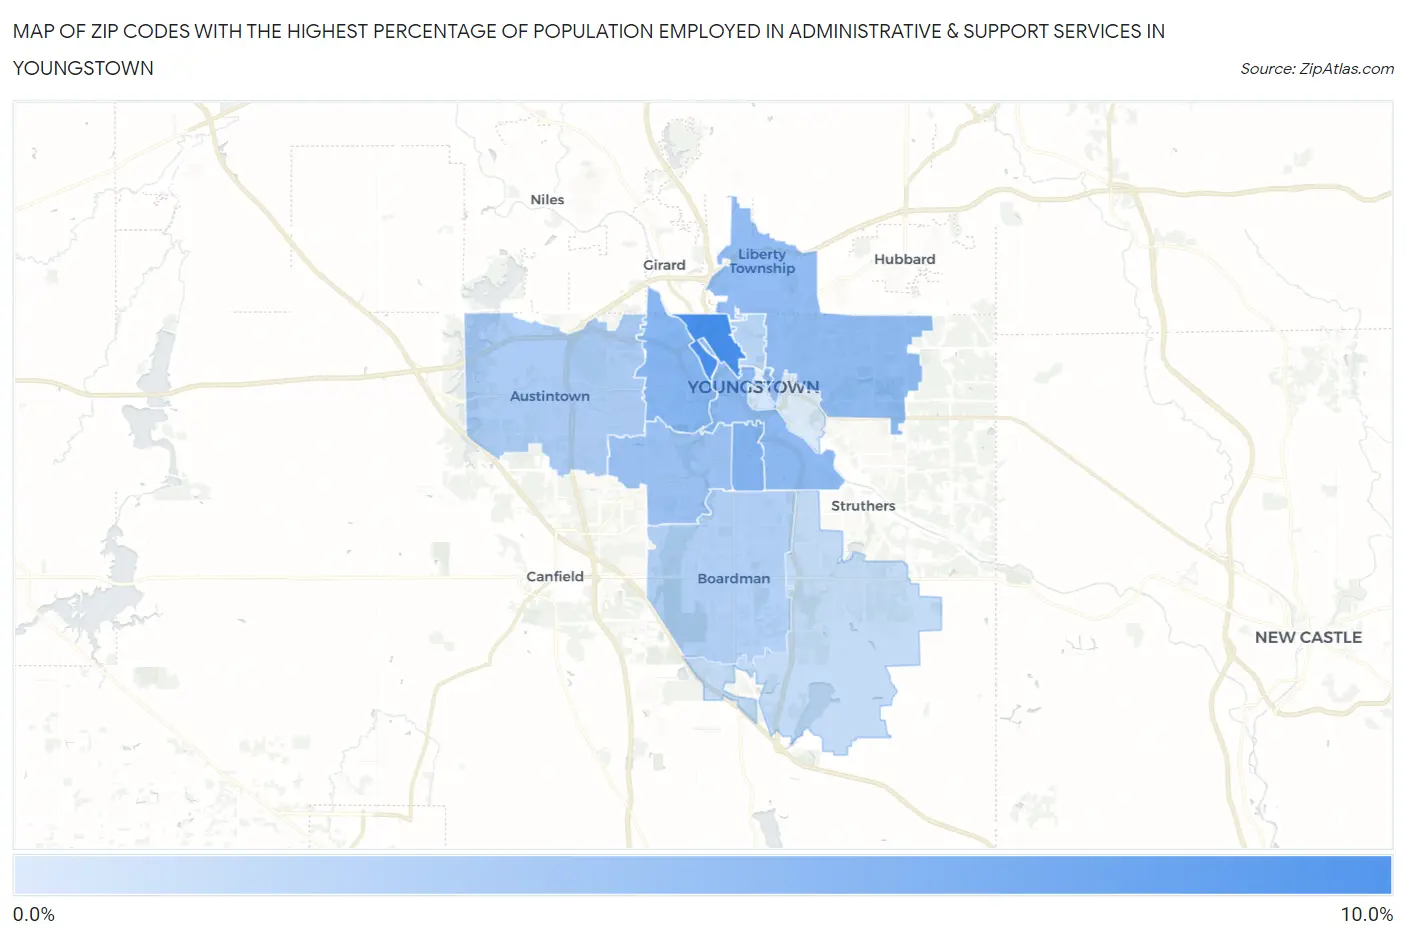
Map of Zip Codes with the Highest Percentage of Population Employed in Administrative & Support Services in Youngstown
1.8%
9.4%
Zip Codes with the Highest Percentage of Population Employed in Administrative & Support Services in Youngstown, OH
| Zip Code | % Employed | vs State | vs National | |
| 1. | 44510 | 9.4% | 3.7%(+5.72)#53 | 4.1%(+5.29)#1,494 |
| 2. | 44507 | 6.3% | 3.7%(+2.54)#162 | 4.1%(+2.11)#4,305 |
| 3. | 44509 | 6.1% | 3.7%(+2.34)#175 | 4.1%(+1.92)#4,653 |
| 4. | 44502 | 5.7% | 3.7%(+2.02)#202 | 4.1%(+1.60)#5,259 |
| 5. | 44505 | 5.6% | 3.7%(+1.84)#223 | 4.1%(+1.41)#5,677 |
| 6. | 44511 | 5.0% | 3.7%(+1.29)#271 | 4.1%(+0.866)#7,061 |
| 7. | 44515 | 4.1% | 3.7%(+0.401)#393 | 4.1%(-0.024)#10,136 |
| 8. | 44512 | 3.8% | 3.7%(+0.059)#441 | 4.1%(-0.367)#11,626 |
| 9. | 44504 | 3.5% | 3.7%(-0.195)#484 | 4.1%(-0.620)#12,806 |
| 10. | 44514 | 2.9% | 3.7%(-0.798)#614 | 4.1%(-1.22)#15,860 |
| 11. | 44503 | 2.2% | 3.7%(-1.53)#781 | 4.1%(-1.96)#19,707 |
| 12. | 44506 | 1.8% | 3.7%(-1.97)#875 | 4.1%(-2.40)#21,729 |
1
Common Questions
What are the Top 10 Zip Codes with the Highest Percentage of Population Employed in Administrative & Support Services in Youngstown, OH?
Top 10 Zip Codes with the Highest Percentage of Population Employed in Administrative & Support Services in Youngstown, OH are:
What zip code has the Highest Percentage of Population Employed in Administrative & Support Services in Youngstown, OH?
44510 has the Highest Percentage of Population Employed in Administrative & Support Services in Youngstown, OH with 9.4%.
What is the Percentage of Population Employed in Administrative & Support Services in Youngstown, OH?
Percentage of Population Employed in Administrative & Support Services in Youngstown is 5.5%.
What is the Percentage of Population Employed in Administrative & Support Services in Ohio?
Percentage of Population Employed in Administrative & Support Services in Ohio is 3.7%.
What is the Percentage of Population Employed in Administrative & Support Services in the United States?
Percentage of Population Employed in Administrative & Support Services in the United States is 4.1%.