Zip Codes with the Highest Percentage of Population Employed in Real Estate, Rental & Leasing in Youngstown, OH
RELATED REPORTS & OPTIONS
Real Estate, Rental & Leasing
Youngstown
Compare Zip Codes
Map of Zip Codes with the Highest Percentage of Population Employed in Real Estate, Rental & Leasing in Youngstown
0.0%
50.0%
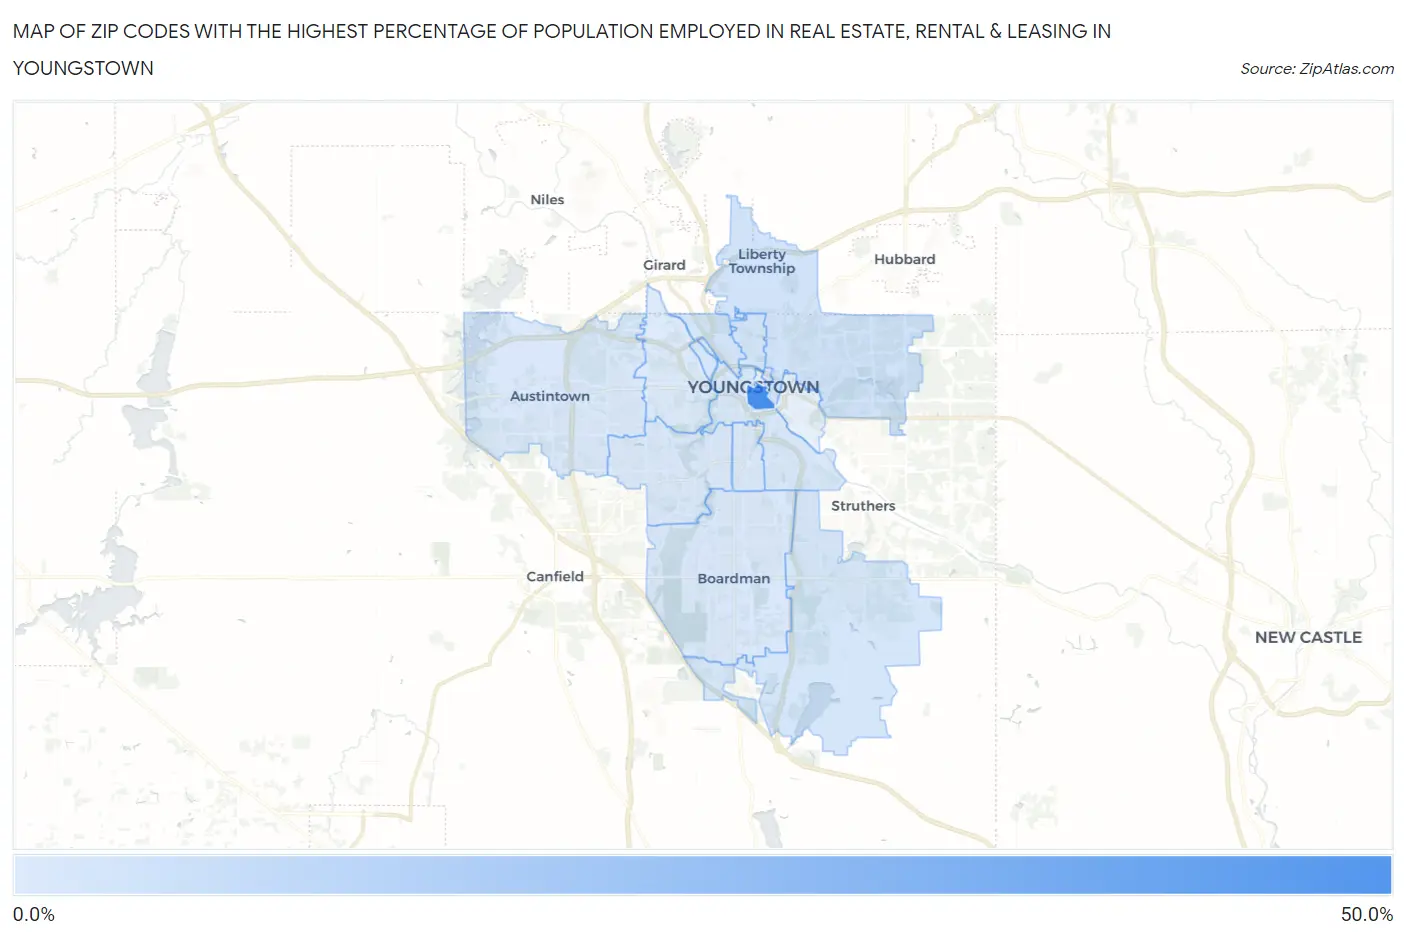
Zip Codes with the Highest Percentage of Population Employed in Real Estate, Rental & Leasing in Youngstown, OH
| Zip Code | % Employed | vs State | vs National | |
| 1. | 44503 | 40.1% | 1.5%(+38.7)#1 | 1.9%(+38.3)#27 |
| 2. | 44505 | 2.6% | 1.5%(+1.13)#126 | 1.9%(+0.690)#5,154 |
| 3. | 44510 | 2.2% | 1.5%(+0.758)#175 | 1.9%(+0.321)#6,753 |
| 4. | 44504 | 2.1% | 1.5%(+0.653)#192 | 1.9%(+0.216)#7,286 |
| 5. | 44514 | 1.7% | 1.5%(+0.264)#285 | 1.9%(-0.173)#9,633 |
| 6. | 44502 | 0.97% | 1.5%(-0.487)#536 | 1.9%(-0.924)#15,422 |
| 7. | 44515 | 0.83% | 1.5%(-0.630)#594 | 1.9%(-1.07)#16,524 |
| 8. | 44512 | 0.74% | 1.5%(-0.719)#625 | 1.9%(-1.16)#17,201 |
| 9. | 44507 | 0.62% | 1.5%(-0.835)#667 | 1.9%(-1.27)#18,114 |
| 10. | 44511 | 0.45% | 1.5%(-1.00)#718 | 1.9%(-1.44)#19,422 |
| 11. | 44509 | 0.17% | 1.5%(-1.28)#816 | 1.9%(-1.72)#21,171 |
1
Common Questions
What are the Top 10 Zip Codes with the Highest Percentage of Population Employed in Real Estate, Rental & Leasing in Youngstown, OH?
Top 10 Zip Codes with the Highest Percentage of Population Employed in Real Estate, Rental & Leasing in Youngstown, OH are:
What zip code has the Highest Percentage of Population Employed in Real Estate, Rental & Leasing in Youngstown, OH?
44503 has the Highest Percentage of Population Employed in Real Estate, Rental & Leasing in Youngstown, OH with 40.1%.
What is the Percentage of Population Employed in Real Estate, Rental & Leasing in Youngstown, OH?
Percentage of Population Employed in Real Estate, Rental & Leasing in Youngstown is 1.1%.
What is the Percentage of Population Employed in Real Estate, Rental & Leasing in Ohio?
Percentage of Population Employed in Real Estate, Rental & Leasing in Ohio is 1.5%.
What is the Percentage of Population Employed in Real Estate, Rental & Leasing in the United States?
Percentage of Population Employed in Real Estate, Rental & Leasing in the United States is 1.9%.