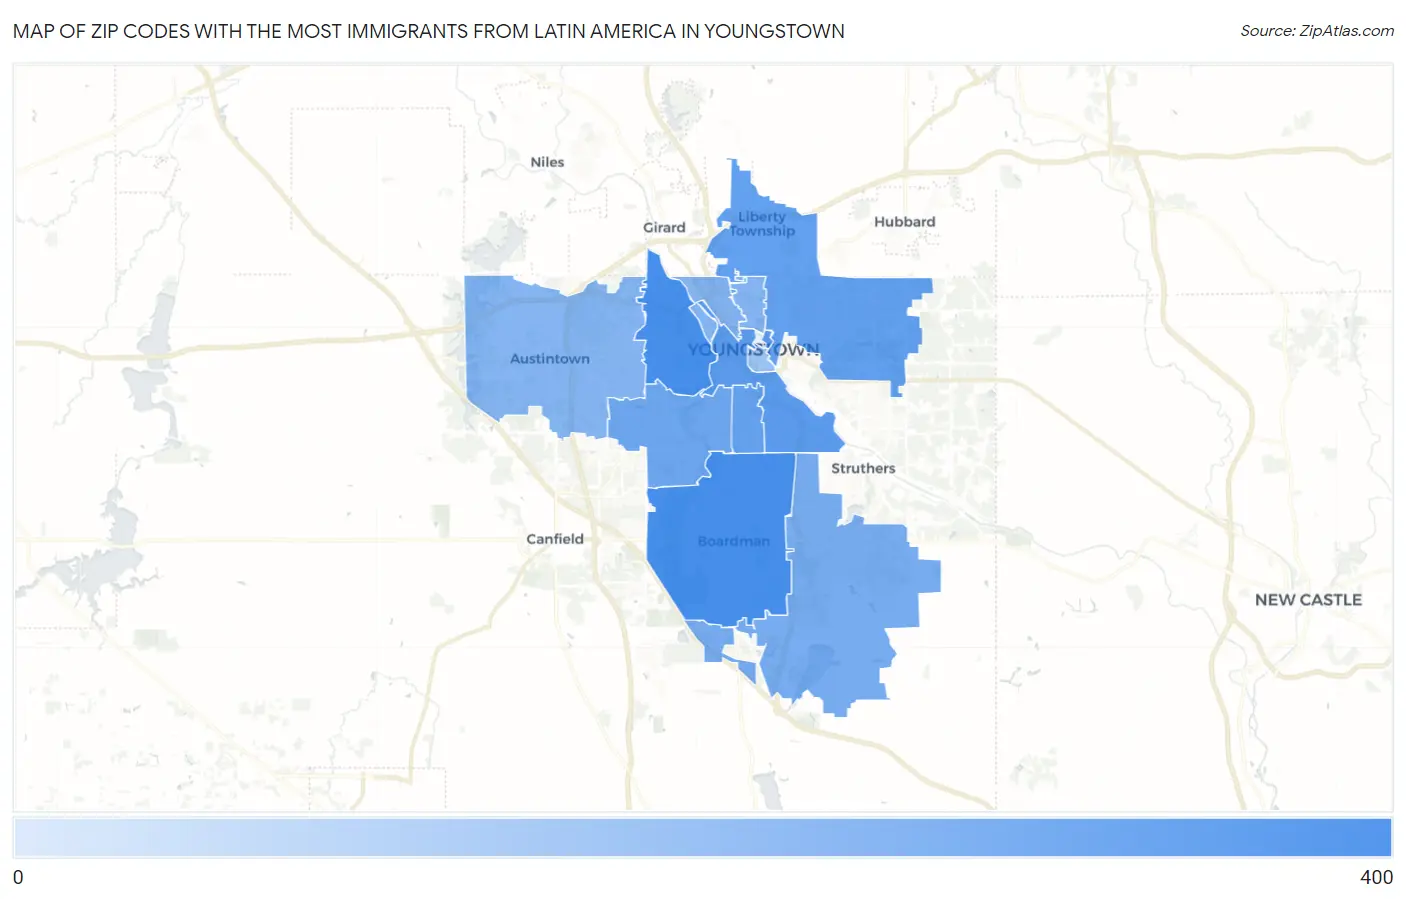
Zip Codes with the Most Immigrants from Latin America in Youngstown, OH
RELATED REPORTS & OPTIONS
Latin America
Youngstown
Compare Zip Codes
Map of Zip Codes with the Most Immigrants from Latin America in Youngstown
12
337
Zip Codes with the Most Immigrants from Latin America in Youngstown, OH
| Zip Code | Latin America | vs State | vs National | |
| 1. | 44512 | 337 | 113,804(0.30%)#89 | 22,649,518(0.00%)#7,347 |
| 2. | 44509 | 331 | 113,804(0.29%)#95 | 22,649,518(0.00%)#7,411 |
| 3. | 44502 | 170 | 113,804(0.15%)#174 | 22,649,518(0.00%)#9,553 |
| 4. | 44505 | 116 | 113,804(0.10%)#211 | 22,649,518(0.00%)#10,704 |
| 5. | 44507 | 101 | 113,804(0.09%)#238 | 22,649,518(0.00%)#11,152 |
| 6. | 44511 | 72 | 113,804(0.06%)#290 | 22,649,518(0.00%)#12,192 |
| 7. | 44514 | 49 | 113,804(0.04%)#343 | 22,649,518(0.00%)#13,279 |
| 8. | 44510 | 31 | 113,804(0.03%)#400 | 22,649,518(0.00%)#14,731 |
| 9. | 44515 | 30 | 113,804(0.03%)#402 | 22,649,518(0.00%)#14,757 |
| 10. | 44504 | 29 | 113,804(0.03%)#409 | 22,649,518(0.00%)#14,869 |
| 11. | 44503 | 12 | 113,804(0.01%)#507 | 22,649,518(0.00%)#17,412 |
1
Common Questions
What are the Top 10 Zip Codes with the Most Immigrants from Latin America in Youngstown, OH?
Top 10 Zip Codes with the Most Immigrants from Latin America in Youngstown, OH are:
What zip code has the Most Immigrants from Latin America in Youngstown, OH?
44512 has the Most Immigrants from Latin America in Youngstown, OH with 337.
What is the Total Immigrants from Latin America in Youngstown, OH?
Total Immigrants from Latin America in Youngstown is 863.
What is the Total Immigrants from Latin America in Ohio?
Total Immigrants from Latin America in Ohio is 113,804.
What is the Total Immigrants from Latin America in the United States?
Total Immigrants from Latin America in the United States is 22,649,518.