Strasburg, OH Map & Demographics
Strasburg Map
Strasburg Overview
$32,736
PER CAPITA INCOME
$85,455
AVG FAMILY INCOME
$61,833
AVG HOUSEHOLD INCOME
46.8%
WAGE / INCOME GAP [ % ]
53.2¢/ $1
WAGE / INCOME GAP [ $ ]
0.42
INEQUALITY / GINI INDEX
2,581
TOTAL POPULATION
1,286
MALE POPULATION
1,295
FEMALE POPULATION
99.31
MALES / 100 FEMALES
100.70
FEMALES / 100 MALES
46.2
MEDIAN AGE
3.0
AVG FAMILY SIZE
2.4
AVG HOUSEHOLD SIZE
1,257
LABOR FORCE [ PEOPLE ]
59.1%
PERCENT IN LABOR FORCE
3.7%
UNEMPLOYMENT RATE
Strasburg Zip Codes
Strasburg Area Codes
Income in Strasburg
Income Overview in Strasburg
Per Capita Income in Strasburg is $32,736, while median incomes of families and households are $85,455 and $61,833 respectively.
| Characteristic | Number | Measure |
| Per Capita Income | 2,581 | $32,736 |
| Median Family Income | 634 | $85,455 |
| Mean Family Income | 634 | $99,607 |
| Median Household Income | 1,086 | $61,833 |
| Mean Household Income | 1,086 | $75,564 |
| Income Deficit | 634 | $0 |
| Wage / Income Gap (%) | 2,581 | 46.85% |
| Wage / Income Gap ($) | 2,581 | 53.15¢ per $1 |
| Gini / Inequality Index | 2,581 | 0.42 |
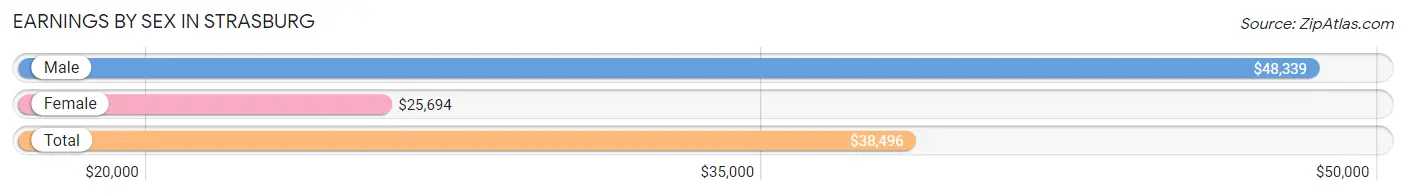
Earnings by Sex in Strasburg
Average Earnings in Strasburg are $38,496, $48,339 for men and $25,694 for women, a difference of 46.9%.
| Sex | Number | Average Earnings |
| Male | 757 (59.1%) | $48,339 |
| Female | 524 (40.9%) | $25,694 |
| Total | 1,281 (100.0%) | $38,496 |
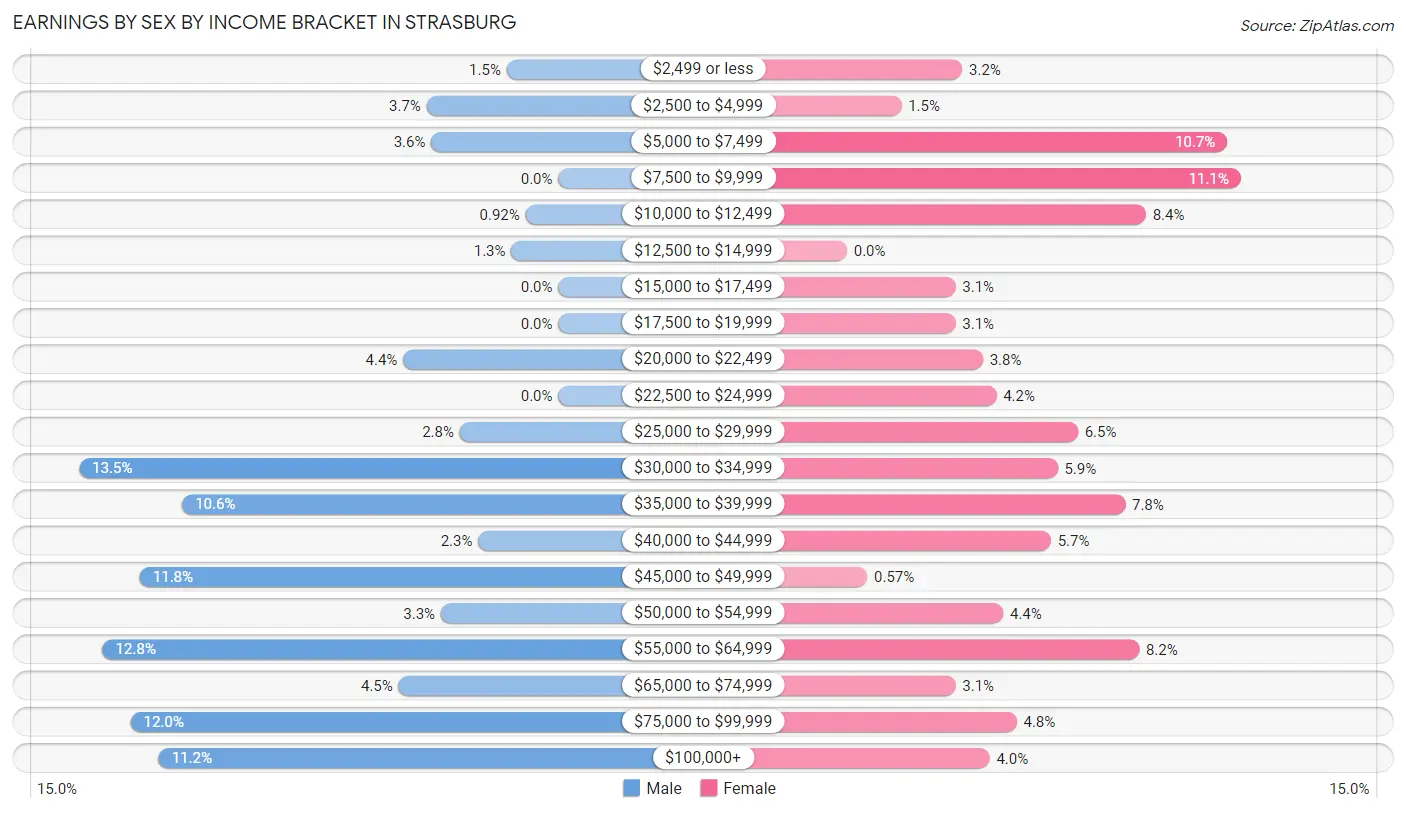
Earnings by Sex by Income Bracket in Strasburg
The most common earnings brackets in Strasburg are $30,000 to $34,999 for men (102 | 13.5%) and $7,500 to $9,999 for women (58 | 11.1%).
| Income | Male | Female |
| $2,499 or less | 11 (1.5%) | 17 (3.2%) |
| $2,500 to $4,999 | 28 (3.7%) | 8 (1.5%) |
| $5,000 to $7,499 | 27 (3.6%) | 56 (10.7%) |
| $7,500 to $9,999 | 0 (0.0%) | 58 (11.1%) |
| $10,000 to $12,499 | 7 (0.9%) | 44 (8.4%) |
| $12,500 to $14,999 | 10 (1.3%) | 0 (0.0%) |
| $15,000 to $17,499 | 0 (0.0%) | 16 (3.0%) |
| $17,500 to $19,999 | 0 (0.0%) | 16 (3.0%) |
| $20,000 to $22,499 | 33 (4.4%) | 20 (3.8%) |
| $22,500 to $24,999 | 0 (0.0%) | 22 (4.2%) |
| $25,000 to $29,999 | 21 (2.8%) | 34 (6.5%) |
| $30,000 to $34,999 | 102 (13.5%) | 31 (5.9%) |
| $35,000 to $39,999 | 80 (10.6%) | 41 (7.8%) |
| $40,000 to $44,999 | 17 (2.2%) | 30 (5.7%) |
| $45,000 to $49,999 | 89 (11.8%) | 3 (0.6%) |
| $50,000 to $54,999 | 25 (3.3%) | 23 (4.4%) |
| $55,000 to $64,999 | 97 (12.8%) | 43 (8.2%) |
| $65,000 to $74,999 | 34 (4.5%) | 16 (3.0%) |
| $75,000 to $99,999 | 91 (12.0%) | 25 (4.8%) |
| $100,000+ | 85 (11.2%) | 21 (4.0%) |
| Total | 757 (100.0%) | 524 (100.0%) |
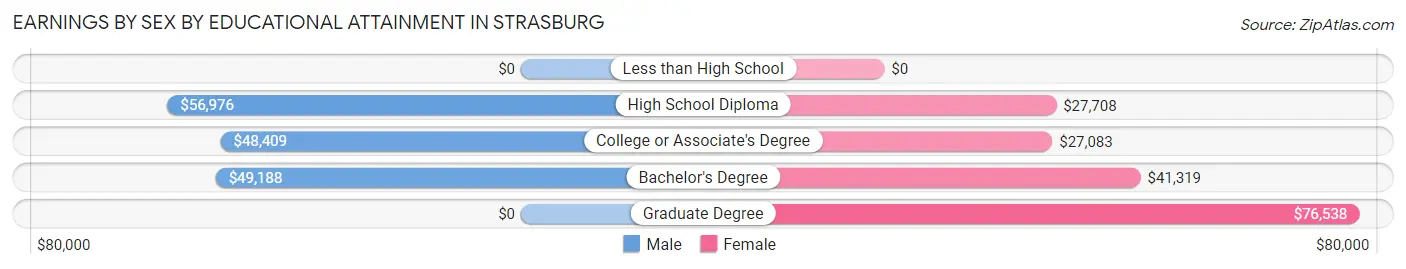
Earnings by Sex by Educational Attainment in Strasburg
Average earnings in Strasburg are $49,361 for men and $32,750 for women, a difference of 33.7%. Men with an educational attainment of high school diploma enjoy the highest average annual earnings of $56,976, while those with college or associate's degree education earn the least with $48,409. Women with an educational attainment of graduate degree earn the most with the average annual earnings of $76,538, while those with college or associate's degree education have the smallest earnings of $27,083.
| Educational Attainment | Male Income | Female Income |
| Less than High School | - | - |
| High School Diploma | $56,976 | $27,708 |
| College or Associate's Degree | $48,409 | $27,083 |
| Bachelor's Degree | $49,188 | $41,319 |
| Graduate Degree | - | - |
| Total | $49,361 | $32,750 |
Family Income in Strasburg
Family Income Brackets in Strasburg
According to the Strasburg family income data, there are 166 families falling into the $100,000 to $149,999 income range, which is the most common income bracket and makes up 26.2% of all families.
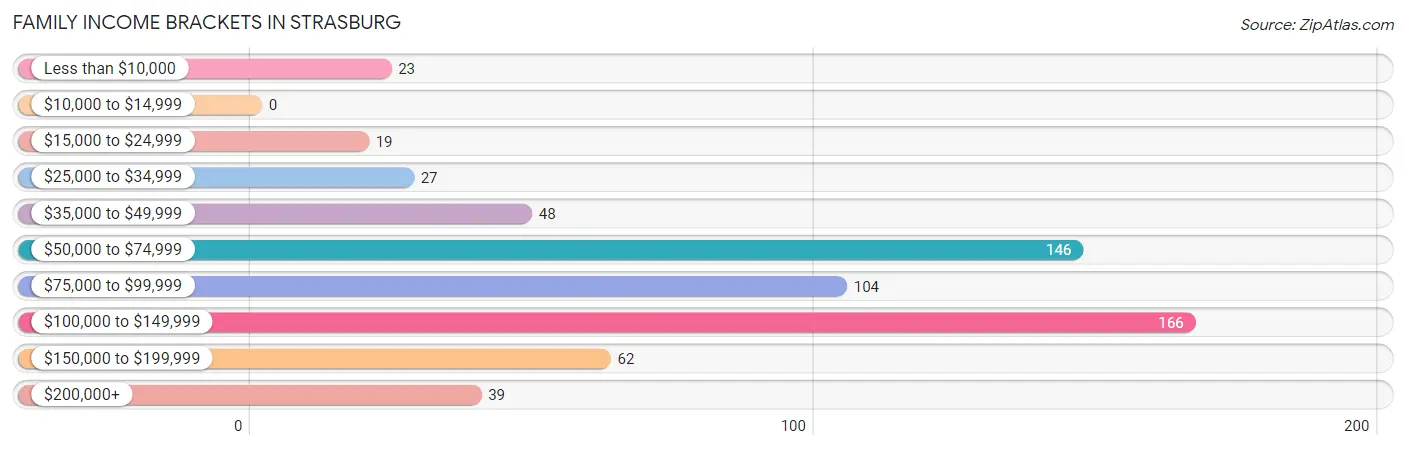
| Income Bracket | # Families | % Families |
| Less than $10,000 | 23 | 3.6% |
| $10,000 to $14,999 | 0 | 0.0% |
| $15,000 to $24,999 | 19 | 3.0% |
| $25,000 to $34,999 | 27 | 4.3% |
| $35,000 to $49,999 | 48 | 7.6% |
| $50,000 to $74,999 | 146 | 23.0% |
| $75,000 to $99,999 | 104 | 16.4% |
| $100,000 to $149,999 | 166 | 26.2% |
| $150,000 to $199,999 | 62 | 9.8% |
| $200,000+ | 39 | 6.2% |
Family Income by Famaliy Size in Strasburg
4-person families (113 | 17.8%) account for the highest median family income in Strasburg with $131,719 per family, while 3-person families (125 | 19.7%) have the highest median income of $37,101 per family member.
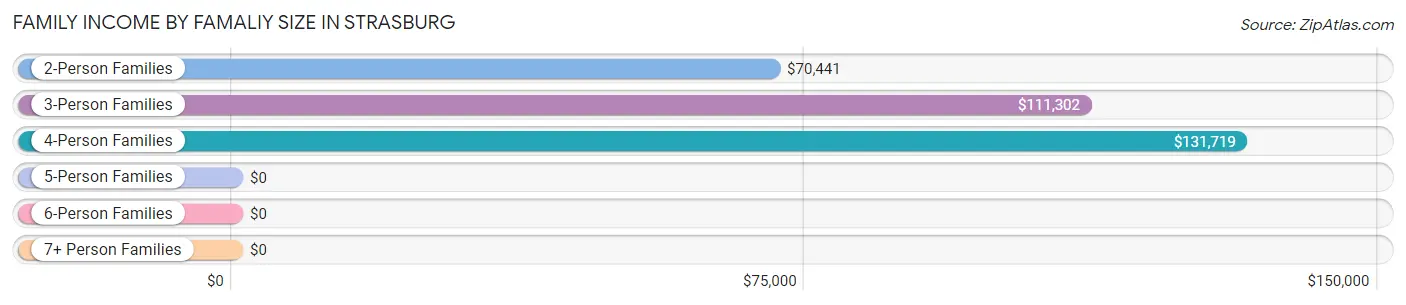
| Income Bracket | # Families | Median Income |
| 2-Person Families | 366 (57.7%) | $70,441 |
| 3-Person Families | 125 (19.7%) | $111,302 |
| 4-Person Families | 113 (17.8%) | $131,719 |
| 5-Person Families | 9 (1.4%) | $0 |
| 6-Person Families | 12 (1.9%) | $0 |
| 7+ Person Families | 9 (1.4%) | $0 |
| Total | 634 (100.0%) | $85,455 |
Family Income by Number of Earners in Strasburg
The median family income in Strasburg is $85,455, with families comprising 3+ earners (123) having the highest median family income of $165,117, while families with 1 earner (187) have the lowest median family income of $61,250, accounting for 19.4% and 29.5% of families, respectively.
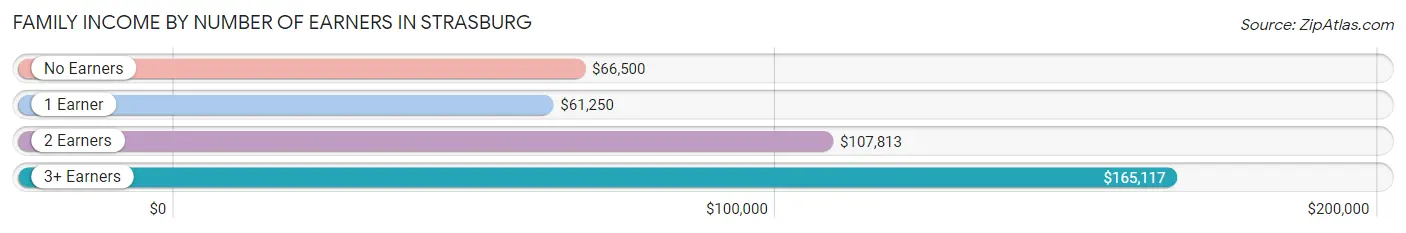
| Number of Earners | # Families | Median Income |
| No Earners | 154 (24.3%) | $66,500 |
| 1 Earner | 187 (29.5%) | $61,250 |
| 2 Earners | 170 (26.8%) | $107,813 |
| 3+ Earners | 123 (19.4%) | $165,117 |
| Total | 634 (100.0%) | $85,455 |
Household Income in Strasburg
Household Income Brackets in Strasburg
With 211 households falling in the category, the $50,000 to $74,999 income range is the most frequent in Strasburg, accounting for 19.4% of all households. In contrast, only 39 households (3.6%) fall into the $200,000+ income bracket, making it the least populous group.
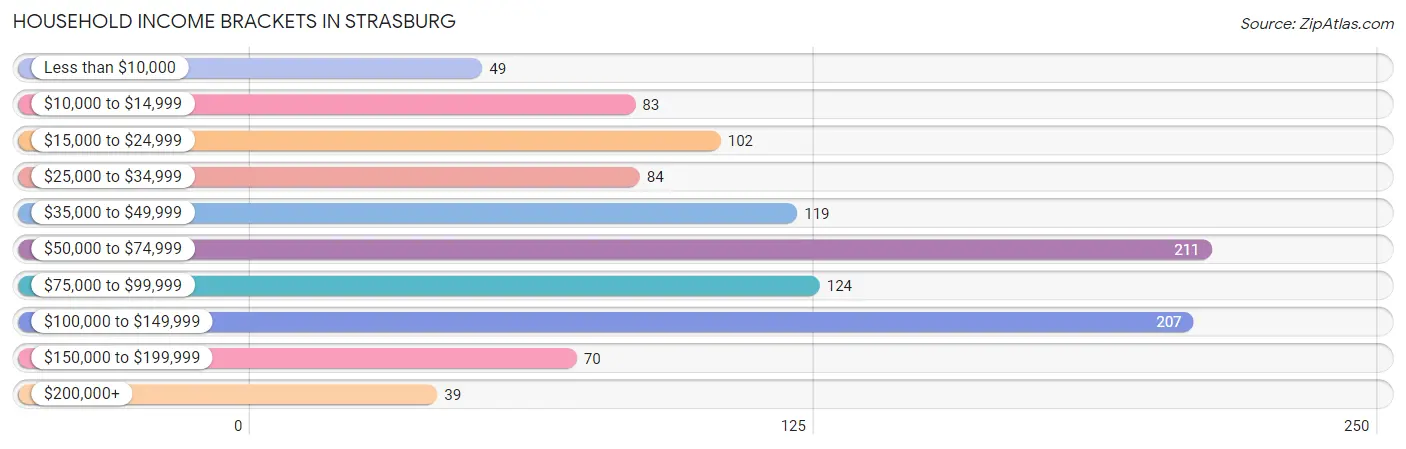
| Income Bracket | # Households | % Households |
| Less than $10,000 | 49 | 4.5% |
| $10,000 to $14,999 | 83 | 7.6% |
| $15,000 to $24,999 | 102 | 9.4% |
| $25,000 to $34,999 | 84 | 7.7% |
| $35,000 to $49,999 | 119 | 11.0% |
| $50,000 to $74,999 | 211 | 19.4% |
| $75,000 to $99,999 | 124 | 11.4% |
| $100,000 to $149,999 | 207 | 19.1% |
| $150,000 to $199,999 | 70 | 6.4% |
| $200,000+ | 39 | 3.6% |
Household Income by Householder Age in Strasburg
The median household income in Strasburg is $61,833, with the highest median household income of $86,513 found in the 45 to 64 years age bracket for the primary householder. A total of 369 households (34.0%) fall into this category. Meanwhile, the 15 to 24 years age bracket for the primary householder has the lowest median household income of $0, with 48 households (4.4%) in this group.
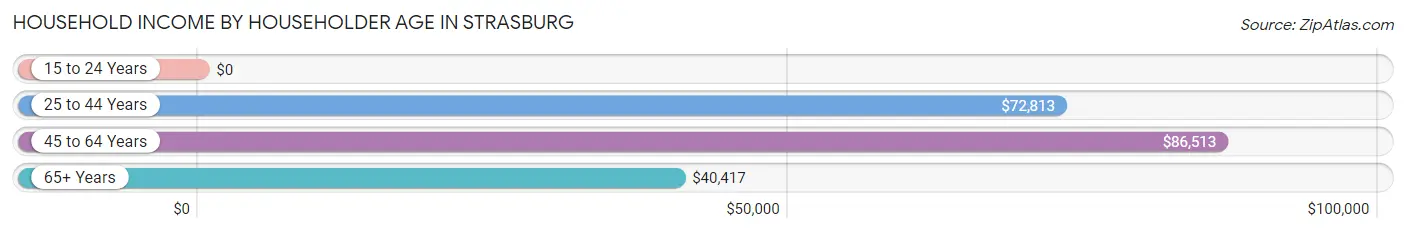
| Income Bracket | # Households | Median Income |
| 15 to 24 Years | 48 (4.4%) | $0 |
| 25 to 44 Years | 256 (23.6%) | $72,813 |
| 45 to 64 Years | 369 (34.0%) | $86,513 |
| 65+ Years | 413 (38.0%) | $40,417 |
| Total | 1,086 (100.0%) | $61,833 |
Poverty in Strasburg
Income Below Poverty by Sex and Age in Strasburg
With 14.2% poverty level for males and 11.5% for females among the residents of Strasburg, 55 to 64 year old males and 18 to 24 year old females are the most vulnerable to poverty, with 55 males (29.1%) and 23 females (35.9%) in their respective age groups living below the poverty level.
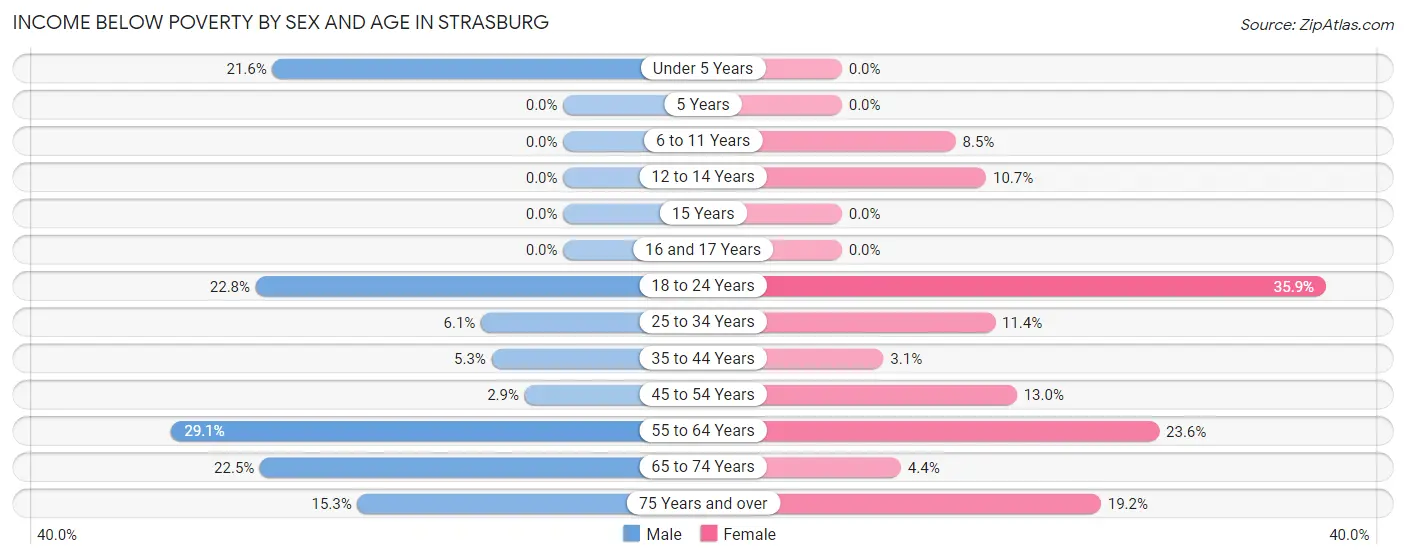
| Age Bracket | Male | Female |
| Under 5 Years | 19 (21.6%) | 0 (0.0%) |
| 5 Years | 0 (0.0%) | 0 (0.0%) |
| 6 to 11 Years | 0 (0.0%) | 6 (8.5%) |
| 12 to 14 Years | 0 (0.0%) | 3 (10.7%) |
| 15 Years | 0 (0.0%) | 0 (0.0%) |
| 16 and 17 Years | 0 (0.0%) | 0 (0.0%) |
| 18 to 24 Years | 29 (22.8%) | 23 (35.9%) |
| 25 to 34 Years | 15 (6.1%) | 14 (11.4%) |
| 35 to 44 Years | 5 (5.3%) | 3 (3.1%) |
| 45 to 54 Years | 5 (2.9%) | 20 (13.0%) |
| 55 to 64 Years | 55 (29.1%) | 41 (23.6%) |
| 65 to 74 Years | 43 (22.5%) | 9 (4.4%) |
| 75 Years and over | 11 (15.3%) | 30 (19.2%) |
| Total | 182 (14.2%) | 149 (11.5%) |
Income Above Poverty by Sex and Age in Strasburg
According to the poverty statistics in Strasburg, males aged 5 years and females aged under 5 years are the age groups that are most secure financially, with 100.0% of males and 100.0% of females in these age groups living above the poverty line.
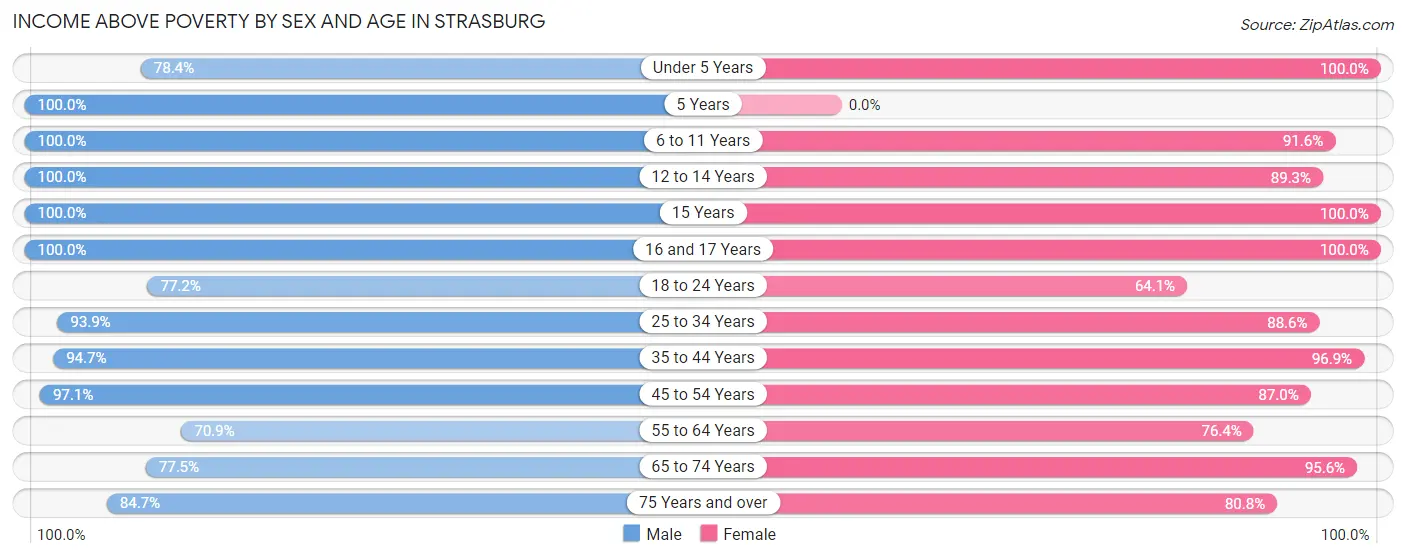
| Age Bracket | Male | Female |
| Under 5 Years | 69 (78.4%) | 169 (100.0%) |
| 5 Years | 14 (100.0%) | 0 (0.0%) |
| 6 to 11 Years | 3 (100.0%) | 65 (91.5%) |
| 12 to 14 Years | 42 (100.0%) | 25 (89.3%) |
| 15 Years | 32 (100.0%) | 2 (100.0%) |
| 16 and 17 Years | 8 (100.0%) | 52 (100.0%) |
| 18 to 24 Years | 98 (77.2%) | 41 (64.1%) |
| 25 to 34 Years | 231 (93.9%) | 109 (88.6%) |
| 35 to 44 Years | 89 (94.7%) | 94 (96.9%) |
| 45 to 54 Years | 170 (97.1%) | 134 (87.0%) |
| 55 to 64 Years | 134 (70.9%) | 133 (76.4%) |
| 65 to 74 Years | 148 (77.5%) | 196 (95.6%) |
| 75 Years and over | 61 (84.7%) | 126 (80.8%) |
| Total | 1,099 (85.8%) | 1,146 (88.5%) |
Income Below Poverty Among Married-Couple Families in Strasburg
The poverty statistics for married-couple families in Strasburg show that 2.3% or 12 of the total 532 families live below the poverty line. Families with 1 or 2 children have the highest poverty rate of 4.8%, comprising of 7 families. On the other hand, families with 3 or 4 children have the lowest poverty rate of 0.0%, which includes 0 families.
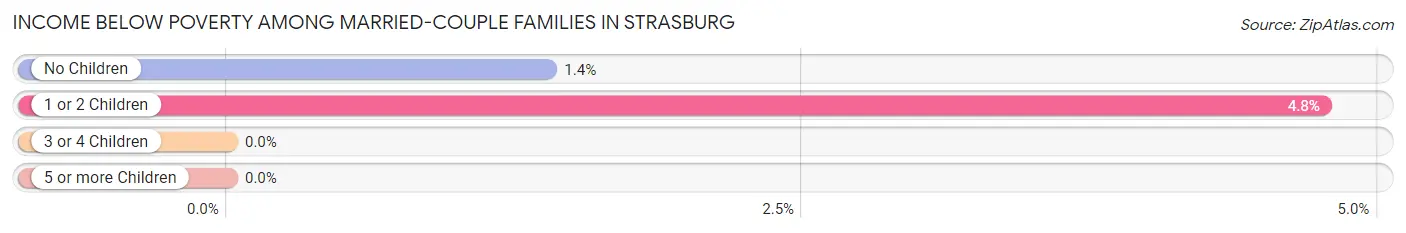
| Children | Above Poverty | Below Poverty |
| No Children | 355 (98.6%) | 5 (1.4%) |
| 1 or 2 Children | 140 (95.2%) | 7 (4.8%) |
| 3 or 4 Children | 25 (100.0%) | 0 (0.0%) |
| 5 or more Children | 0 (0.0%) | 0 (0.0%) |
| Total | 520 (97.7%) | 12 (2.3%) |
Income Below Poverty Among Single-Parent Households in Strasburg
According to the poverty data in Strasburg, 39.2% or 20 single-father households and 19.6% or 10 single-mother households are living below the poverty line. Among single-father households, those with 1 or 2 children have the highest poverty rate, with 20 households (51.3%) experiencing poverty. Likewise, among single-mother households, those with 1 or 2 children have the highest poverty rate, with 10 households (19.6%) falling below the poverty line.
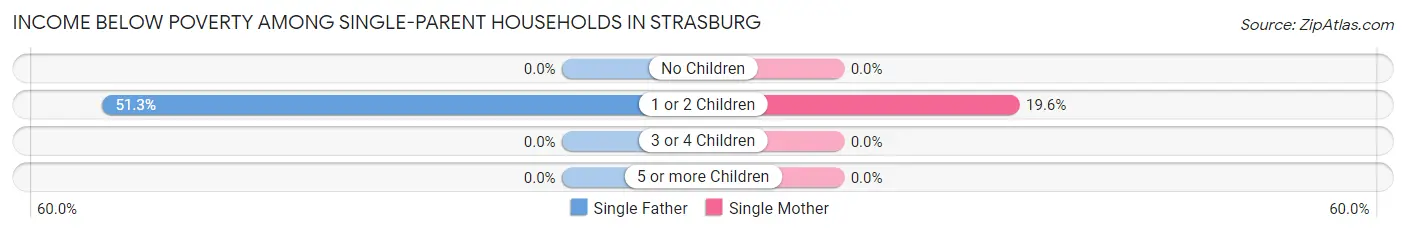
| Children | Single Father | Single Mother |
| No Children | 0 (0.0%) | 0 (0.0%) |
| 1 or 2 Children | 20 (51.3%) | 10 (19.6%) |
| 3 or 4 Children | 0 (0.0%) | 0 (0.0%) |
| 5 or more Children | 0 (0.0%) | 0 (0.0%) |
| Total | 20 (39.2%) | 10 (19.6%) |
Income Below Poverty Among Married-Couple vs Single-Parent Households in Strasburg
The poverty data for Strasburg shows that 12 of the married-couple family households (2.3%) and 30 of the single-parent households (29.4%) are living below the poverty level. Within the married-couple family households, those with 1 or 2 children have the highest poverty rate, with 7 households (4.8%) falling below the poverty line. Among the single-parent households, those with 1 or 2 children have the highest poverty rate, with 30 household (33.3%) living below poverty.
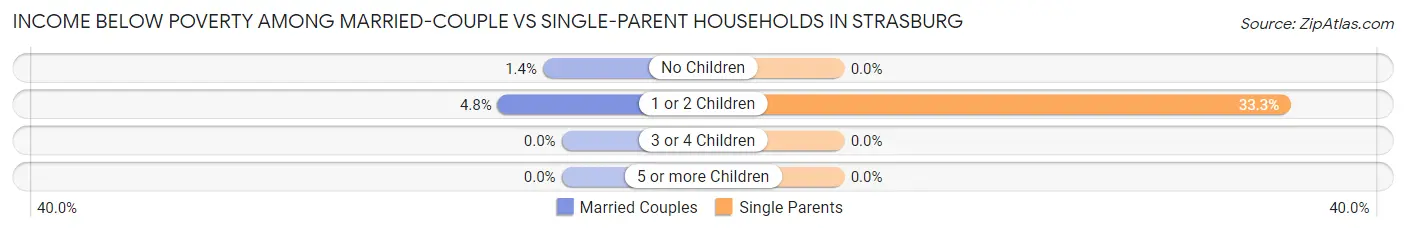
| Children | Married-Couple Families | Single-Parent Households |
| No Children | 5 (1.4%) | 0 (0.0%) |
| 1 or 2 Children | 7 (4.8%) | 30 (33.3%) |
| 3 or 4 Children | 0 (0.0%) | 0 (0.0%) |
| 5 or more Children | 0 (0.0%) | 0 (0.0%) |
| Total | 12 (2.3%) | 30 (29.4%) |
Race in Strasburg
The most populous races in Strasburg are White / Caucasian (2,295 | 88.9%), Hispanic or Latino (288 | 11.2%), and Some other Race (255 | 9.9%).
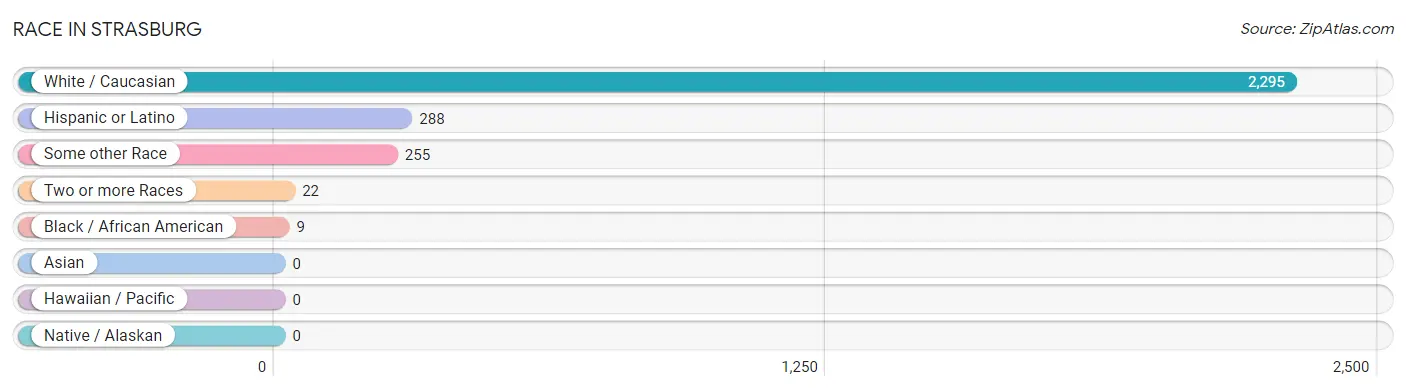
| Race | # Population | % Population |
| Asian | 0 | 0.0% |
| Black / African American | 9 | 0.4% |
| Hawaiian / Pacific | 0 | 0.0% |
| Hispanic or Latino | 288 | 11.2% |
| Native / Alaskan | 0 | 0.0% |
| White / Caucasian | 2,295 | 88.9% |
| Two or more Races | 22 | 0.9% |
| Some other Race | 255 | 9.9% |
| Total | 2,581 | 100.0% |
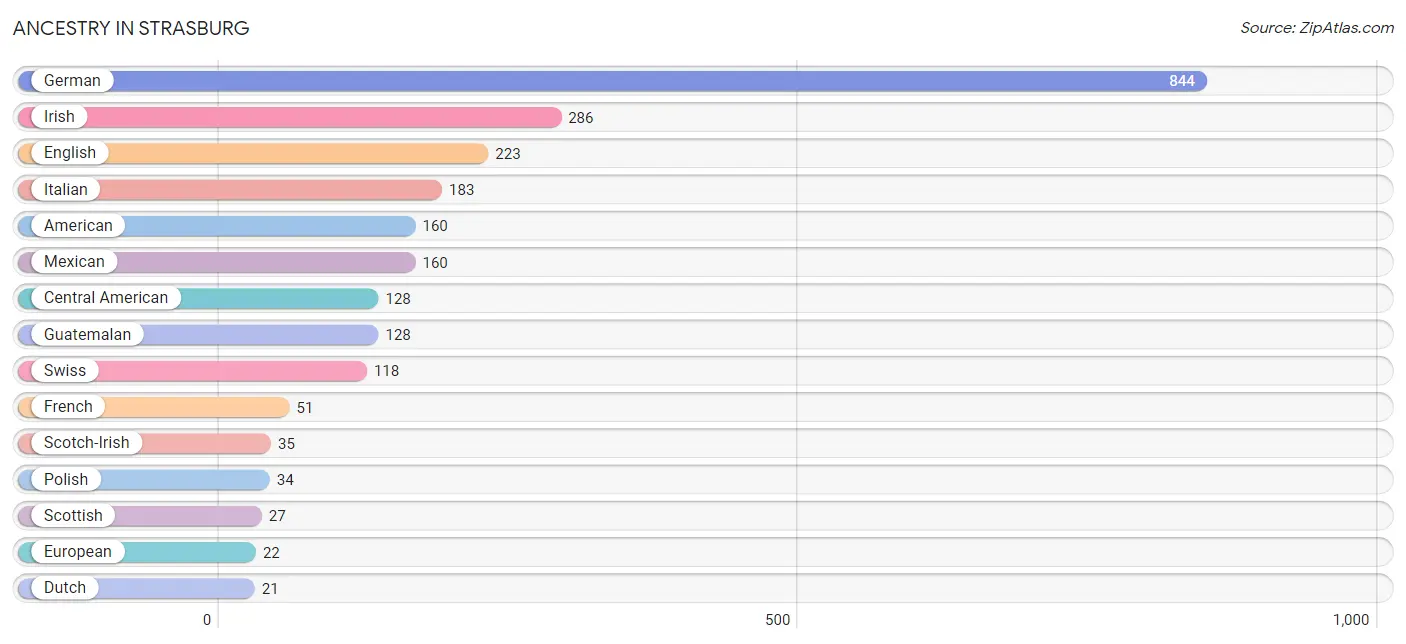
Ancestry in Strasburg
The most populous ancestries reported in Strasburg are German (844 | 32.7%), Irish (286 | 11.1%), English (223 | 8.6%), Italian (183 | 7.1%), and American (160 | 6.2%), together accounting for 65.7% of all Strasburg residents.
| Ancestry | # Population | % Population |
| American | 160 | 6.2% |
| Arab | 10 | 0.4% |
| Austrian | 4 | 0.2% |
| Belgian | 5 | 0.2% |
| British | 4 | 0.2% |
| Canadian | 5 | 0.2% |
| Central American | 128 | 5.0% |
| Cherokee | 5 | 0.2% |
| Czech | 7 | 0.3% |
| Czechoslovakian | 5 | 0.2% |
| Dutch | 21 | 0.8% |
| Egyptian | 10 | 0.4% |
| English | 223 | 8.6% |
| European | 22 | 0.9% |
| French | 51 | 2.0% |
| German | 844 | 32.7% |
| Guatemalan | 128 | 5.0% |
| Hungarian | 9 | 0.4% |
| Irish | 286 | 11.1% |
| Italian | 183 | 7.1% |
| Korean | 8 | 0.3% |
| Mexican | 160 | 6.2% |
| Norwegian | 6 | 0.2% |
| Pennsylvania German | 5 | 0.2% |
| Polish | 34 | 1.3% |
| Romanian | 5 | 0.2% |
| Scandinavian | 4 | 0.2% |
| Scotch-Irish | 35 | 1.4% |
| Scottish | 27 | 1.1% |
| Swedish | 21 | 0.8% |
| Swiss | 118 | 4.6% |
| Welsh | 6 | 0.2% | View All 32 Rows |
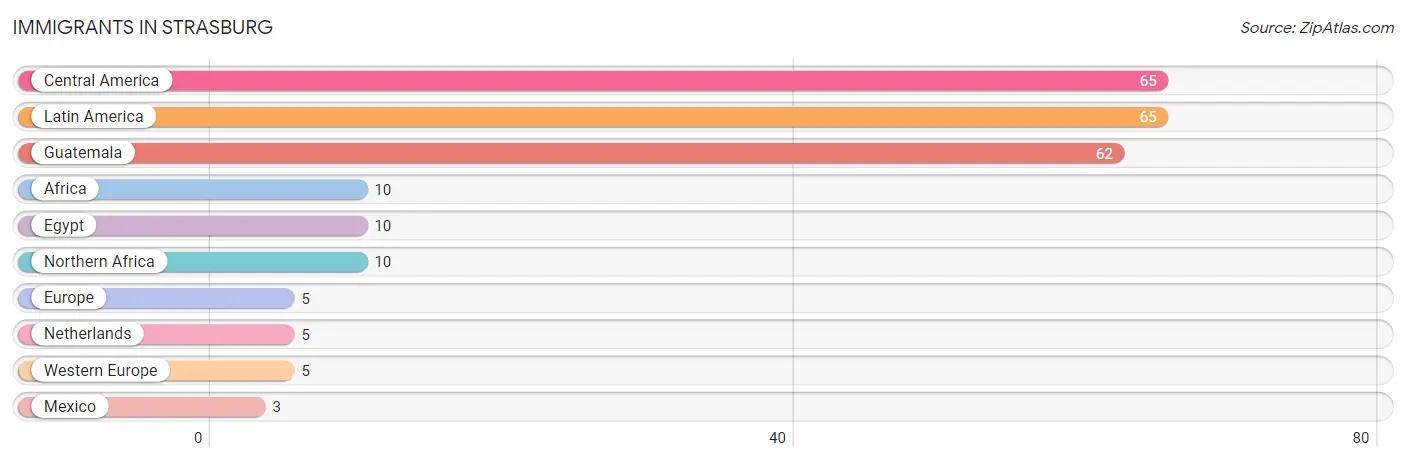
Immigrants in Strasburg
The most numerous immigrant groups reported in Strasburg came from Central America (65 | 2.5%), Latin America (65 | 2.5%), Guatemala (62 | 2.4%), Africa (10 | 0.4%), and Egypt (10 | 0.4%), together accounting for 8.2% of all Strasburg residents.
| Immigration Origin | # Population | % Population |
| Africa | 10 | 0.4% |
| Central America | 65 | 2.5% |
| Egypt | 10 | 0.4% |
| Europe | 5 | 0.2% |
| Guatemala | 62 | 2.4% |
| Latin America | 65 | 2.5% |
| Mexico | 3 | 0.1% |
| Netherlands | 5 | 0.2% |
| Northern Africa | 10 | 0.4% |
| Western Europe | 5 | 0.2% | View All 10 Rows |
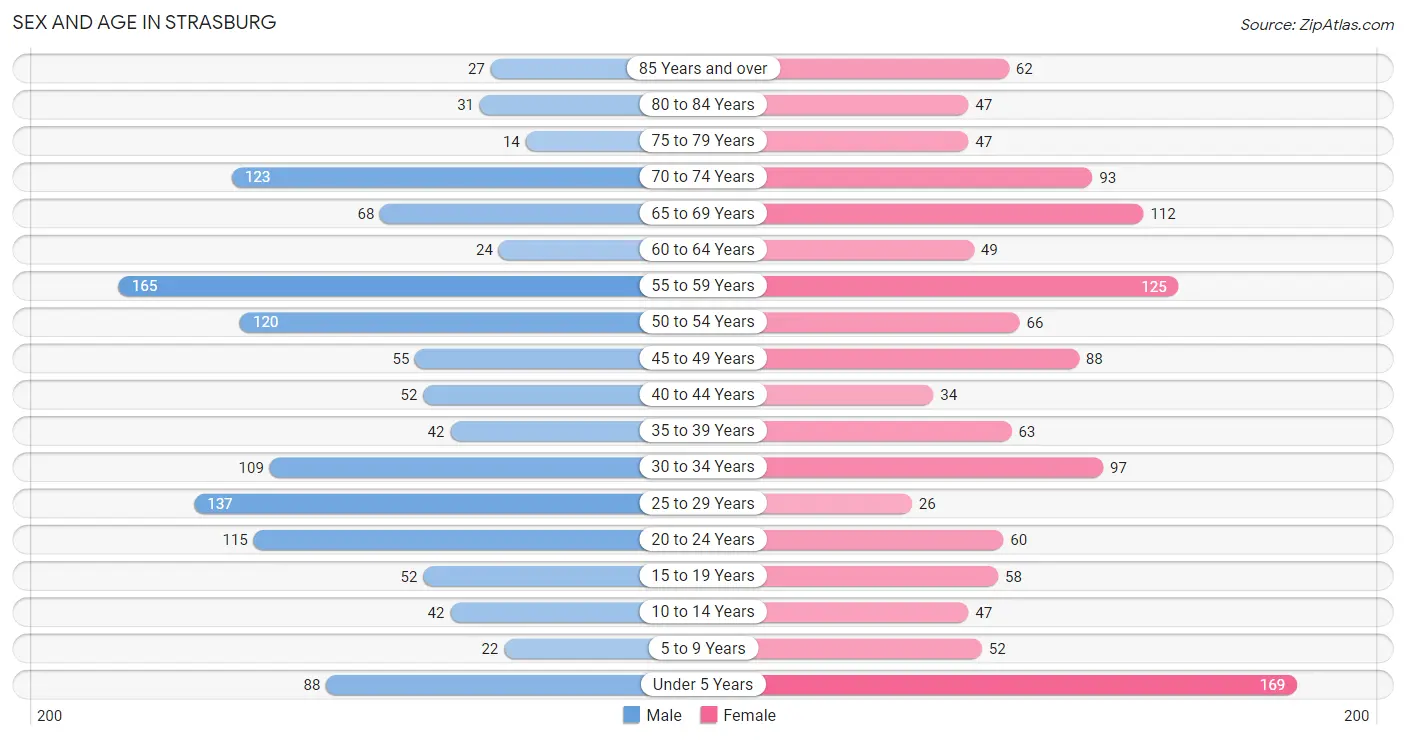
Sex and Age in Strasburg
Sex and Age in Strasburg
The most populous age groups in Strasburg are 55 to 59 Years (165 | 12.8%) for men and Under 5 Years (169 | 13.1%) for women.
| Age Bracket | Male | Female |
| Under 5 Years | 88 (6.8%) | 169 (13.1%) |
| 5 to 9 Years | 22 (1.7%) | 52 (4.0%) |
| 10 to 14 Years | 42 (3.3%) | 47 (3.6%) |
| 15 to 19 Years | 52 (4.0%) | 58 (4.5%) |
| 20 to 24 Years | 115 (8.9%) | 60 (4.6%) |
| 25 to 29 Years | 137 (10.6%) | 26 (2.0%) |
| 30 to 34 Years | 109 (8.5%) | 97 (7.5%) |
| 35 to 39 Years | 42 (3.3%) | 63 (4.9%) |
| 40 to 44 Years | 52 (4.0%) | 34 (2.6%) |
| 45 to 49 Years | 55 (4.3%) | 88 (6.8%) |
| 50 to 54 Years | 120 (9.3%) | 66 (5.1%) |
| 55 to 59 Years | 165 (12.8%) | 125 (9.7%) |
| 60 to 64 Years | 24 (1.9%) | 49 (3.8%) |
| 65 to 69 Years | 68 (5.3%) | 112 (8.6%) |
| 70 to 74 Years | 123 (9.6%) | 93 (7.2%) |
| 75 to 79 Years | 14 (1.1%) | 47 (3.6%) |
| 80 to 84 Years | 31 (2.4%) | 47 (3.6%) |
| 85 Years and over | 27 (2.1%) | 62 (4.8%) |
| Total | 1,286 (100.0%) | 1,295 (100.0%) |
Families and Households in Strasburg
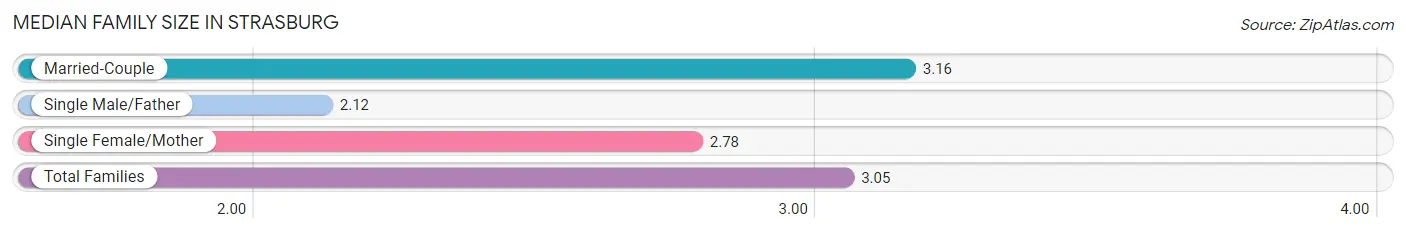
Median Family Size in Strasburg
The median family size in Strasburg is 3.05 persons per family, with married-couple families (532 | 83.9%) accounting for the largest median family size of 3.16 persons per family. On the other hand, single male/father families (51 | 8.0%) represent the smallest median family size with 2.12 persons per family.
| Family Type | # Families | Family Size |
| Married-Couple | 532 (83.9%) | 3.16 |
| Single Male/Father | 51 (8.0%) | 2.12 |
| Single Female/Mother | 51 (8.0%) | 2.78 |
| Total Families | 634 (100.0%) | 3.05 |
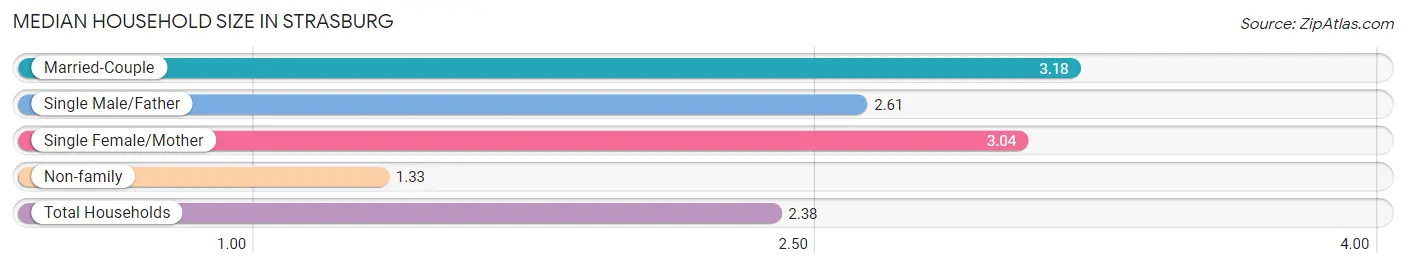
Median Household Size in Strasburg
The median household size in Strasburg is 2.38 persons per household, with married-couple households (532 | 49.0%) accounting for the largest median household size of 3.18 persons per household. non-family households (452 | 41.6%) represent the smallest median household size with 1.33 persons per household.
| Household Type | # Households | Household Size |
| Married-Couple | 532 (49.0%) | 3.18 |
| Single Male/Father | 51 (4.7%) | 2.61 |
| Single Female/Mother | 51 (4.7%) | 3.04 |
| Non-family | 452 (41.6%) | 1.33 |
| Total Households | 1,086 (100.0%) | 2.38 |
Household Size by Marriage Status in Strasburg
Out of a total of 1,086 households in Strasburg, 634 (58.4%) are family households, while 452 (41.6%) are nonfamily households. The most numerous type of family households are 2-person households, comprising 318, and the most common type of nonfamily households are 1-person households, comprising 342.
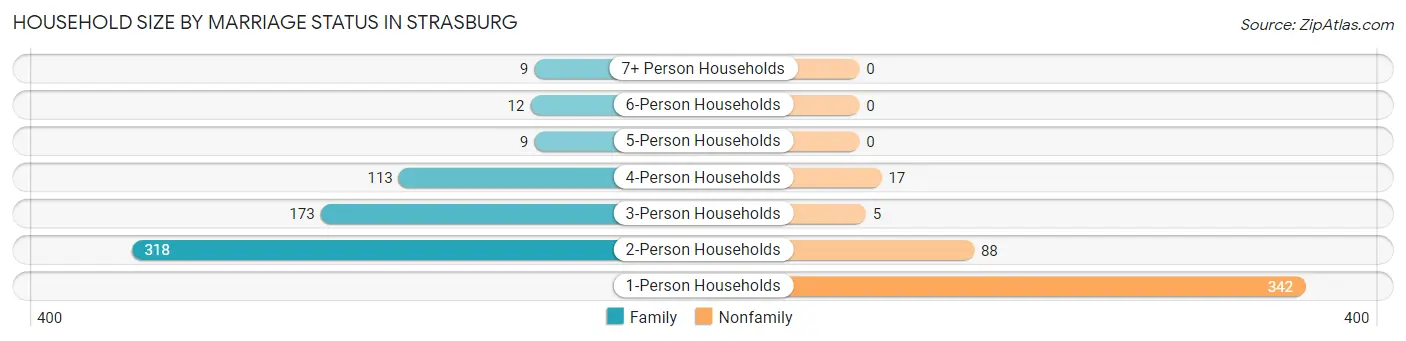
| Household Size | Family Households | Nonfamily Households |
| 1-Person Households | - | 342 (31.5%) |
| 2-Person Households | 318 (29.3%) | 88 (8.1%) |
| 3-Person Households | 173 (15.9%) | 5 (0.5%) |
| 4-Person Households | 113 (10.4%) | 17 (1.6%) |
| 5-Person Households | 9 (0.8%) | 0 (0.0%) |
| 6-Person Households | 12 (1.1%) | 0 (0.0%) |
| 7+ Person Households | 9 (0.8%) | 0 (0.0%) |
| Total | 634 (58.4%) | 452 (41.6%) |
Female Fertility in Strasburg
Fertility by Age in Strasburg
Average fertility rate in Strasburg is 141.0 births per 1,000 women. Women in the age bracket of 20 to 34 years have the highest fertility rate with 246.0 births per 1,000 women. Women in the age bracket of 20 to 34 years acount for 73.8% of all women with births.
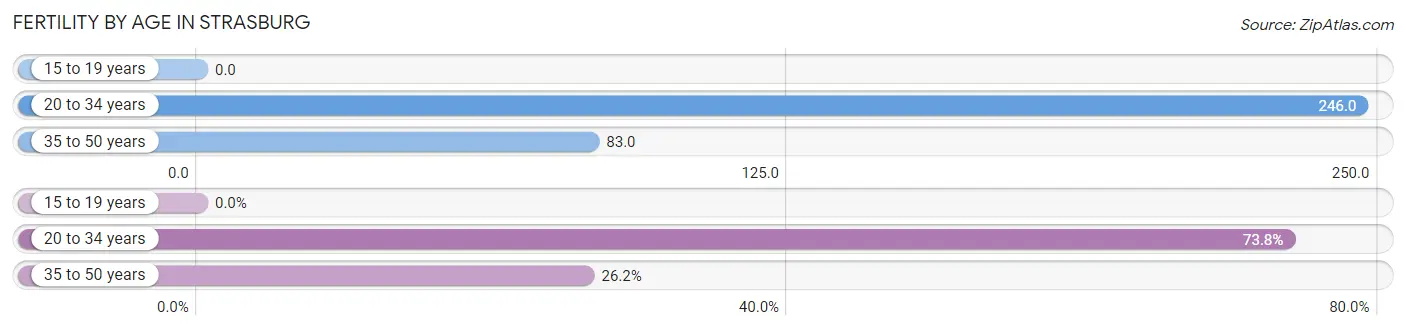
| Age Bracket | Women with Births | Births / 1,000 Women |
| 15 to 19 years | 0 (0.0%) | 0.0 |
| 20 to 34 years | 45 (73.8%) | 246.0 |
| 35 to 50 years | 16 (26.2%) | 83.0 |
| Total | 61 (100.0%) | 141.0 |
Fertility by Age by Marriage Status in Strasburg
72.1% of women with births (61) in Strasburg are married. The highest percentage of unmarried women with births falls into 20 to 34 years age bracket with 37.8% of them unmarried at the time of birth, while the lowest percentage of unmarried women with births belong to 35 to 50 years age bracket with 0.0% of them unmarried.
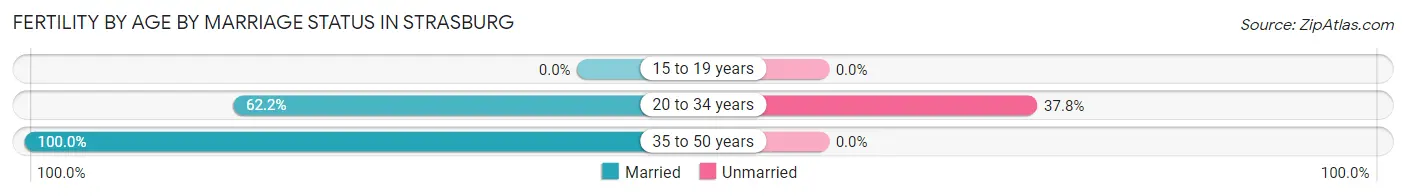
| Age Bracket | Married | Unmarried |
| 15 to 19 years | 0 (0.0%) | 0 (0.0%) |
| 20 to 34 years | 28 (62.2%) | 17 (37.8%) |
| 35 to 50 years | 16 (100.0%) | 0 (0.0%) |
| Total | 44 (72.1%) | 17 (27.9%) |
Fertility by Education in Strasburg
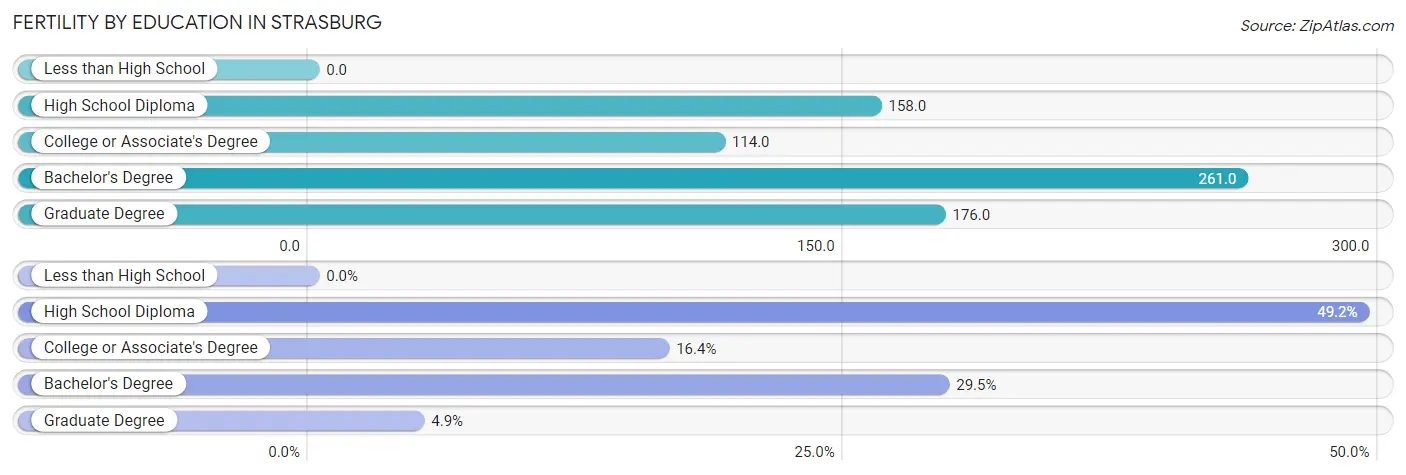
| Educational Attainment | Women with Births | Births / 1,000 Women |
| Less than High School | 0 (0.0%) | 0.0 |
| High School Diploma | 30 (49.2%) | 158.0 |
| College or Associate's Degree | 10 (16.4%) | 114.0 |
| Bachelor's Degree | 18 (29.5%) | 261.0 |
| Graduate Degree | 3 (4.9%) | 176.0 |
| Total | 61 (100.0%) | 141.0 |
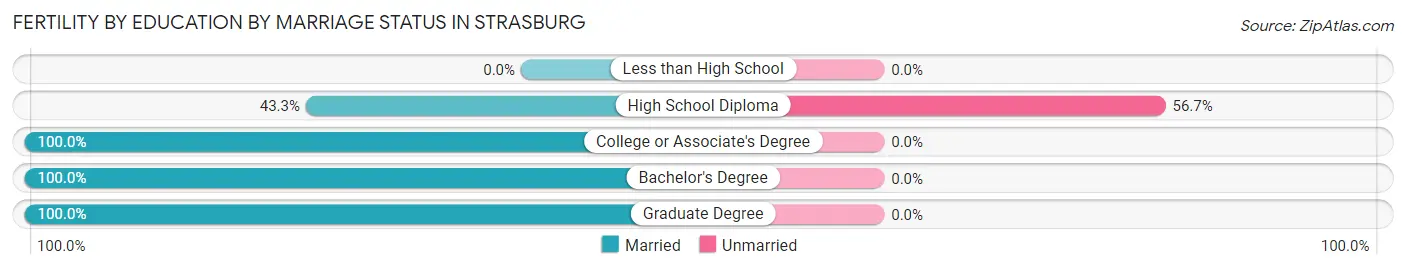
Fertility by Education by Marriage Status in Strasburg
27.9% of women with births in Strasburg are unmarried. Women with the educational attainment of college or associate's degree are most likely to be married with 100.0% of them married at childbirth, while women with the educational attainment of high school diploma are least likely to be married with 56.7% of them unmarried at childbirth.
| Educational Attainment | Married | Unmarried |
| Less than High School | 0 (0.0%) | 0 (0.0%) |
| High School Diploma | 13 (43.3%) | 17 (56.7%) |
| College or Associate's Degree | 10 (100.0%) | 0 (0.0%) |
| Bachelor's Degree | 18 (100.0%) | 0 (0.0%) |
| Graduate Degree | 3 (100.0%) | 0 (0.0%) |
| Total | 44 (72.1%) | 17 (27.9%) |
Employment Characteristics in Strasburg
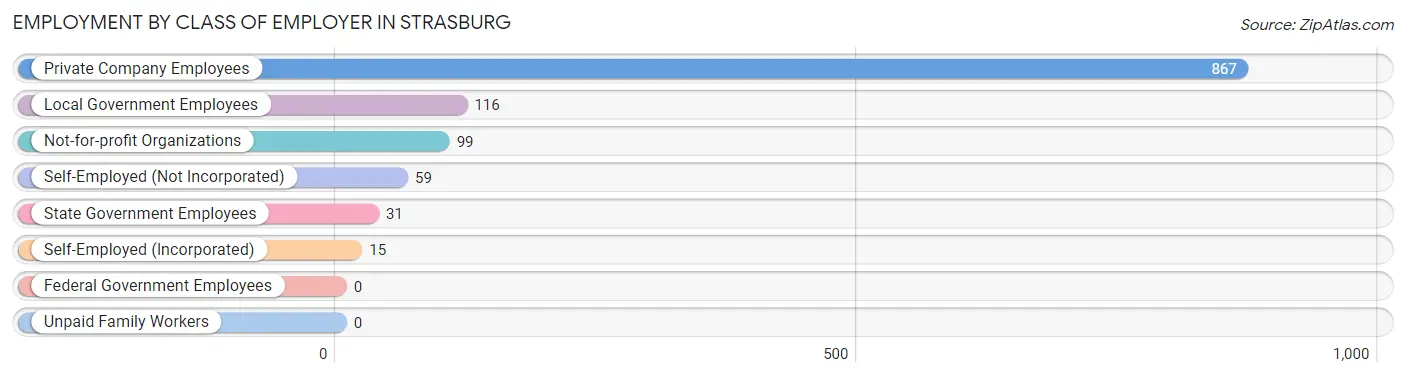
Employment by Class of Employer in Strasburg
Among the 1,187 employed individuals in Strasburg, private company employees (867 | 73.0%), local government employees (116 | 9.8%), and not-for-profit organizations (99 | 8.3%) make up the most common classes of employment.
| Employer Class | # Employees | % Employees |
| Private Company Employees | 867 | 73.0% |
| Self-Employed (Incorporated) | 15 | 1.3% |
| Self-Employed (Not Incorporated) | 59 | 5.0% |
| Not-for-profit Organizations | 99 | 8.3% |
| Local Government Employees | 116 | 9.8% |
| State Government Employees | 31 | 2.6% |
| Federal Government Employees | 0 | 0.0% |
| Unpaid Family Workers | 0 | 0.0% |
| Total | 1,187 | 100.0% |
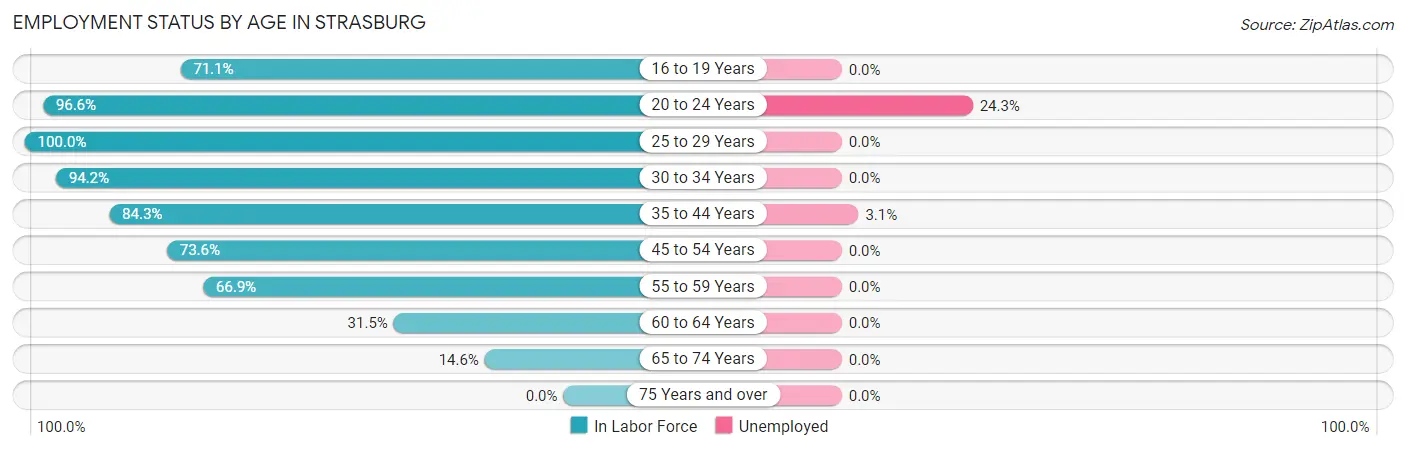
Employment Status by Age in Strasburg
According to the labor force statistics for Strasburg, out of the total population over 16 years of age (2,127), 59.1% or 1,257 individuals are in the labor force, with 3.7% or 47 of them unemployed. The age group with the highest labor force participation rate is 25 to 29 years, with 100.0% or 163 individuals in the labor force. Within the labor force, the 20 to 24 years age range has the highest percentage of unemployed individuals, with 24.3% or 41 of them being unemployed.
| Age Bracket | In Labor Force | Unemployed |
| 16 to 19 Years | 54 (71.1%) | 0 (0.0%) |
| 20 to 24 Years | 169 (96.6%) | 41 (24.3%) |
| 25 to 29 Years | 163 (100.0%) | 0 (0.0%) |
| 30 to 34 Years | 194 (94.2%) | 0 (0.0%) |
| 35 to 44 Years | 161 (84.3%) | 5 (3.1%) |
| 45 to 54 Years | 242 (73.6%) | 0 (0.0%) |
| 55 to 59 Years | 194 (66.9%) | 0 (0.0%) |
| 60 to 64 Years | 23 (31.5%) | 0 (0.0%) |
| 65 to 74 Years | 58 (14.6%) | 0 (0.0%) |
| 75 Years and over | 0 (0.0%) | 0 (0.0%) |
| Total | 1,257 (59.1%) | 47 (3.7%) |
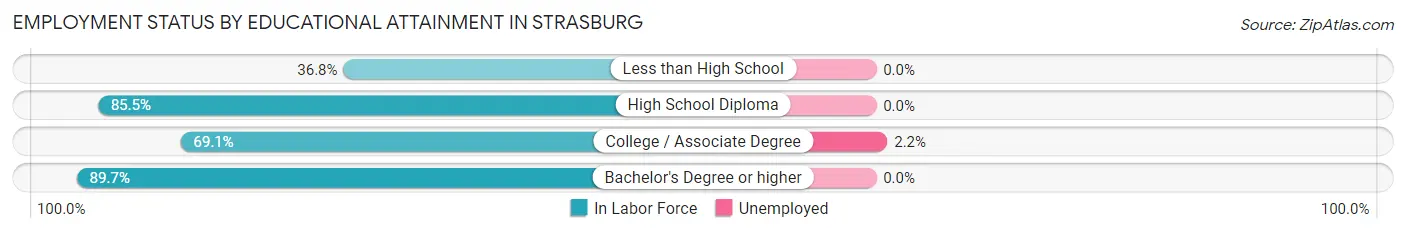
Employment Status by Educational Attainment in Strasburg
According to labor force statistics for Strasburg, 78.0% of individuals (977) out of the total population between 25 and 64 years of age (1,252) are in the labor force, with 0.5% or 5 of them being unemployed. The group with the highest labor force participation rate are those with the educational attainment of bachelor's degree or higher, with 89.7% or 271 individuals in the labor force. Within the labor force, individuals with college / associate degree education have the highest percentage of unemployment, with 2.2% or 5 of them being unemployed.
| Educational Attainment | In Labor Force | Unemployed |
| Less than High School | 39 (36.8%) | 0 (0.0%) |
| High School Diploma | 437 (85.5%) | 0 (0.0%) |
| College / Associate Degree | 230 (69.1%) | 7 (2.2%) |
| Bachelor's Degree or higher | 271 (89.7%) | 0 (0.0%) |
| Total | 977 (78.0%) | 6 (0.5%) |
Employment Occupations by Sex in Strasburg
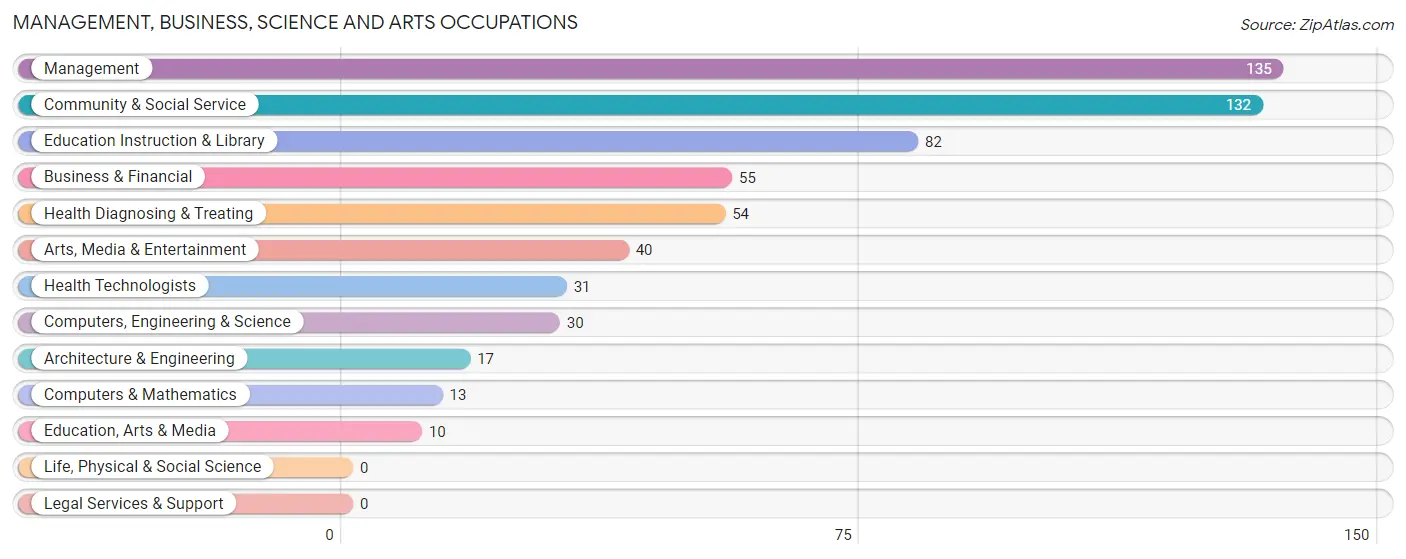
Management, Business, Science and Arts Occupations
The most common Management, Business, Science and Arts occupations in Strasburg are Management (135 | 11.1%), Community & Social Service (132 | 10.9%), Education Instruction & Library (82 | 6.8%), Business & Financial (55 | 4.5%), and Health Diagnosing & Treating (54 | 4.5%).
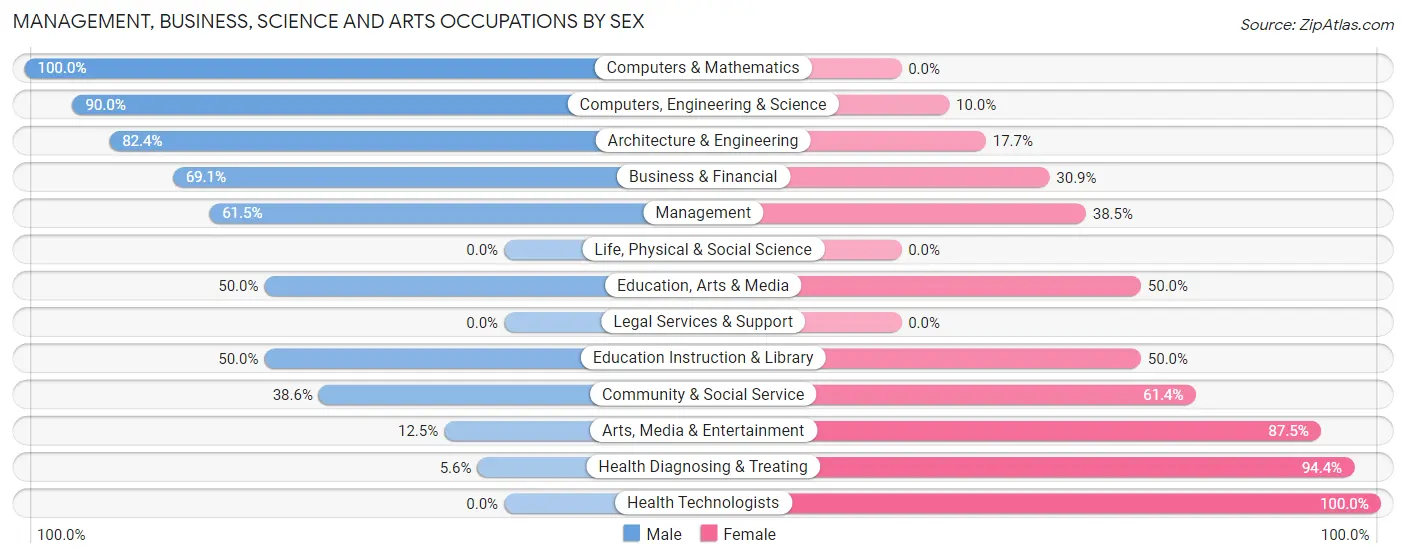
Management, Business, Science and Arts Occupations by Sex
Within the Management, Business, Science and Arts occupations in Strasburg, the most male-oriented occupations are Computers & Mathematics (100.0%), Computers, Engineering & Science (90.0%), and Architecture & Engineering (82.4%), while the most female-oriented occupations are Health Technologists (100.0%), Health Diagnosing & Treating (94.4%), and Arts, Media & Entertainment (87.5%).
| Occupation | Male | Female |
| Management | 83 (61.5%) | 52 (38.5%) |
| Business & Financial | 38 (69.1%) | 17 (30.9%) |
| Computers, Engineering & Science | 27 (90.0%) | 3 (10.0%) |
| Computers & Mathematics | 13 (100.0%) | 0 (0.0%) |
| Architecture & Engineering | 14 (82.4%) | 3 (17.6%) |
| Life, Physical & Social Science | 0 (0.0%) | 0 (0.0%) |
| Community & Social Service | 51 (38.6%) | 81 (61.4%) |
| Education, Arts & Media | 5 (50.0%) | 5 (50.0%) |
| Legal Services & Support | 0 (0.0%) | 0 (0.0%) |
| Education Instruction & Library | 41 (50.0%) | 41 (50.0%) |
| Arts, Media & Entertainment | 5 (12.5%) | 35 (87.5%) |
| Health Diagnosing & Treating | 3 (5.6%) | 51 (94.4%) |
| Health Technologists | 0 (0.0%) | 31 (100.0%) |
| Total (Category) | 202 (49.7%) | 204 (50.2%) |
| Total (Overall) | 725 (59.8%) | 487 (40.2%) |
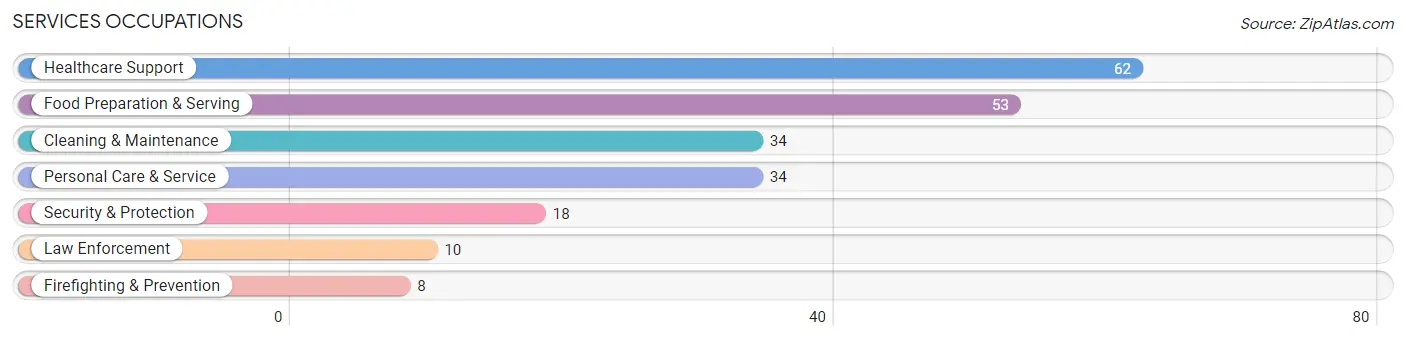
Services Occupations
The most common Services occupations in Strasburg are Healthcare Support (62 | 5.1%), Food Preparation & Serving (53 | 4.4%), Cleaning & Maintenance (34 | 2.8%), Personal Care & Service (34 | 2.8%), and Security & Protection (18 | 1.5%).
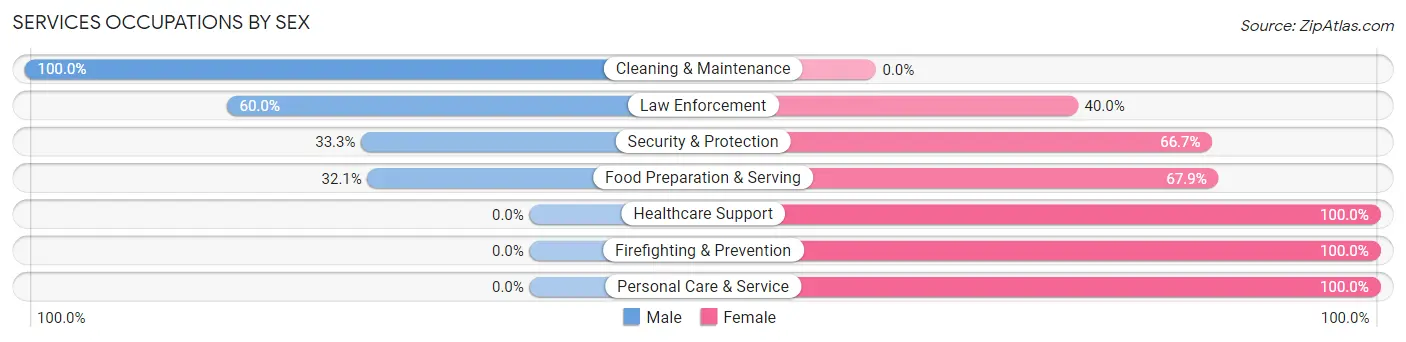
Services Occupations by Sex
Within the Services occupations in Strasburg, the most male-oriented occupations are Cleaning & Maintenance (100.0%), Law Enforcement (60.0%), and Security & Protection (33.3%), while the most female-oriented occupations are Healthcare Support (100.0%), Firefighting & Prevention (100.0%), and Personal Care & Service (100.0%).
| Occupation | Male | Female |
| Healthcare Support | 0 (0.0%) | 62 (100.0%) |
| Security & Protection | 6 (33.3%) | 12 (66.7%) |
| Firefighting & Prevention | 0 (0.0%) | 8 (100.0%) |
| Law Enforcement | 6 (60.0%) | 4 (40.0%) |
| Food Preparation & Serving | 17 (32.1%) | 36 (67.9%) |
| Cleaning & Maintenance | 34 (100.0%) | 0 (0.0%) |
| Personal Care & Service | 0 (0.0%) | 34 (100.0%) |
| Total (Category) | 57 (28.4%) | 144 (71.6%) |
| Total (Overall) | 725 (59.8%) | 487 (40.2%) |
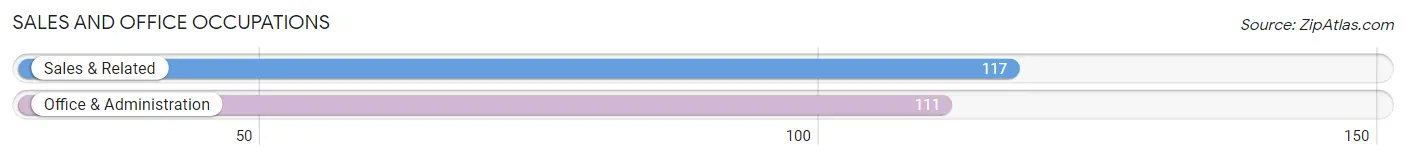
Sales and Office Occupations
The most common Sales and Office occupations in Strasburg are Sales & Related (117 | 9.7%), and Office & Administration (111 | 9.2%).
Sales and Office Occupations by Sex
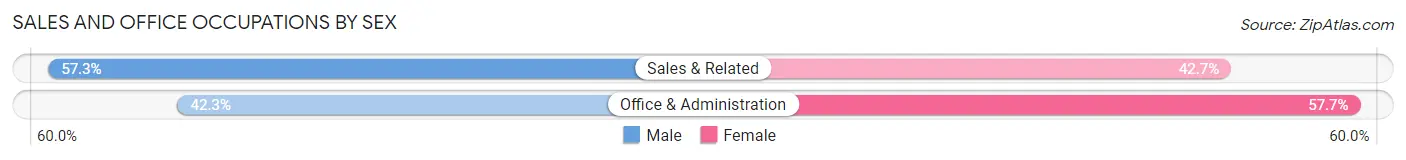
| Occupation | Male | Female |
| Sales & Related | 67 (57.3%) | 50 (42.7%) |
| Office & Administration | 47 (42.3%) | 64 (57.7%) |
| Total (Category) | 114 (50.0%) | 114 (50.0%) |
| Total (Overall) | 725 (59.8%) | 487 (40.2%) |
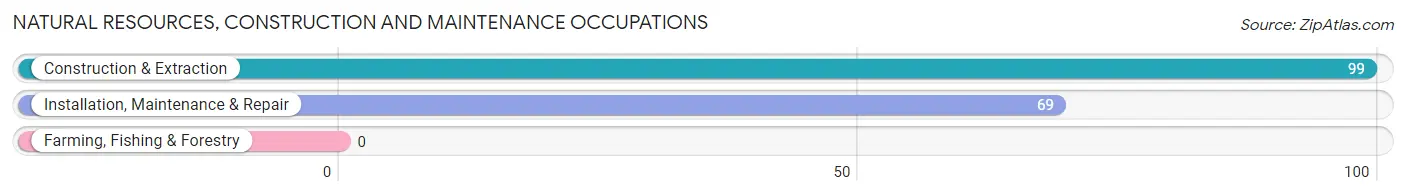
Natural Resources, Construction and Maintenance Occupations
The most common Natural Resources, Construction and Maintenance occupations in Strasburg are Construction & Extraction (99 | 8.2%), and Installation, Maintenance & Repair (69 | 5.7%).
Natural Resources, Construction and Maintenance Occupations by Sex
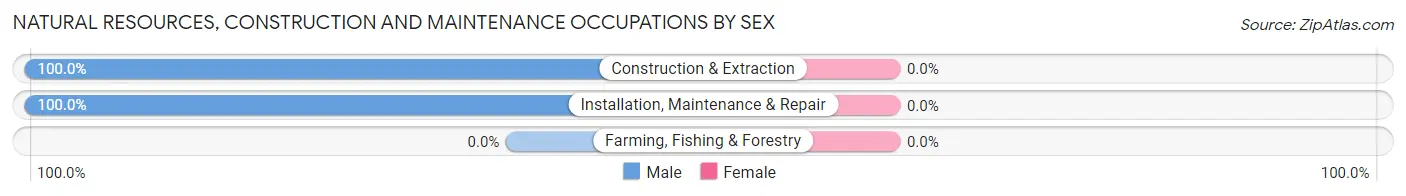
| Occupation | Male | Female |
| Farming, Fishing & Forestry | 0 (0.0%) | 0 (0.0%) |
| Construction & Extraction | 99 (100.0%) | 0 (0.0%) |
| Installation, Maintenance & Repair | 69 (100.0%) | 0 (0.0%) |
| Total (Category) | 168 (100.0%) | 0 (0.0%) |
| Total (Overall) | 725 (59.8%) | 487 (40.2%) |
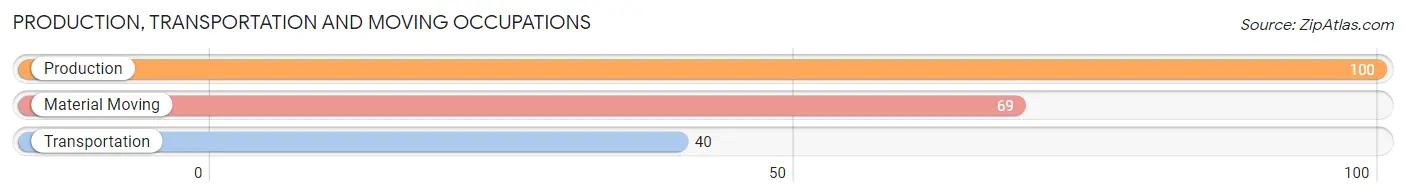
Production, Transportation and Moving Occupations
The most common Production, Transportation and Moving occupations in Strasburg are Production (100 | 8.3%), Material Moving (69 | 5.7%), and Transportation (40 | 3.3%).
Production, Transportation and Moving Occupations by Sex
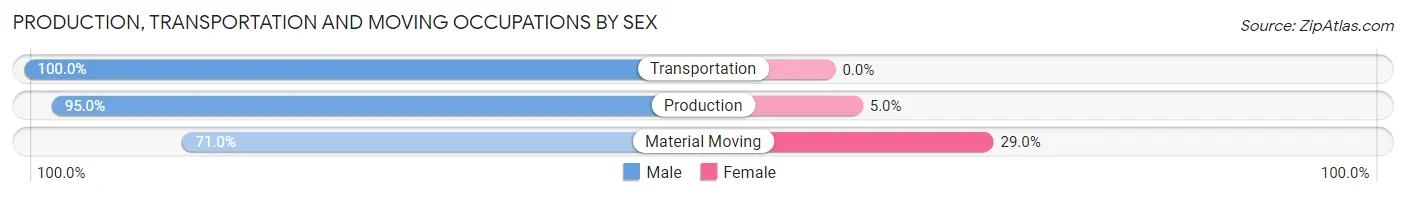
| Occupation | Male | Female |
| Production | 95 (95.0%) | 5 (5.0%) |
| Transportation | 40 (100.0%) | 0 (0.0%) |
| Material Moving | 49 (71.0%) | 20 (29.0%) |
| Total (Category) | 184 (88.0%) | 25 (12.0%) |
| Total (Overall) | 725 (59.8%) | 487 (40.2%) |
Employment Industries by Sex in Strasburg
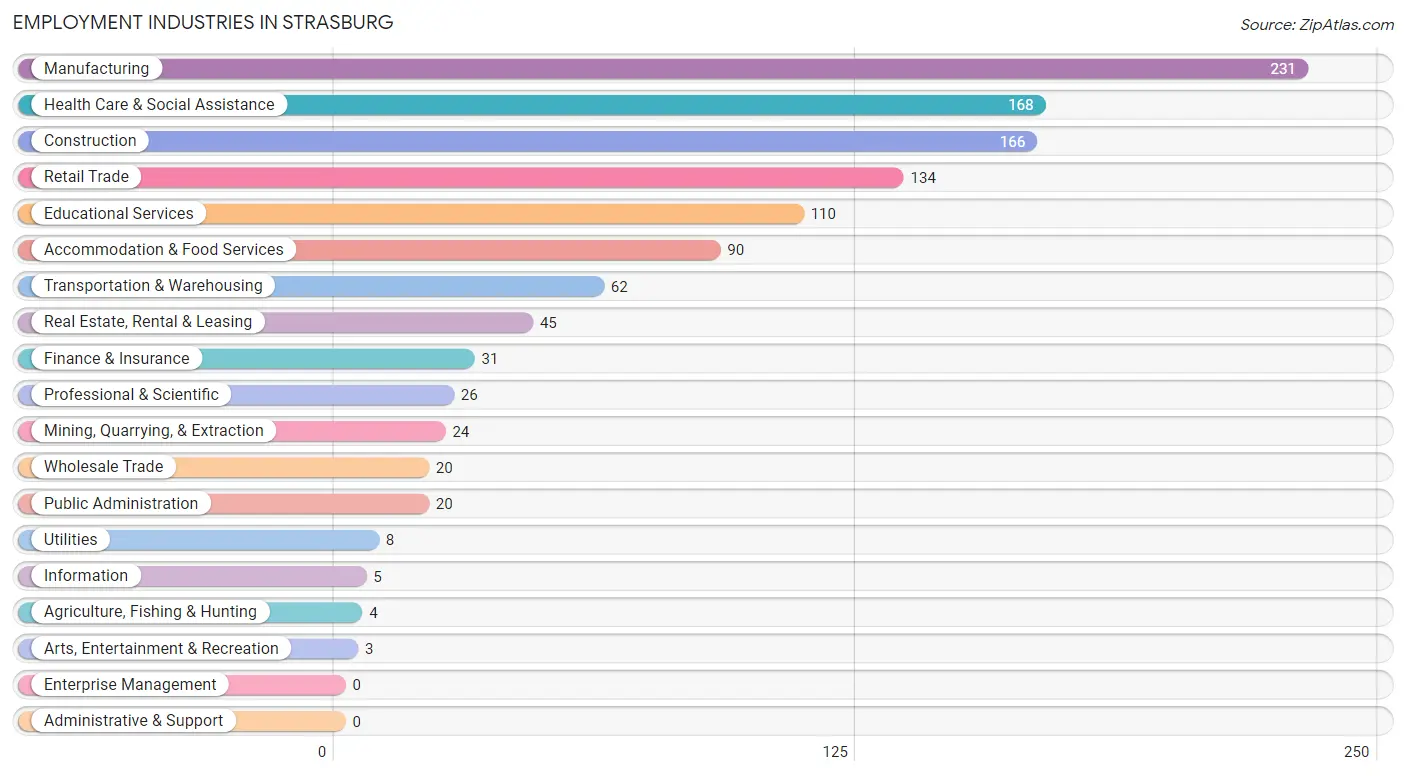
Employment Industries in Strasburg
The major employment industries in Strasburg include Manufacturing (231 | 19.1%), Health Care & Social Assistance (168 | 13.9%), Construction (166 | 13.7%), Retail Trade (134 | 11.1%), and Educational Services (110 | 9.1%).
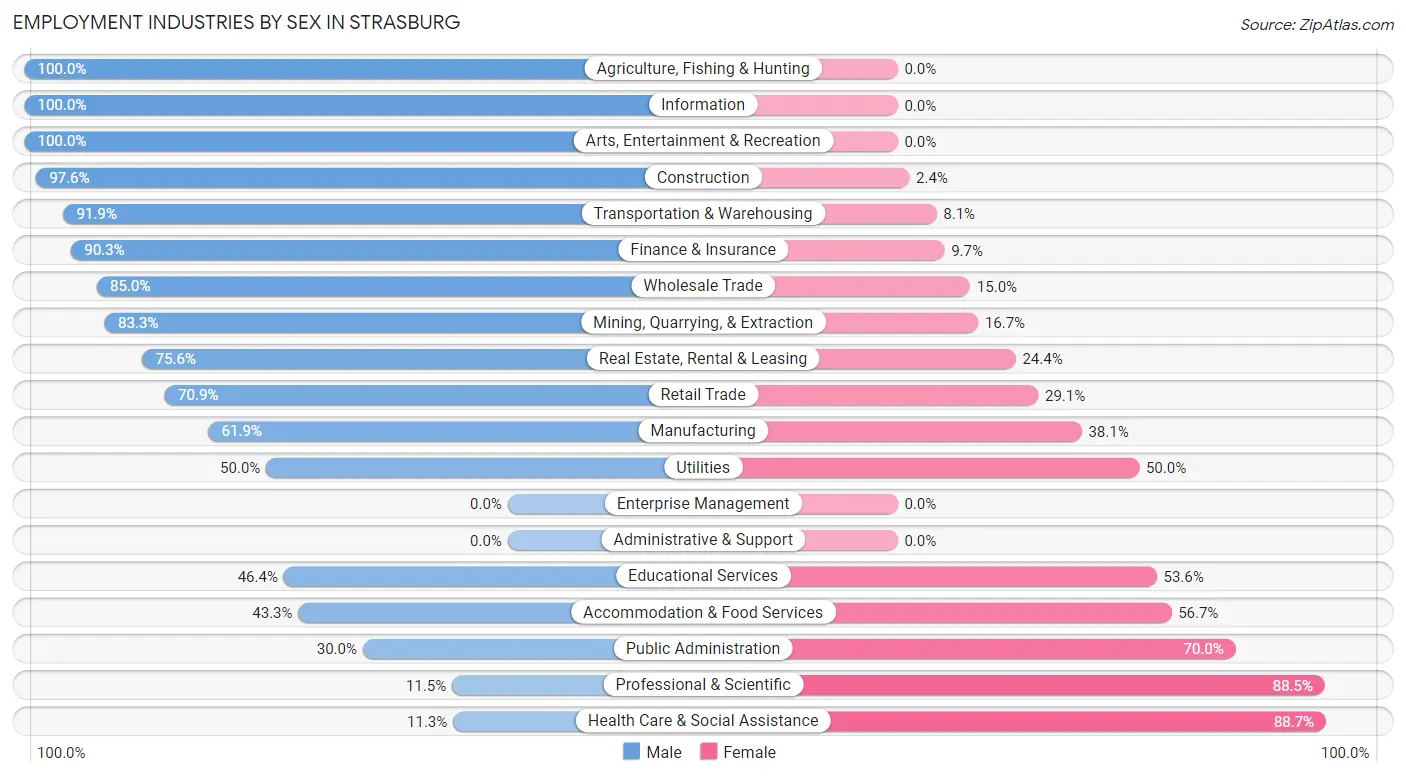
Employment Industries by Sex in Strasburg
The Strasburg industries that see more men than women are Agriculture, Fishing & Hunting (100.0%), Information (100.0%), and Arts, Entertainment & Recreation (100.0%), whereas the industries that tend to have a higher number of women are Health Care & Social Assistance (88.7%), Professional & Scientific (88.5%), and Public Administration (70.0%).
| Industry | Male | Female |
| Agriculture, Fishing & Hunting | 4 (100.0%) | 0 (0.0%) |
| Mining, Quarrying, & Extraction | 20 (83.3%) | 4 (16.7%) |
| Construction | 162 (97.6%) | 4 (2.4%) |
| Manufacturing | 143 (61.9%) | 88 (38.1%) |
| Wholesale Trade | 17 (85.0%) | 3 (15.0%) |
| Retail Trade | 95 (70.9%) | 39 (29.1%) |
| Transportation & Warehousing | 57 (91.9%) | 5 (8.1%) |
| Utilities | 4 (50.0%) | 4 (50.0%) |
| Information | 5 (100.0%) | 0 (0.0%) |
| Finance & Insurance | 28 (90.3%) | 3 (9.7%) |
| Real Estate, Rental & Leasing | 34 (75.6%) | 11 (24.4%) |
| Professional & Scientific | 3 (11.5%) | 23 (88.5%) |
| Enterprise Management | 0 (0.0%) | 0 (0.0%) |
| Administrative & Support | 0 (0.0%) | 0 (0.0%) |
| Educational Services | 51 (46.4%) | 59 (53.6%) |
| Health Care & Social Assistance | 19 (11.3%) | 149 (88.7%) |
| Arts, Entertainment & Recreation | 3 (100.0%) | 0 (0.0%) |
| Accommodation & Food Services | 39 (43.3%) | 51 (56.7%) |
| Public Administration | 6 (30.0%) | 14 (70.0%) |
| Total | 725 (59.8%) | 487 (40.2%) |
Education in Strasburg
School Enrollment in Strasburg
The most common levels of schooling among the 362 students in Strasburg are high school (110 | 30.4%), middle school (86 | 23.8%), and elementary school (54 | 14.9%).
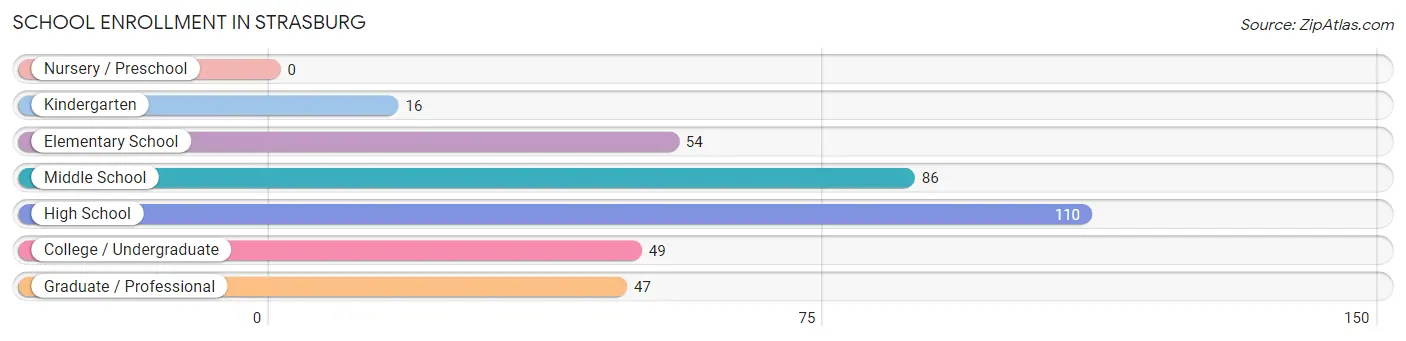
| School Level | # Students | % Students |
| Nursery / Preschool | 0 | 0.0% |
| Kindergarten | 16 | 4.4% |
| Elementary School | 54 | 14.9% |
| Middle School | 86 | 23.8% |
| High School | 110 | 30.4% |
| College / Undergraduate | 49 | 13.5% |
| Graduate / Professional | 47 | 13.0% |
| Total | 362 | 100.0% |
School Enrollment by Age by Funding Source in Strasburg
Out of a total of 362 students who are enrolled in schools in Strasburg, 80 (22.1%) attend a private institution, while the remaining 282 (77.9%) are enrolled in public schools. The age group of 25 to 34 year olds has the highest likelihood of being enrolled in private schools, with 44 (88.0% in the age bracket) enrolled. Conversely, the age group of 18 to 19 year olds has the lowest likelihood of being enrolled in a private school, with 16 (100.0% in the age bracket) attending a public institution.
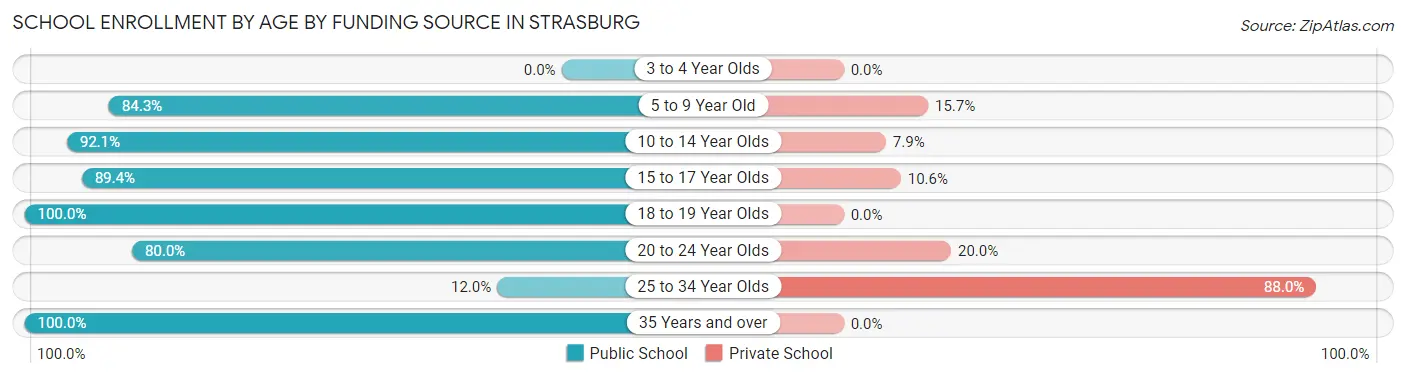
| Age Bracket | Public School | Private School |
| 3 to 4 Year Olds | 0 (0.0%) | 0 (0.0%) |
| 5 to 9 Year Old | 59 (84.3%) | 11 (15.7%) |
| 10 to 14 Year Olds | 82 (92.1%) | 7 (7.9%) |
| 15 to 17 Year Olds | 84 (89.4%) | 10 (10.6%) |
| 18 to 19 Year Olds | 16 (100.0%) | 0 (0.0%) |
| 20 to 24 Year Olds | 32 (80.0%) | 8 (20.0%) |
| 25 to 34 Year Olds | 6 (12.0%) | 44 (88.0%) |
| 35 Years and over | 3 (100.0%) | 0 (0.0%) |
| Total | 282 (77.9%) | 80 (22.1%) |
Educational Attainment by Field of Study in Strasburg
Education (132 | 31.3%), business (106 | 25.1%), science & technology (52 | 12.3%), engineering (27 | 6.4%), and arts & humanities (26 | 6.2%) are the most common fields of study among 422 individuals in Strasburg who have obtained a bachelor's degree or higher.
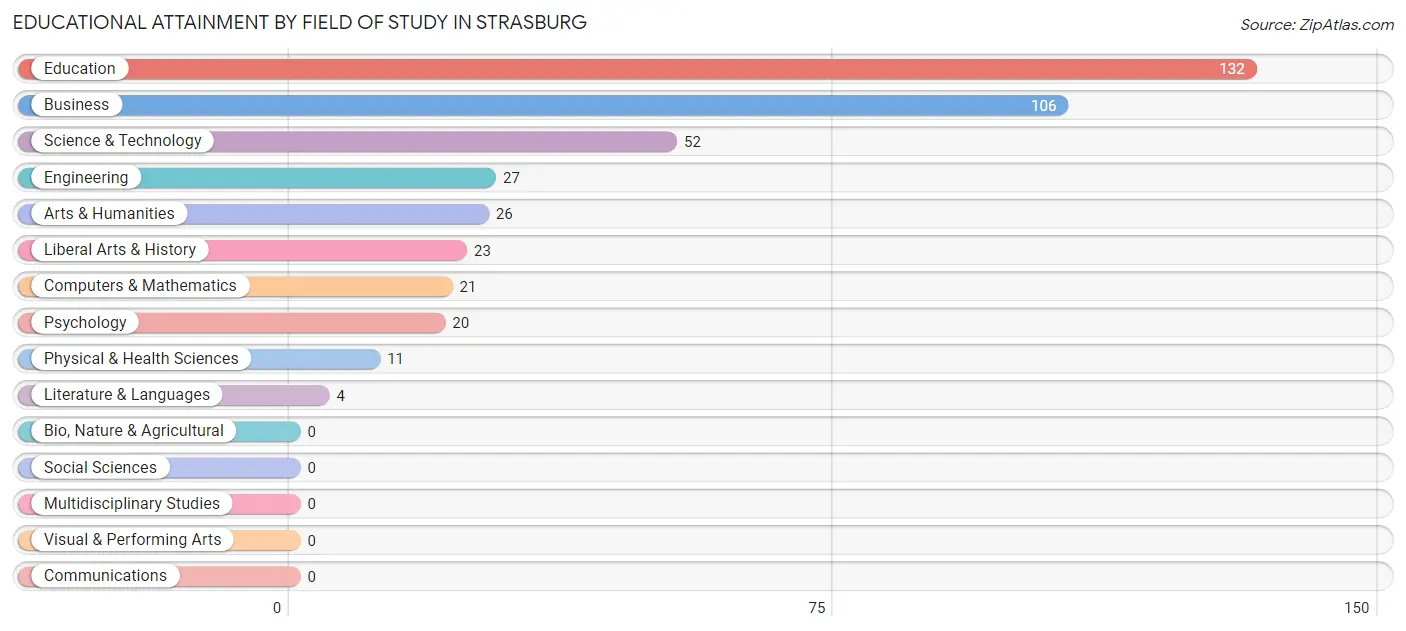
| Field of Study | # Graduates | % Graduates |
| Computers & Mathematics | 21 | 5.0% |
| Bio, Nature & Agricultural | 0 | 0.0% |
| Physical & Health Sciences | 11 | 2.6% |
| Psychology | 20 | 4.7% |
| Social Sciences | 0 | 0.0% |
| Engineering | 27 | 6.4% |
| Multidisciplinary Studies | 0 | 0.0% |
| Science & Technology | 52 | 12.3% |
| Business | 106 | 25.1% |
| Education | 132 | 31.3% |
| Literature & Languages | 4 | 0.9% |
| Liberal Arts & History | 23 | 5.4% |
| Visual & Performing Arts | 0 | 0.0% |
| Communications | 0 | 0.0% |
| Arts & Humanities | 26 | 6.2% |
| Total | 422 | 100.0% |
Transportation & Commute in Strasburg
Vehicle Availability by Sex in Strasburg
The most prevalent vehicle ownership categories in Strasburg are males with 2 vehicles (284, accounting for 40.1%) and females with 2 vehicles (189, making up 59.3%).
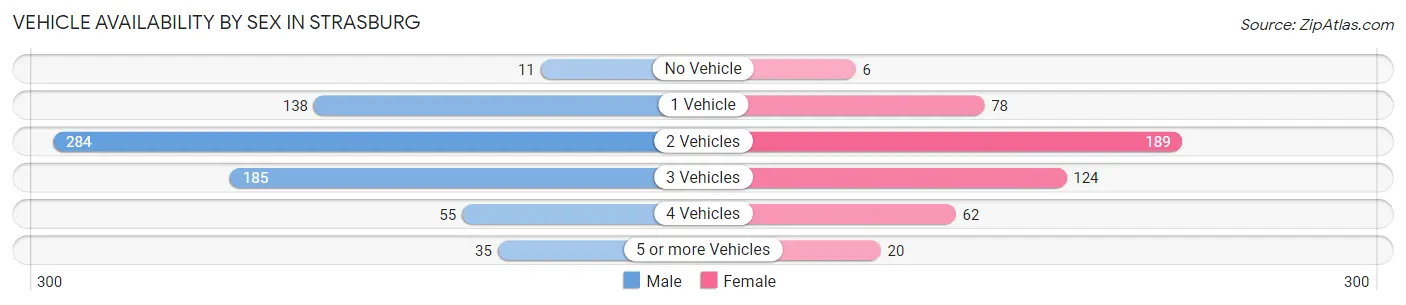
| Vehicles Available | Male | Female |
| No Vehicle | 11 (1.5%) | 6 (1.3%) |
| 1 Vehicle | 138 (19.5%) | 78 (16.3%) |
| 2 Vehicles | 284 (40.1%) | 189 (39.5%) |
| 3 Vehicles | 185 (26.1%) | 124 (25.9%) |
| 4 Vehicles | 55 (7.8%) | 62 (12.9%) |
| 5 or more Vehicles | 35 (4.9%) | 20 (4.2%) |
| Total | 708 (100.0%) | 479 (100.0%) |
Commute Time in Strasburg
The most frequently occuring commute durations in Strasburg are 15 to 19 minutes (203 commuters, 17.8%), 30 to 34 minutes (176 commuters, 15.5%), and 10 to 14 minutes (136 commuters, 11.9%).
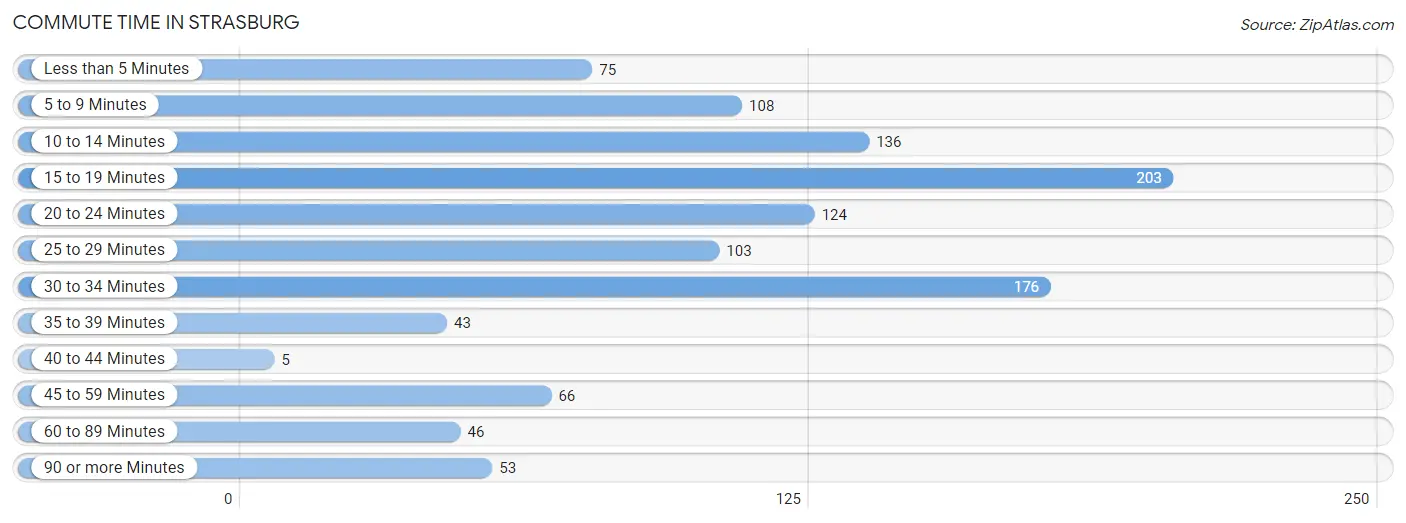
| Commute Time | # Commuters | % Commuters |
| Less than 5 Minutes | 75 | 6.6% |
| 5 to 9 Minutes | 108 | 9.5% |
| 10 to 14 Minutes | 136 | 11.9% |
| 15 to 19 Minutes | 203 | 17.8% |
| 20 to 24 Minutes | 124 | 10.9% |
| 25 to 29 Minutes | 103 | 9.0% |
| 30 to 34 Minutes | 176 | 15.5% |
| 35 to 39 Minutes | 43 | 3.8% |
| 40 to 44 Minutes | 5 | 0.4% |
| 45 to 59 Minutes | 66 | 5.8% |
| 60 to 89 Minutes | 46 | 4.0% |
| 90 or more Minutes | 53 | 4.7% |
Commute Time by Sex in Strasburg
The most common commute times in Strasburg are 10 to 14 minutes (116 commuters, 16.7%) for males and 15 to 19 minutes (102 commuters, 23.1%) for females.
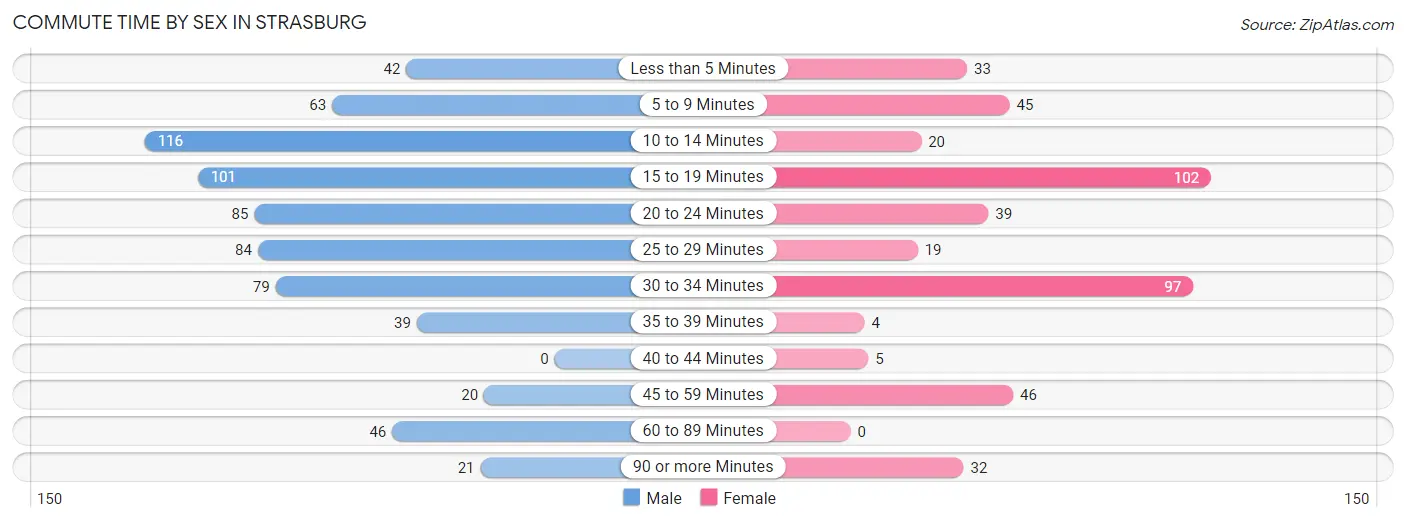
| Commute Time | Male | Female |
| Less than 5 Minutes | 42 (6.0%) | 33 (7.5%) |
| 5 to 9 Minutes | 63 (9.0%) | 45 (10.2%) |
| 10 to 14 Minutes | 116 (16.7%) | 20 (4.5%) |
| 15 to 19 Minutes | 101 (14.5%) | 102 (23.1%) |
| 20 to 24 Minutes | 85 (12.2%) | 39 (8.8%) |
| 25 to 29 Minutes | 84 (12.1%) | 19 (4.3%) |
| 30 to 34 Minutes | 79 (11.4%) | 97 (22.0%) |
| 35 to 39 Minutes | 39 (5.6%) | 4 (0.9%) |
| 40 to 44 Minutes | 0 (0.0%) | 5 (1.1%) |
| 45 to 59 Minutes | 20 (2.9%) | 46 (10.4%) |
| 60 to 89 Minutes | 46 (6.6%) | 0 (0.0%) |
| 90 or more Minutes | 21 (3.0%) | 32 (7.2%) |
Time of Departure to Work by Sex in Strasburg
The most frequent times of departure to work in Strasburg are 6:30 AM to 6:59 AM (159, 22.8%) for males and 12:00 PM to 3:59 PM (90, 20.4%) for females.
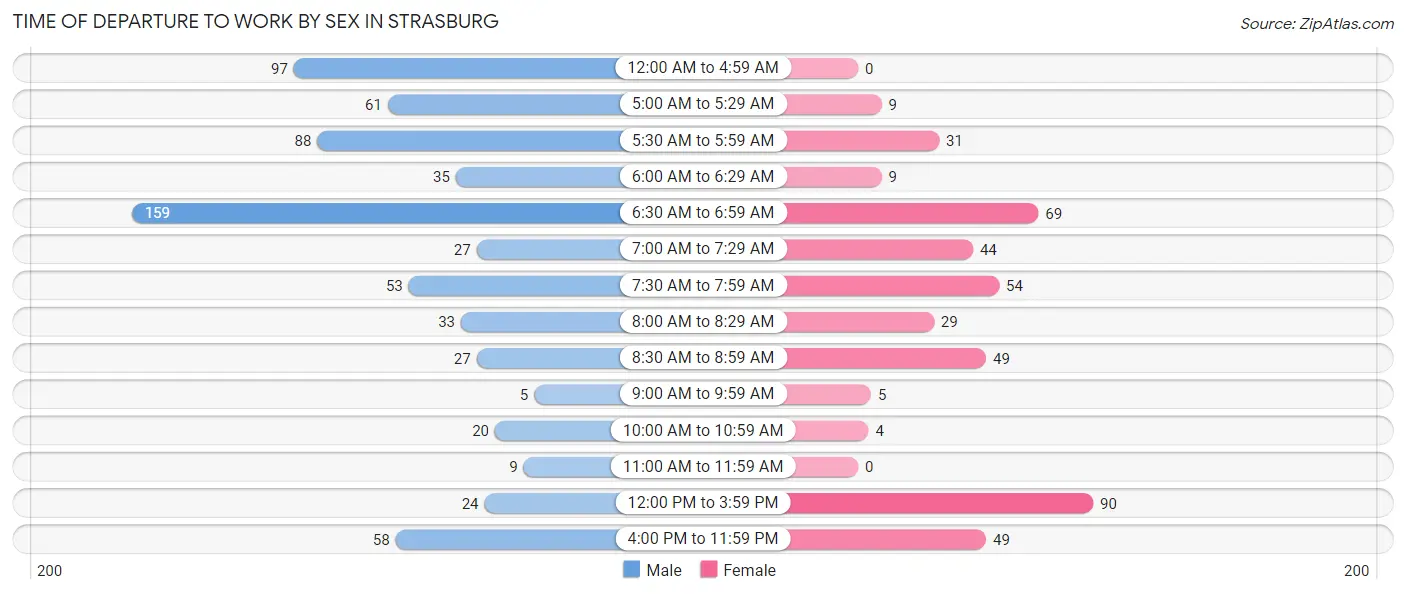
| Time of Departure | Male | Female |
| 12:00 AM to 4:59 AM | 97 (13.9%) | 0 (0.0%) |
| 5:00 AM to 5:29 AM | 61 (8.8%) | 9 (2.0%) |
| 5:30 AM to 5:59 AM | 88 (12.6%) | 31 (7.0%) |
| 6:00 AM to 6:29 AM | 35 (5.0%) | 9 (2.0%) |
| 6:30 AM to 6:59 AM | 159 (22.8%) | 69 (15.6%) |
| 7:00 AM to 7:29 AM | 27 (3.9%) | 44 (10.0%) |
| 7:30 AM to 7:59 AM | 53 (7.6%) | 54 (12.2%) |
| 8:00 AM to 8:29 AM | 33 (4.7%) | 29 (6.6%) |
| 8:30 AM to 8:59 AM | 27 (3.9%) | 49 (11.1%) |
| 9:00 AM to 9:59 AM | 5 (0.7%) | 5 (1.1%) |
| 10:00 AM to 10:59 AM | 20 (2.9%) | 4 (0.9%) |
| 11:00 AM to 11:59 AM | 9 (1.3%) | 0 (0.0%) |
| 12:00 PM to 3:59 PM | 24 (3.5%) | 90 (20.4%) |
| 4:00 PM to 11:59 PM | 58 (8.3%) | 49 (11.1%) |
| Total | 696 (100.0%) | 442 (100.0%) |
Housing Occupancy in Strasburg
Occupancy by Ownership in Strasburg
Of the total 1,086 dwellings in Strasburg, owner-occupied units account for 671 (61.8%), while renter-occupied units make up 415 (38.2%).
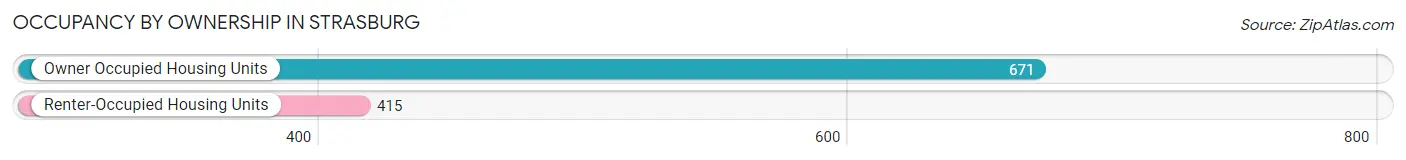
| Occupancy | # Housing Units | % Housing Units |
| Owner Occupied Housing Units | 671 | 61.8% |
| Renter-Occupied Housing Units | 415 | 38.2% |
| Total Occupied Housing Units | 1,086 | 100.0% |
Occupancy by Household Size in Strasburg
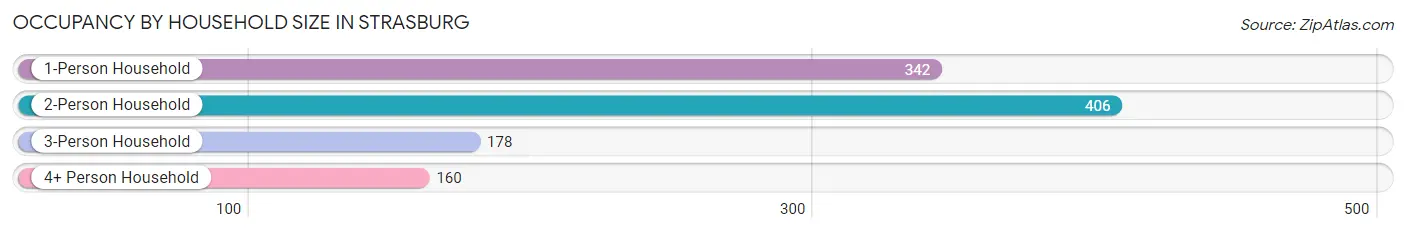
| Household Size | # Housing Units | % Housing Units |
| 1-Person Household | 342 | 31.5% |
| 2-Person Household | 406 | 37.4% |
| 3-Person Household | 178 | 16.4% |
| 4+ Person Household | 160 | 14.7% |
| Total Housing Units | 1,086 | 100.0% |
Occupancy by Ownership by Household Size in Strasburg
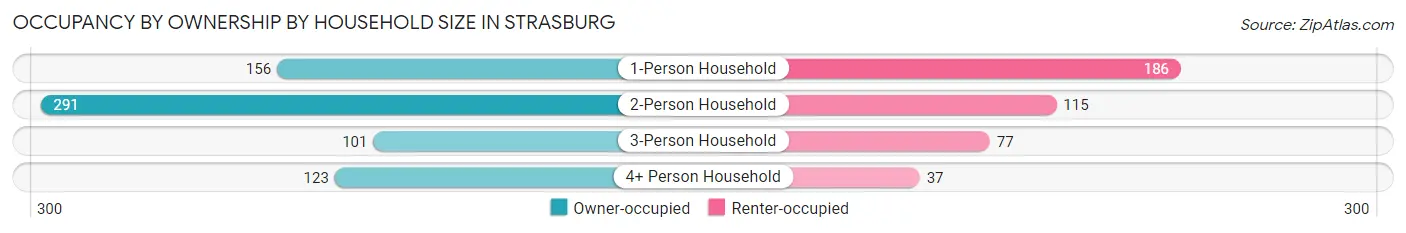
| Household Size | Owner-occupied | Renter-occupied |
| 1-Person Household | 156 (45.6%) | 186 (54.4%) |
| 2-Person Household | 291 (71.7%) | 115 (28.3%) |
| 3-Person Household | 101 (56.7%) | 77 (43.3%) |
| 4+ Person Household | 123 (76.9%) | 37 (23.1%) |
| Total Housing Units | 671 (61.8%) | 415 (38.2%) |
Occupancy by Educational Attainment in Strasburg
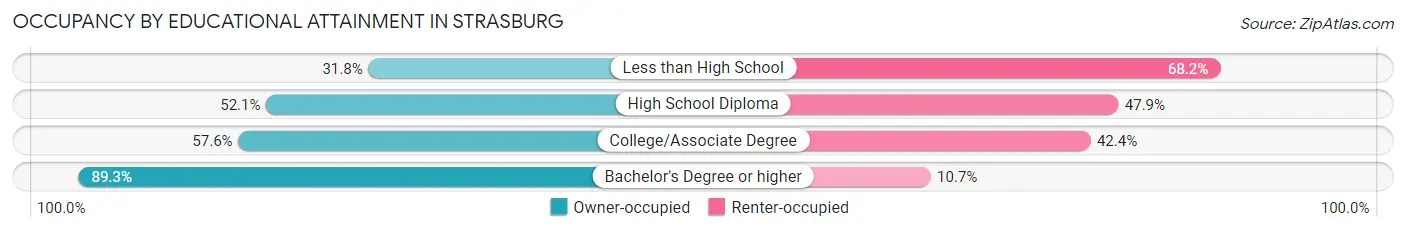
| Household Size | Owner-occupied | Renter-occupied |
| Less than High School | 14 (31.8%) | 30 (68.2%) |
| High School Diploma | 275 (52.1%) | 253 (47.9%) |
| College/Associate Degree | 140 (57.6%) | 103 (42.4%) |
| Bachelor's Degree or higher | 242 (89.3%) | 29 (10.7%) |
Occupancy by Age of Householder in Strasburg
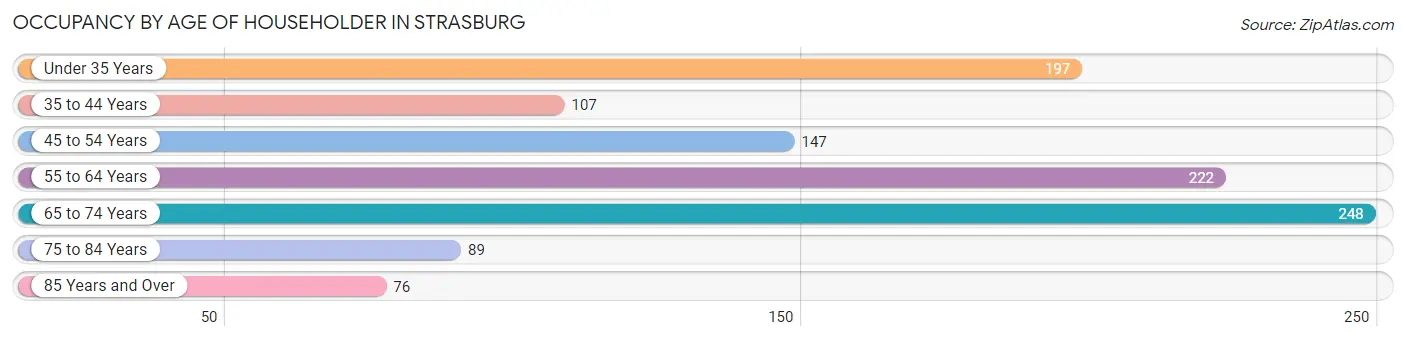
| Age Bracket | # Households | % Households |
| Under 35 Years | 197 | 18.1% |
| 35 to 44 Years | 107 | 9.9% |
| 45 to 54 Years | 147 | 13.5% |
| 55 to 64 Years | 222 | 20.4% |
| 65 to 74 Years | 248 | 22.8% |
| 75 to 84 Years | 89 | 8.2% |
| 85 Years and Over | 76 | 7.0% |
| Total | 1,086 | 100.0% |
Housing Finances in Strasburg
Median Income by Occupancy in Strasburg
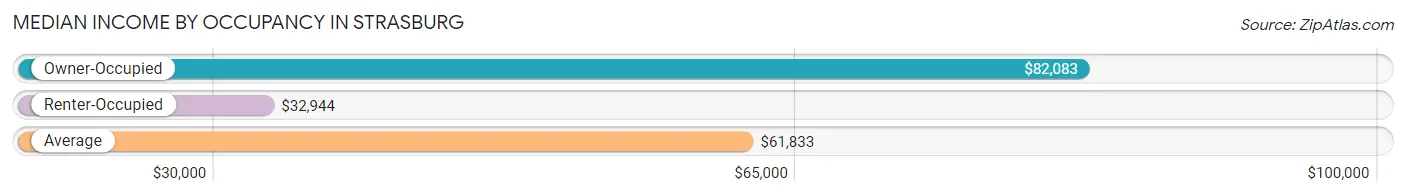
| Occupancy Type | # Households | Median Income |
| Owner-Occupied | 671 (61.8%) | $82,083 |
| Renter-Occupied | 415 (38.2%) | $32,944 |
| Average | 1,086 (100.0%) | $61,833 |
Occupancy by Householder Income Bracket in Strasburg
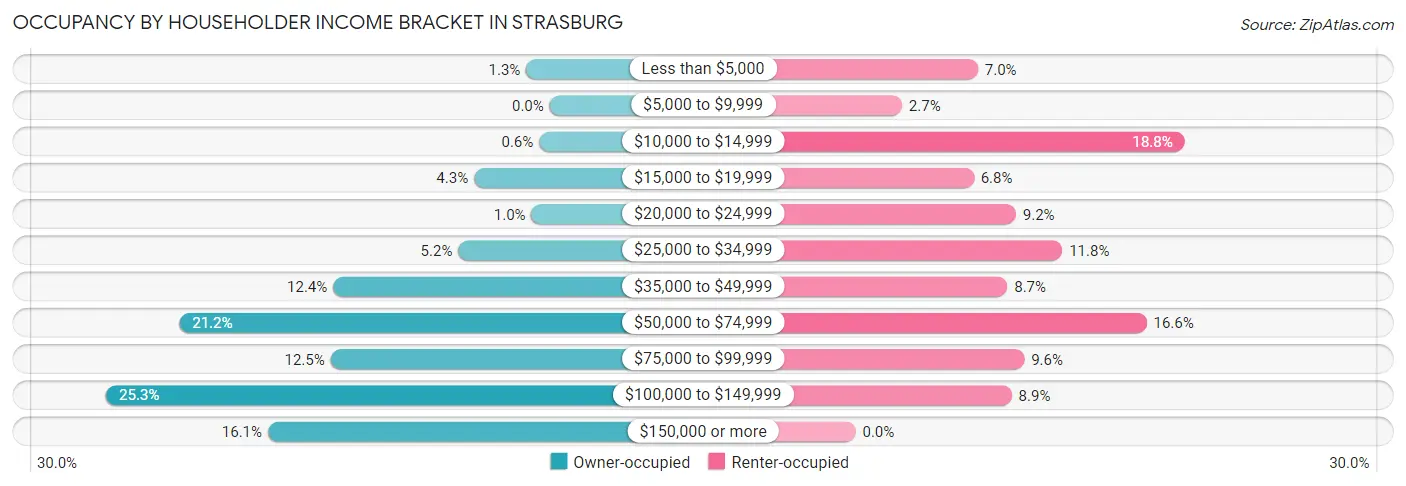
| Income Bracket | Owner-occupied | Renter-occupied |
| Less than $5,000 | 9 (1.3%) | 29 (7.0%) |
| $5,000 to $9,999 | 0 (0.0%) | 11 (2.6%) |
| $10,000 to $14,999 | 4 (0.6%) | 78 (18.8%) |
| $15,000 to $19,999 | 29 (4.3%) | 28 (6.8%) |
| $20,000 to $24,999 | 7 (1.0%) | 38 (9.2%) |
| $25,000 to $34,999 | 35 (5.2%) | 49 (11.8%) |
| $35,000 to $49,999 | 83 (12.4%) | 36 (8.7%) |
| $50,000 to $74,999 | 142 (21.2%) | 69 (16.6%) |
| $75,000 to $99,999 | 84 (12.5%) | 40 (9.6%) |
| $100,000 to $149,999 | 170 (25.3%) | 37 (8.9%) |
| $150,000 or more | 108 (16.1%) | 0 (0.0%) |
| Total | 671 (100.0%) | 415 (100.0%) |
Monthly Housing Cost Tiers in Strasburg
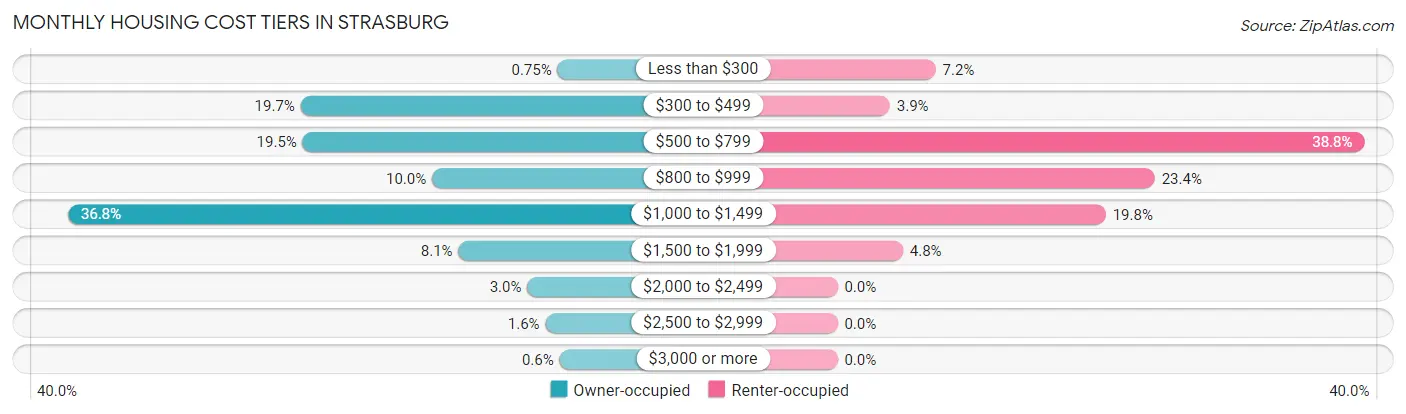
| Monthly Cost | Owner-occupied | Renter-occupied |
| Less than $300 | 5 (0.7%) | 30 (7.2%) |
| $300 to $499 | 132 (19.7%) | 16 (3.9%) |
| $500 to $799 | 131 (19.5%) | 161 (38.8%) |
| $800 to $999 | 67 (10.0%) | 97 (23.4%) |
| $1,000 to $1,499 | 247 (36.8%) | 82 (19.8%) |
| $1,500 to $1,999 | 54 (8.1%) | 20 (4.8%) |
| $2,000 to $2,499 | 20 (3.0%) | 0 (0.0%) |
| $2,500 to $2,999 | 11 (1.6%) | 0 (0.0%) |
| $3,000 or more | 4 (0.6%) | 0 (0.0%) |
| Total | 671 (100.0%) | 415 (100.0%) |
Physical Housing Characteristics in Strasburg
Housing Structures in Strasburg
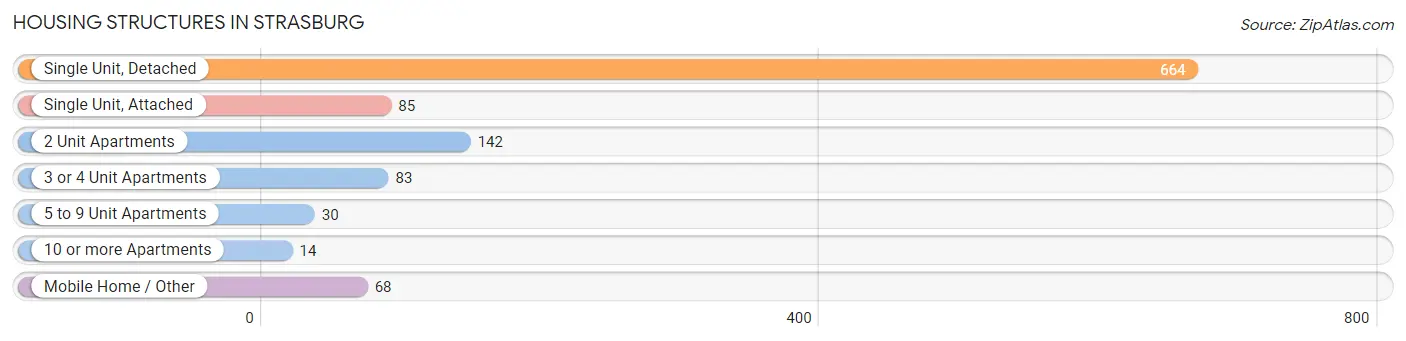
| Structure Type | # Housing Units | % Housing Units |
| Single Unit, Detached | 664 | 61.1% |
| Single Unit, Attached | 85 | 7.8% |
| 2 Unit Apartments | 142 | 13.1% |
| 3 or 4 Unit Apartments | 83 | 7.6% |
| 5 to 9 Unit Apartments | 30 | 2.8% |
| 10 or more Apartments | 14 | 1.3% |
| Mobile Home / Other | 68 | 6.3% |
| Total | 1,086 | 100.0% |
Housing Structures by Occupancy in Strasburg
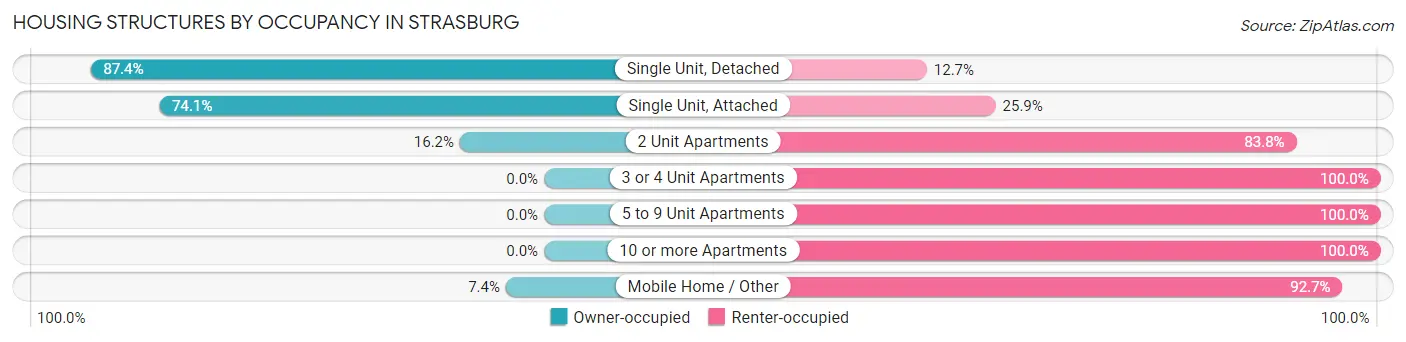
| Structure Type | Owner-occupied | Renter-occupied |
| Single Unit, Detached | 580 (87.4%) | 84 (12.7%) |
| Single Unit, Attached | 63 (74.1%) | 22 (25.9%) |
| 2 Unit Apartments | 23 (16.2%) | 119 (83.8%) |
| 3 or 4 Unit Apartments | 0 (0.0%) | 83 (100.0%) |
| 5 to 9 Unit Apartments | 0 (0.0%) | 30 (100.0%) |
| 10 or more Apartments | 0 (0.0%) | 14 (100.0%) |
| Mobile Home / Other | 5 (7.3%) | 63 (92.6%) |
| Total | 671 (61.8%) | 415 (38.2%) |
Housing Structures by Number of Rooms in Strasburg
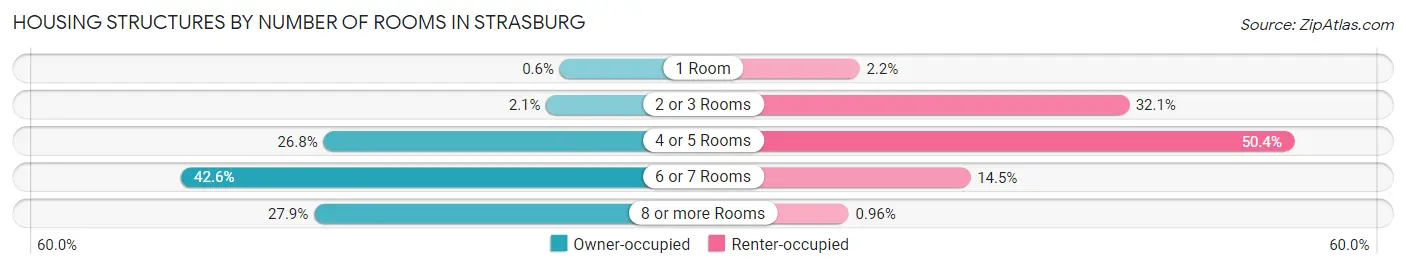
| Number of Rooms | Owner-occupied | Renter-occupied |
| 1 Room | 4 (0.6%) | 9 (2.2%) |
| 2 or 3 Rooms | 14 (2.1%) | 133 (32.1%) |
| 4 or 5 Rooms | 180 (26.8%) | 209 (50.4%) |
| 6 or 7 Rooms | 286 (42.6%) | 60 (14.5%) |
| 8 or more Rooms | 187 (27.9%) | 4 (1.0%) |
| Total | 671 (100.0%) | 415 (100.0%) |
Housing Structure by Heating Type in Strasburg
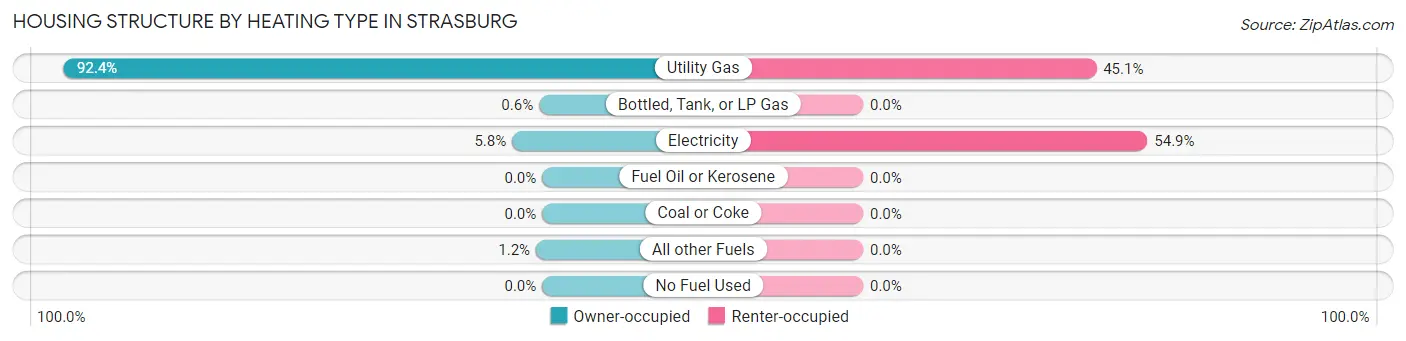
| Heating Type | Owner-occupied | Renter-occupied |
| Utility Gas | 620 (92.4%) | 187 (45.1%) |
| Bottled, Tank, or LP Gas | 4 (0.6%) | 0 (0.0%) |
| Electricity | 39 (5.8%) | 228 (54.9%) |
| Fuel Oil or Kerosene | 0 (0.0%) | 0 (0.0%) |
| Coal or Coke | 0 (0.0%) | 0 (0.0%) |
| All other Fuels | 8 (1.2%) | 0 (0.0%) |
| No Fuel Used | 0 (0.0%) | 0 (0.0%) |
| Total | 671 (100.0%) | 415 (100.0%) |
Household Vehicle Usage in Strasburg
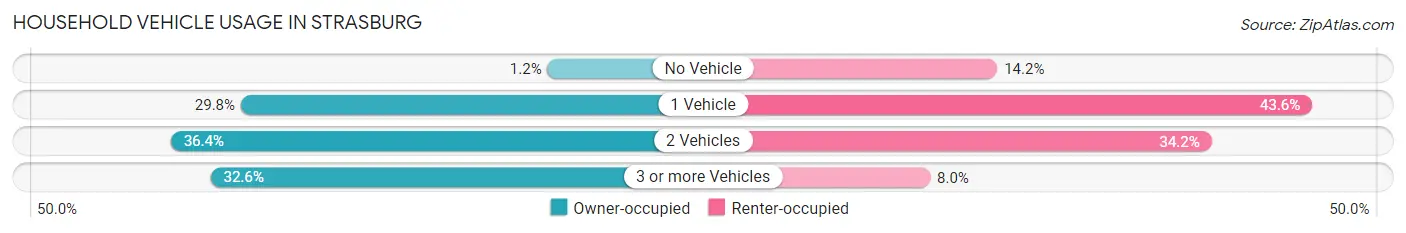
| Vehicles per Household | Owner-occupied | Renter-occupied |
| No Vehicle | 8 (1.2%) | 59 (14.2%) |
| 1 Vehicle | 200 (29.8%) | 181 (43.6%) |
| 2 Vehicles | 244 (36.4%) | 142 (34.2%) |
| 3 or more Vehicles | 219 (32.6%) | 33 (8.0%) |
| Total | 671 (100.0%) | 415 (100.0%) |
Real Estate & Mortgages in Strasburg
Real Estate and Mortgage Overview in Strasburg
| Characteristic | Without Mortgage | With Mortgage |
| Housing Units | 256 | 415 |
| Median Property Value | $169,800 | $175,900 |
| Median Household Income | $67,625 | $77 |
| Monthly Housing Costs | $503 | $0 |
| Real Estate Taxes | $2,067 | $7 |
Property Value by Mortgage Status in Strasburg
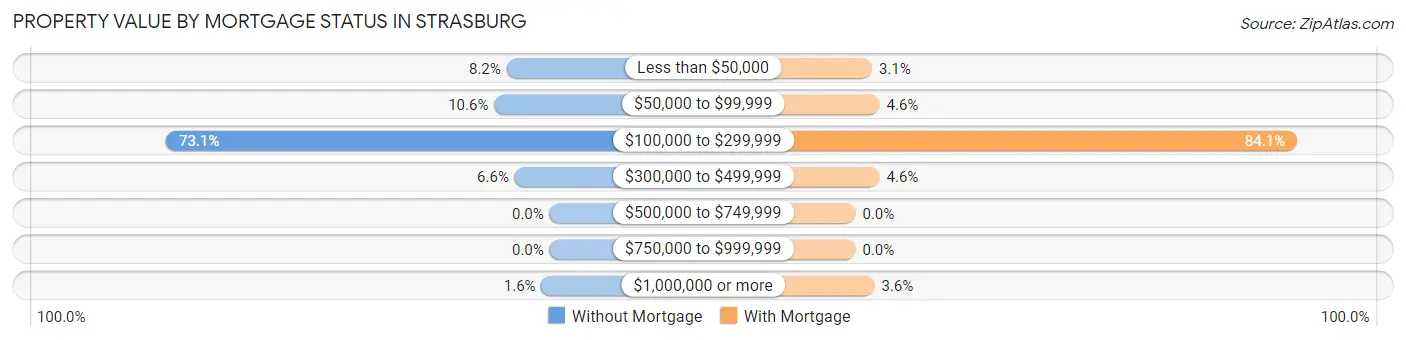
| Property Value | Without Mortgage | With Mortgage |
| Less than $50,000 | 21 (8.2%) | 13 (3.1%) |
| $50,000 to $99,999 | 27 (10.5%) | 19 (4.6%) |
| $100,000 to $299,999 | 187 (73.1%) | 349 (84.1%) |
| $300,000 to $499,999 | 17 (6.6%) | 19 (4.6%) |
| $500,000 to $749,999 | 0 (0.0%) | 0 (0.0%) |
| $750,000 to $999,999 | 0 (0.0%) | 0 (0.0%) |
| $1,000,000 or more | 4 (1.6%) | 15 (3.6%) |
| Total | 256 (100.0%) | 415 (100.0%) |
Household Income by Mortgage Status in Strasburg
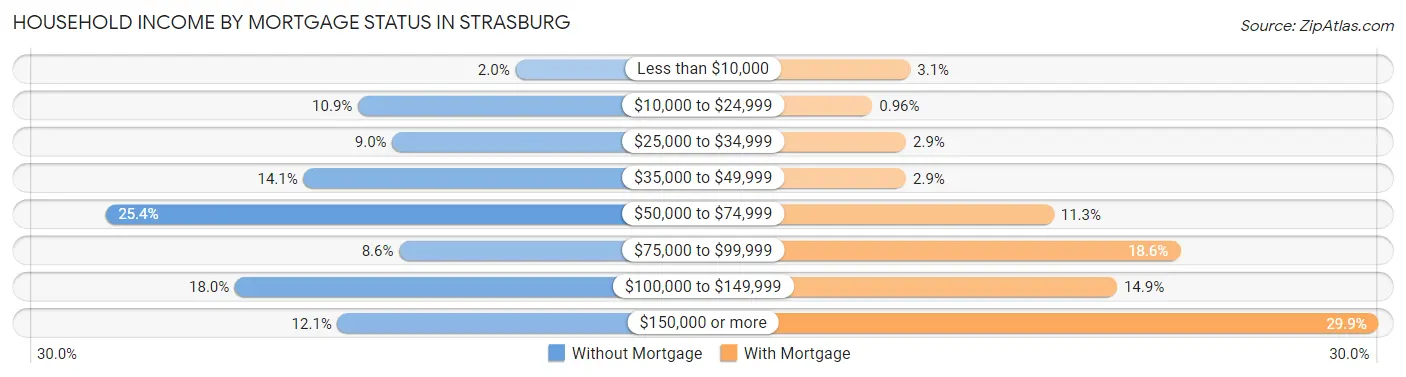
| Household Income | Without Mortgage | With Mortgage |
| Less than $10,000 | 5 (1.9%) | 13 (3.1%) |
| $10,000 to $24,999 | 28 (10.9%) | 4 (1.0%) |
| $25,000 to $34,999 | 23 (9.0%) | 12 (2.9%) |
| $35,000 to $49,999 | 36 (14.1%) | 12 (2.9%) |
| $50,000 to $74,999 | 65 (25.4%) | 47 (11.3%) |
| $75,000 to $99,999 | 22 (8.6%) | 77 (18.5%) |
| $100,000 to $149,999 | 46 (18.0%) | 62 (14.9%) |
| $150,000 or more | 31 (12.1%) | 124 (29.9%) |
| Total | 256 (100.0%) | 415 (100.0%) |
Property Value to Household Income Ratio in Strasburg
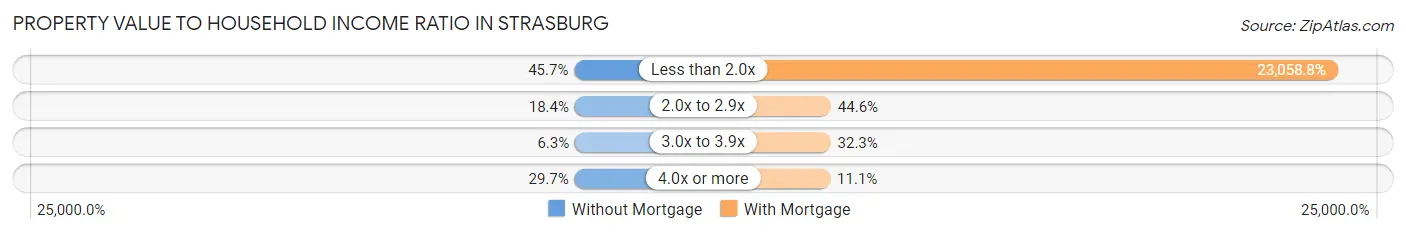
| Value-to-Income Ratio | Without Mortgage | With Mortgage |
| Less than 2.0x | 117 (45.7%) | 95,694 (23,058.8%) |
| 2.0x to 2.9x | 47 (18.4%) | 185 (44.6%) |
| 3.0x to 3.9x | 16 (6.2%) | 134 (32.3%) |
| 4.0x or more | 76 (29.7%) | 46 (11.1%) |
| Total | 256 (100.0%) | 415 (100.0%) |
Real Estate Taxes by Mortgage Status in Strasburg
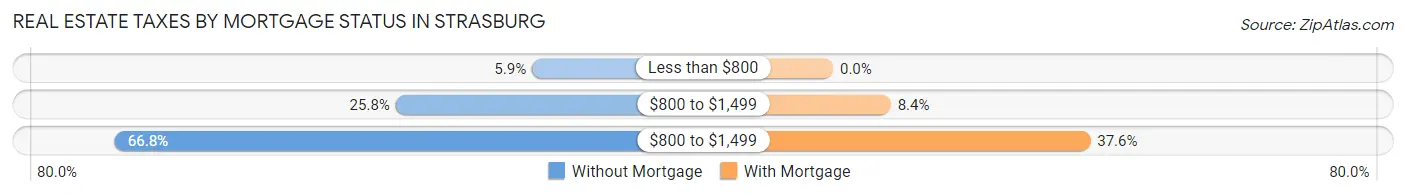
| Property Taxes | Without Mortgage | With Mortgage |
| Less than $800 | 15 (5.9%) | 0 (0.0%) |
| $800 to $1,499 | 66 (25.8%) | 35 (8.4%) |
| $800 to $1,499 | 171 (66.8%) | 156 (37.6%) |
| Total | 256 (100.0%) | 415 (100.0%) |
Health & Disability in Strasburg
Health Insurance Coverage by Age in Strasburg
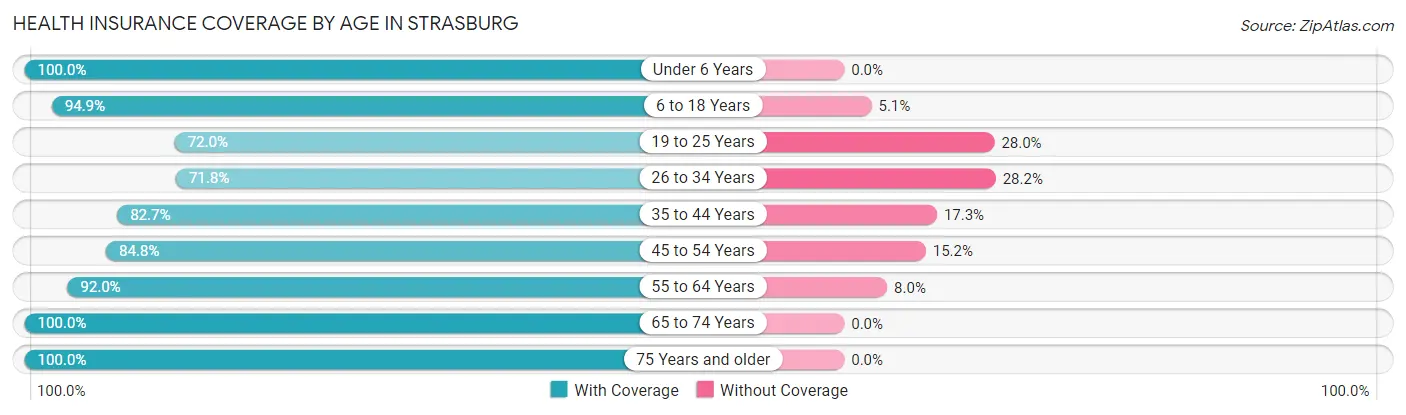
| Age Bracket | With Coverage | Without Coverage |
| Under 6 Years | 271 (100.0%) | 0 (0.0%) |
| 6 to 18 Years | 243 (94.9%) | 13 (5.1%) |
| 19 to 25 Years | 144 (72.0%) | 56 (28.0%) |
| 26 to 34 Years | 249 (71.8%) | 98 (28.2%) |
| 35 to 44 Years | 158 (82.7%) | 33 (17.3%) |
| 45 to 54 Years | 279 (84.8%) | 50 (15.2%) |
| 55 to 64 Years | 334 (92.0%) | 29 (8.0%) |
| 65 to 74 Years | 396 (100.0%) | 0 (0.0%) |
| 75 Years and older | 228 (100.0%) | 0 (0.0%) |
| Total | 2,302 (89.2%) | 279 (10.8%) |
Health Insurance Coverage by Citizenship Status in Strasburg
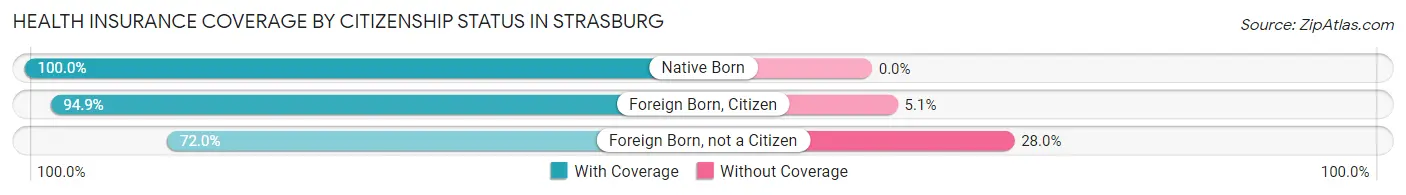
| Citizenship Status | With Coverage | Without Coverage |
| Native Born | 271 (100.0%) | 0 (0.0%) |
| Foreign Born, Citizen | 243 (94.9%) | 13 (5.1%) |
| Foreign Born, not a Citizen | 144 (72.0%) | 56 (28.0%) |
Health Insurance Coverage by Household Income in Strasburg
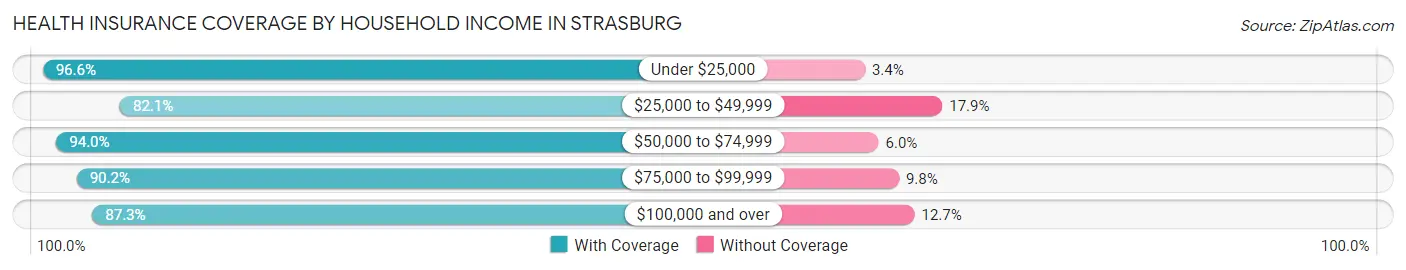
| Household Income | With Coverage | Without Coverage |
| Under $25,000 | 313 (96.6%) | 11 (3.4%) |
| $25,000 to $49,999 | 312 (82.1%) | 68 (17.9%) |
| $50,000 to $74,999 | 410 (94.0%) | 26 (6.0%) |
| $75,000 to $99,999 | 277 (90.2%) | 30 (9.8%) |
| $100,000 and over | 990 (87.3%) | 144 (12.7%) |
Public vs Private Health Insurance Coverage by Age in Strasburg
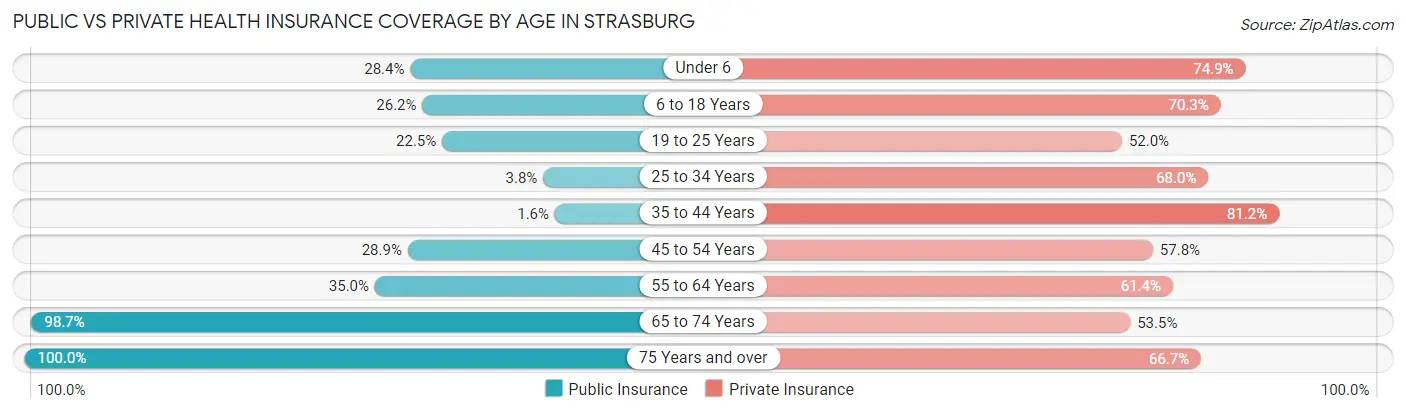
| Age Bracket | Public Insurance | Private Insurance |
| Under 6 | 77 (28.4%) | 203 (74.9%) |
| 6 to 18 Years | 67 (26.2%) | 180 (70.3%) |
| 19 to 25 Years | 45 (22.5%) | 104 (52.0%) |
| 25 to 34 Years | 13 (3.7%) | 236 (68.0%) |
| 35 to 44 Years | 3 (1.6%) | 155 (81.1%) |
| 45 to 54 Years | 95 (28.9%) | 190 (57.8%) |
| 55 to 64 Years | 127 (35.0%) | 223 (61.4%) |
| 65 to 74 Years | 391 (98.7%) | 212 (53.5%) |
| 75 Years and over | 228 (100.0%) | 152 (66.7%) |
| Total | 1,046 (40.5%) | 1,655 (64.1%) |
Disability Status by Sex by Age in Strasburg
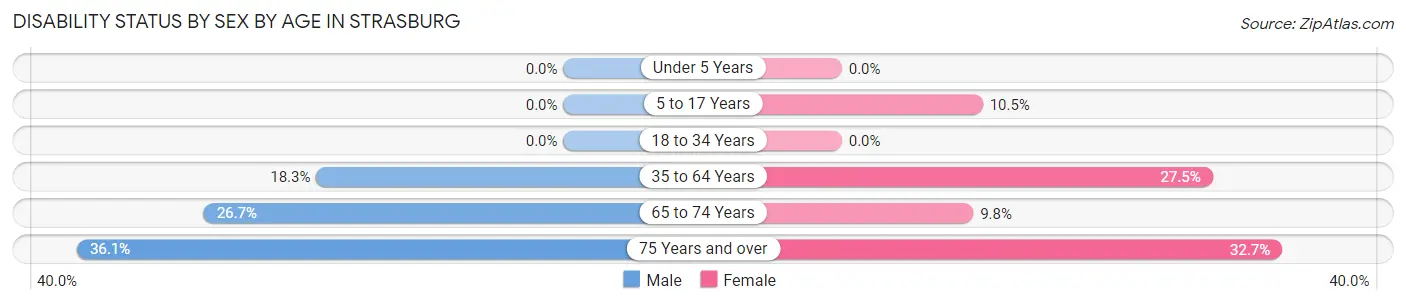
| Age Bracket | Male | Female |
| Under 5 Years | 0 (0.0%) | 0 (0.0%) |
| 5 to 17 Years | 0 (0.0%) | 16 (10.5%) |
| 18 to 34 Years | 0 (0.0%) | 0 (0.0%) |
| 35 to 64 Years | 84 (18.3%) | 117 (27.5%) |
| 65 to 74 Years | 51 (26.7%) | 20 (9.8%) |
| 75 Years and over | 26 (36.1%) | 51 (32.7%) |
Disability Class by Sex by Age in Strasburg
Disability Class: Hearing Difficulty
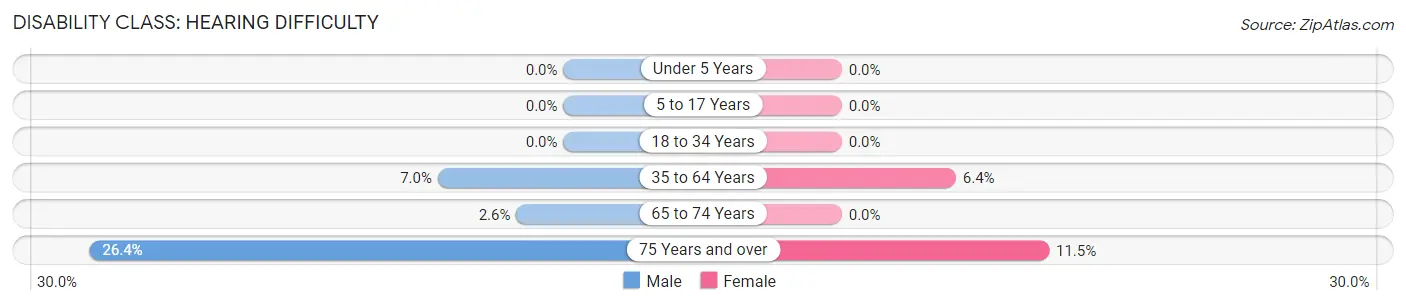
| Age Bracket | Male | Female |
| Under 5 Years | 0 (0.0%) | 0 (0.0%) |
| 5 to 17 Years | 0 (0.0%) | 0 (0.0%) |
| 18 to 34 Years | 0 (0.0%) | 0 (0.0%) |
| 35 to 64 Years | 32 (7.0%) | 27 (6.4%) |
| 65 to 74 Years | 5 (2.6%) | 0 (0.0%) |
| 75 Years and over | 19 (26.4%) | 18 (11.5%) |
Disability Class: Vision Difficulty
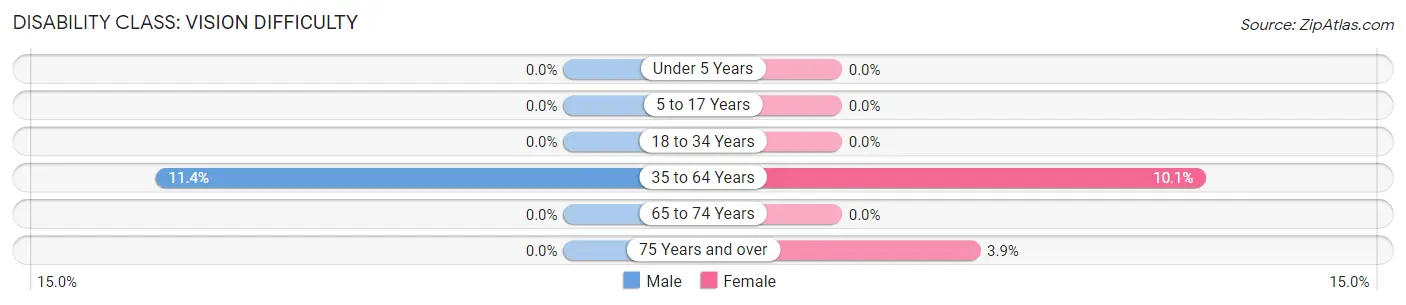
| Age Bracket | Male | Female |
| Under 5 Years | 0 (0.0%) | 0 (0.0%) |
| 5 to 17 Years | 0 (0.0%) | 0 (0.0%) |
| 18 to 34 Years | 0 (0.0%) | 0 (0.0%) |
| 35 to 64 Years | 52 (11.4%) | 43 (10.1%) |
| 65 to 74 Years | 0 (0.0%) | 0 (0.0%) |
| 75 Years and over | 0 (0.0%) | 6 (3.8%) |
Disability Class: Cognitive Difficulty
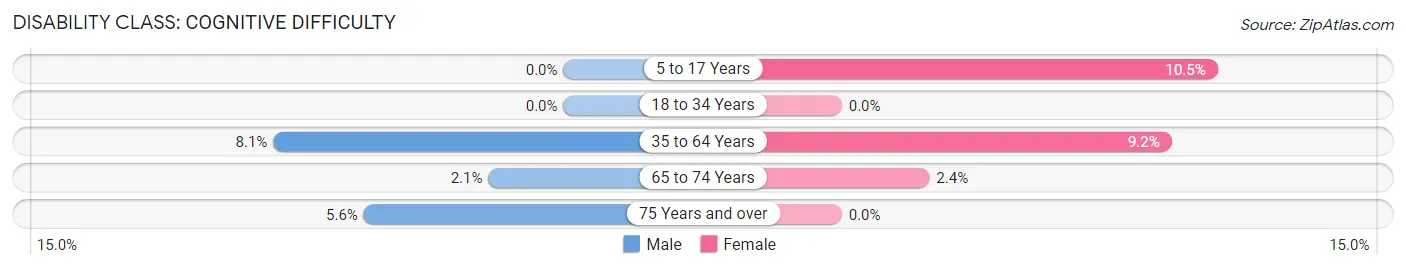
| Age Bracket | Male | Female |
| 5 to 17 Years | 0 (0.0%) | 16 (10.5%) |
| 18 to 34 Years | 0 (0.0%) | 0 (0.0%) |
| 35 to 64 Years | 37 (8.1%) | 39 (9.2%) |
| 65 to 74 Years | 4 (2.1%) | 5 (2.4%) |
| 75 Years and over | 4 (5.6%) | 0 (0.0%) |
Disability Class: Ambulatory Difficulty
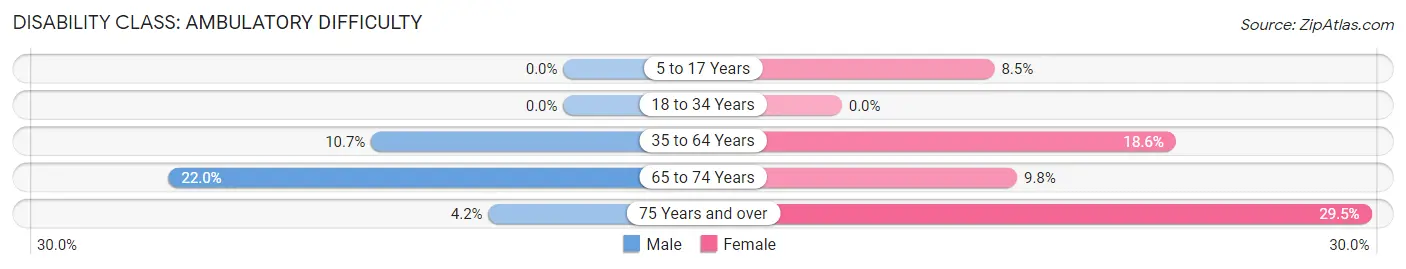
| Age Bracket | Male | Female |
| 5 to 17 Years | 0 (0.0%) | 13 (8.5%) |
| 18 to 34 Years | 0 (0.0%) | 0 (0.0%) |
| 35 to 64 Years | 49 (10.7%) | 79 (18.6%) |
| 65 to 74 Years | 42 (22.0%) | 20 (9.8%) |
| 75 Years and over | 3 (4.2%) | 46 (29.5%) |
Disability Class: Self-Care Difficulty
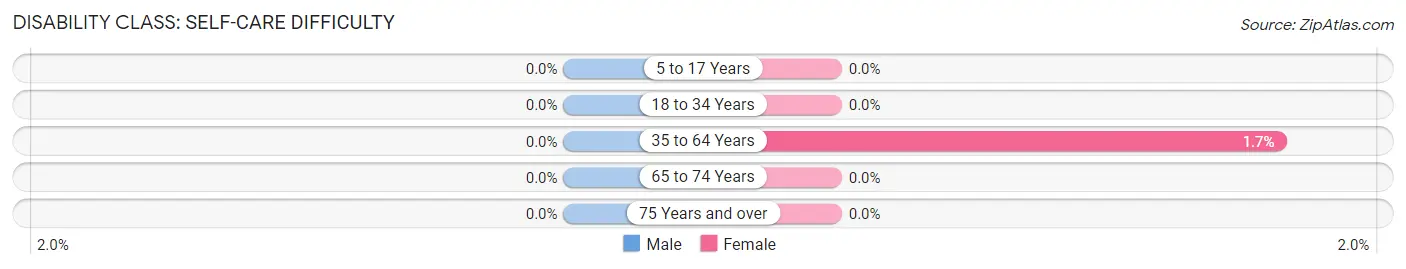
| Age Bracket | Male | Female |
| 5 to 17 Years | 0 (0.0%) | 0 (0.0%) |
| 18 to 34 Years | 0 (0.0%) | 0 (0.0%) |
| 35 to 64 Years | 0 (0.0%) | 7 (1.7%) |
| 65 to 74 Years | 0 (0.0%) | 0 (0.0%) |
| 75 Years and over | 0 (0.0%) | 0 (0.0%) |
Technology Access in Strasburg
Computing Device Access in Strasburg
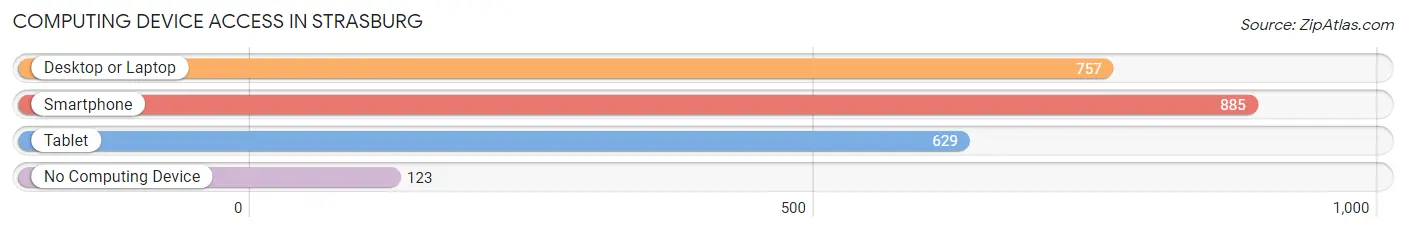
| Device Type | # Households | % Households |
| Desktop or Laptop | 757 | 69.7% |
| Smartphone | 885 | 81.5% |
| Tablet | 629 | 57.9% |
| No Computing Device | 123 | 11.3% |
| Total | 1,086 | 100.0% |
Internet Access in Strasburg
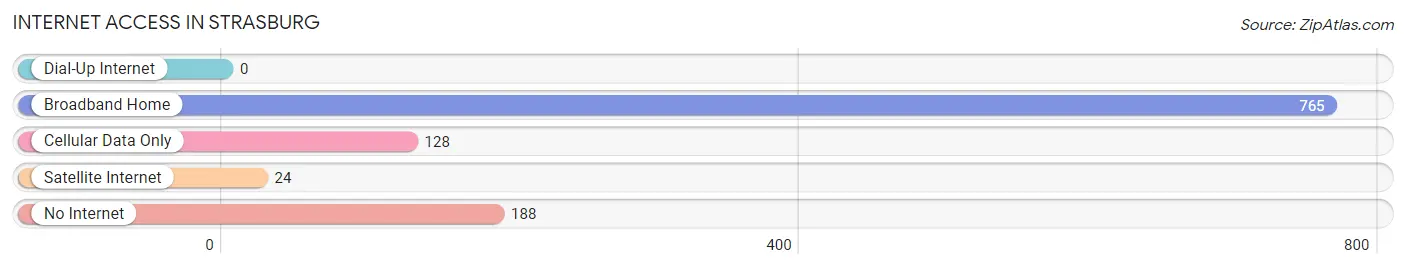
| Internet Type | # Households | % Households |
| Dial-Up Internet | 0 | 0.0% |
| Broadband Home | 765 | 70.4% |
| Cellular Data Only | 128 | 11.8% |
| Satellite Internet | 24 | 2.2% |
| No Internet | 188 | 17.3% |
| Total | 1,086 | 100.0% |
Strasburg Summary
Strasburg is a village located in Tuscarawas County, Ohio, United States. The population was 1,845 at the 2010 census. It is part of the Canton-Massillon, OH Metropolitan Statistical Area.
History
Strasburg was founded in 1814 by John Stradling, a Revolutionary War veteran. The village was named after Stradling's hometown of Strasburg, Virginia. The first post office in Strasburg was established in 1817.
In 1828, the Ohio and Erie Canal was completed, connecting Strasburg to the Ohio River. This allowed for the transportation of goods and people, and helped to spur the growth of the village.
In 1845, the Strasburg Railroad was built, connecting the village to the Pennsylvania Railroad. This allowed for the transportation of coal and other goods to and from the village.
In 1871, the Strasburg Telephone Company was established, providing telephone service to the village.
In 1887 the Strasburg Water Works was established providing water to the village
In 1895, the Strasburg Electric Light and Power Company was established, providing electricity to the village.
Geography
Strasburg is located at 40 37 17 North 81 25 17 West 40 621400 81 421400
According to the United States Census Bureau, the village has a total area of 1.2 square miles (3.1 km2), all land.
Demographics
As of the census of 2000, there were 1,845 people, 717 households, and 517 families residing in the village. The population density was 1,541.2 people per square mile (595.2/km2). There were 762 housing units at an average density of 633.2 per square mile (245.2/km2). The racial makeup of the village was 98.45% White, 0.11% African American, 0.11% Native American, 0.11% Asian, 0.11% from other races, and 1.11% from two or more races. Hispanic or Latino of any race were 0.43% of the population.
There were 717 households, out of which 33.2% had children under the age of 18 living with them, 56.2% were married couples living together, 10.2% had a female householder with no husband present, and 29.7% were non-families. 25.7% of all households were made up of individuals, and 12.2% had someone living alone who was 65 years of age or older. The average household size was 2.56 and the average family size was 3.09.
In the village, the population was spread out, with 26.2% under the age of 18, 8.2% from 18 to 24, 28.7% from 25 to 44, 22.2% from 45 to 64, and 14.7% who were 65 years of age or older. The median age was 37 years. For every 100 females, there were 93.2 males. For every 100 females age 18 and over, there were 88.2 males.
The median income for a household in the village was $37,500, and the median income for a family was $45,000. Males had a median income of $31,964 versus $22,500 for females. The per capita income for the village was $17,945. About 4.2% of families and 5.7% of the population were below the poverty line, including 6.2% of those under age 18 and 6.2% of those age 65 or over.
Economy
Strasburg is home to several businesses, including a grocery store, a hardware store, a bank, a pharmacy, a restaurant, and a gas station. The village is also home to a number of small manufacturing companies, including a plastics manufacturer, a metal fabricator, and a machine shop.
The village is served by the Strasburg-Franklin Local School District. The district operates two elementary schools, one middle school, and one high school.
Strasburg is also home to a number of churches, including the Strasburg United Methodist Church, the Strasburg Presbyterian Church, and the Strasburg Christian Church.
Strasburg is served by the Tuscarawas County Public Library System. The library offers a variety of services, including books, magazines, newspapers, audio books, DVDs, and online resources.
Common Questions
What is Per Capita Income in Strasburg?
Per Capita income in Strasburg is $32,736.
What is the Median Family Income in Strasburg?
Median Family Income in Strasburg is $85,455.
What is the Median Household income in Strasburg?
Median Household Income in Strasburg is $61,833.
What is Income or Wage Gap in Strasburg?
Income or Wage Gap in Strasburg is 46.8%.
Women in Strasburg earn 53.2 cents for every dollar earned by a man.
What is Inequality or Gini Index in Strasburg?
Inequality or Gini Index in Strasburg is 0.42.
What is the Total Population of Strasburg?
Total Population of Strasburg is 2,581.
What is the Total Male Population of Strasburg?
Total Male Population of Strasburg is 1,286.
What is the Total Female Population of Strasburg?
Total Female Population of Strasburg is 1,295.
What is the Ratio of Males per 100 Females in Strasburg?
There are 99.31 Males per 100 Females in Strasburg.
What is the Ratio of Females per 100 Males in Strasburg?
There are 100.70 Females per 100 Males in Strasburg.
What is the Median Population Age in Strasburg?
Median Population Age in Strasburg is 46.2 Years.
What is the Average Family Size in Strasburg
Average Family Size in Strasburg is 3.0 People.
What is the Average Household Size in Strasburg
Average Household Size in Strasburg is 2.4 People.
How Large is the Labor Force in Strasburg?
There are 1,257 People in the Labor Forcein in Strasburg.
What is the Percentage of People in the Labor Force in Strasburg?
59.1% of People are in the Labor Force in Strasburg.
What is the Unemployment Rate in Strasburg?
Unemployment Rate in Strasburg is 3.7%.