Smithville, OH Map & Demographics
Smithville Map
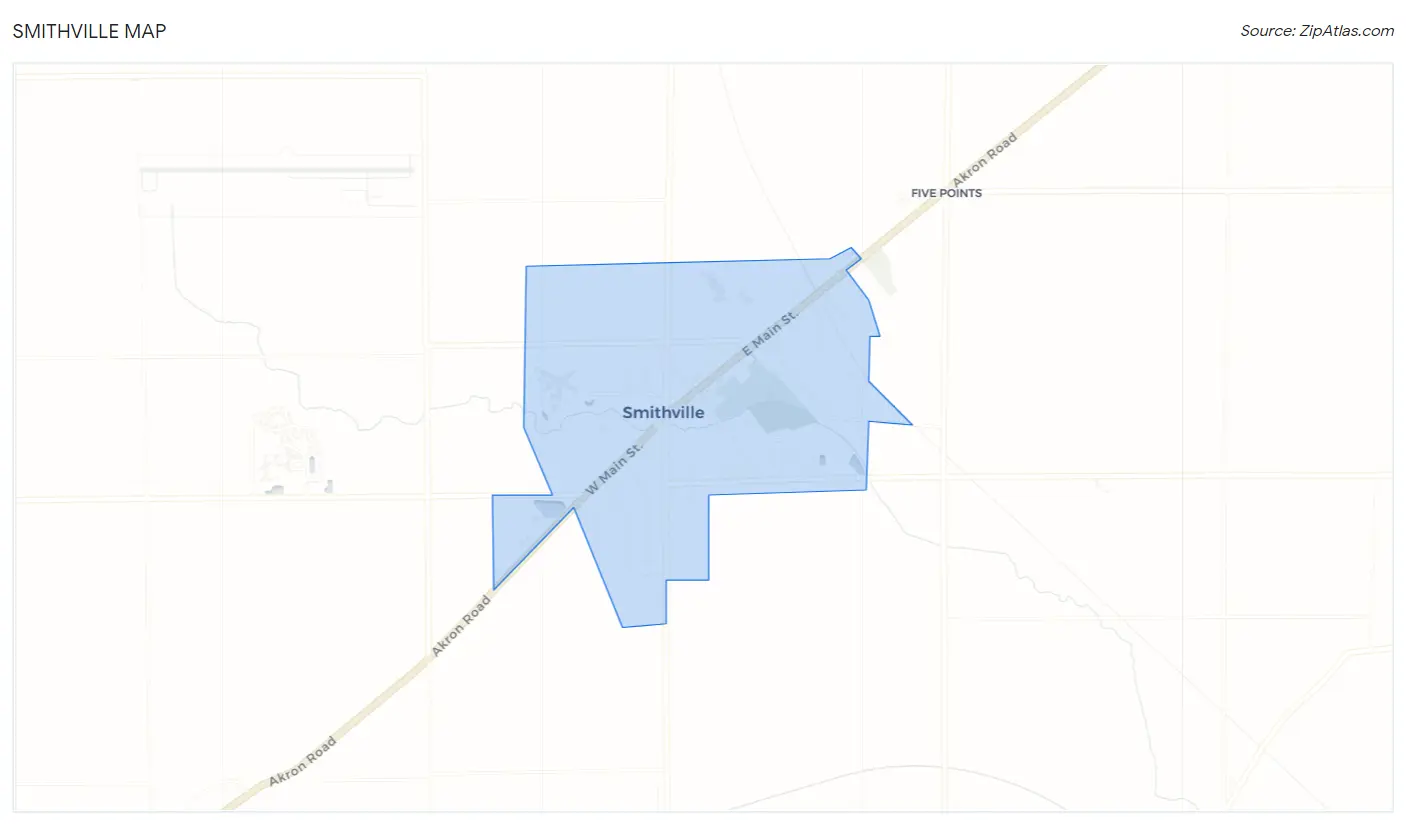
Smithville Overview
$33,674
PER CAPITA INCOME
$76,618
AVG FAMILY INCOME
$69,063
AVG HOUSEHOLD INCOME
39.5%
WAGE / INCOME GAP [ % ]
60.5¢/ $1
WAGE / INCOME GAP [ $ ]
0.36
INEQUALITY / GINI INDEX
1,357
TOTAL POPULATION
731
MALE POPULATION
626
FEMALE POPULATION
116.77
MALES / 100 FEMALES
85.64
FEMALES / 100 MALES
40.2
MEDIAN AGE
2.8
AVG FAMILY SIZE
2.4
AVG HOUSEHOLD SIZE
651
LABOR FORCE [ PEOPLE ]
62.4%
PERCENT IN LABOR FORCE
2.3%
UNEMPLOYMENT RATE
Smithville Zip Codes
Smithville Area Codes
Income in Smithville
Income Overview in Smithville
Per Capita Income in Smithville is $33,674, while median incomes of families and households are $76,618 and $69,063 respectively.
| Characteristic | Number | Measure |
| Per Capita Income | 1,357 | $33,674 |
| Median Family Income | 428 | $76,618 |
| Mean Family Income | 428 | $84,939 |
| Median Household Income | 560 | $69,063 |
| Mean Household Income | 560 | $81,943 |
| Income Deficit | 428 | $0 |
| Wage / Income Gap (%) | 1,357 | 39.55% |
| Wage / Income Gap ($) | 1,357 | 60.45¢ per $1 |
| Gini / Inequality Index | 1,357 | 0.36 |
Earnings by Sex in Smithville
Average Earnings in Smithville are $37,800, $47,250 for men and $28,563 for women, a difference of 39.6%.
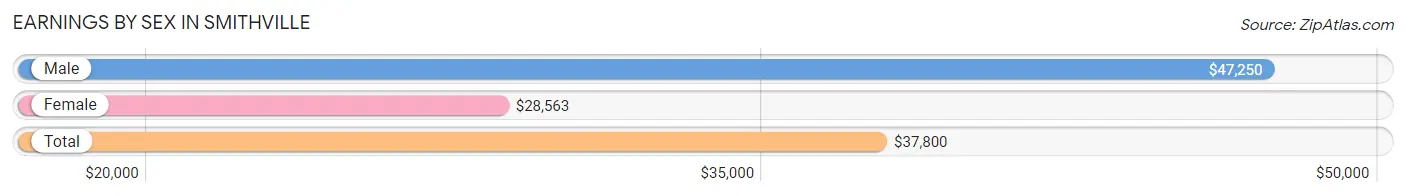
| Sex | Number | Average Earnings |
| Male | 377 (55.8%) | $47,250 |
| Female | 299 (44.2%) | $28,563 |
| Total | 676 (100.0%) | $37,800 |
Earnings by Sex by Income Bracket in Smithville
The most common earnings brackets in Smithville are $75,000 to $99,999 for men (55 | 14.6%) and $25,000 to $29,999 for women (48 | 16.1%).
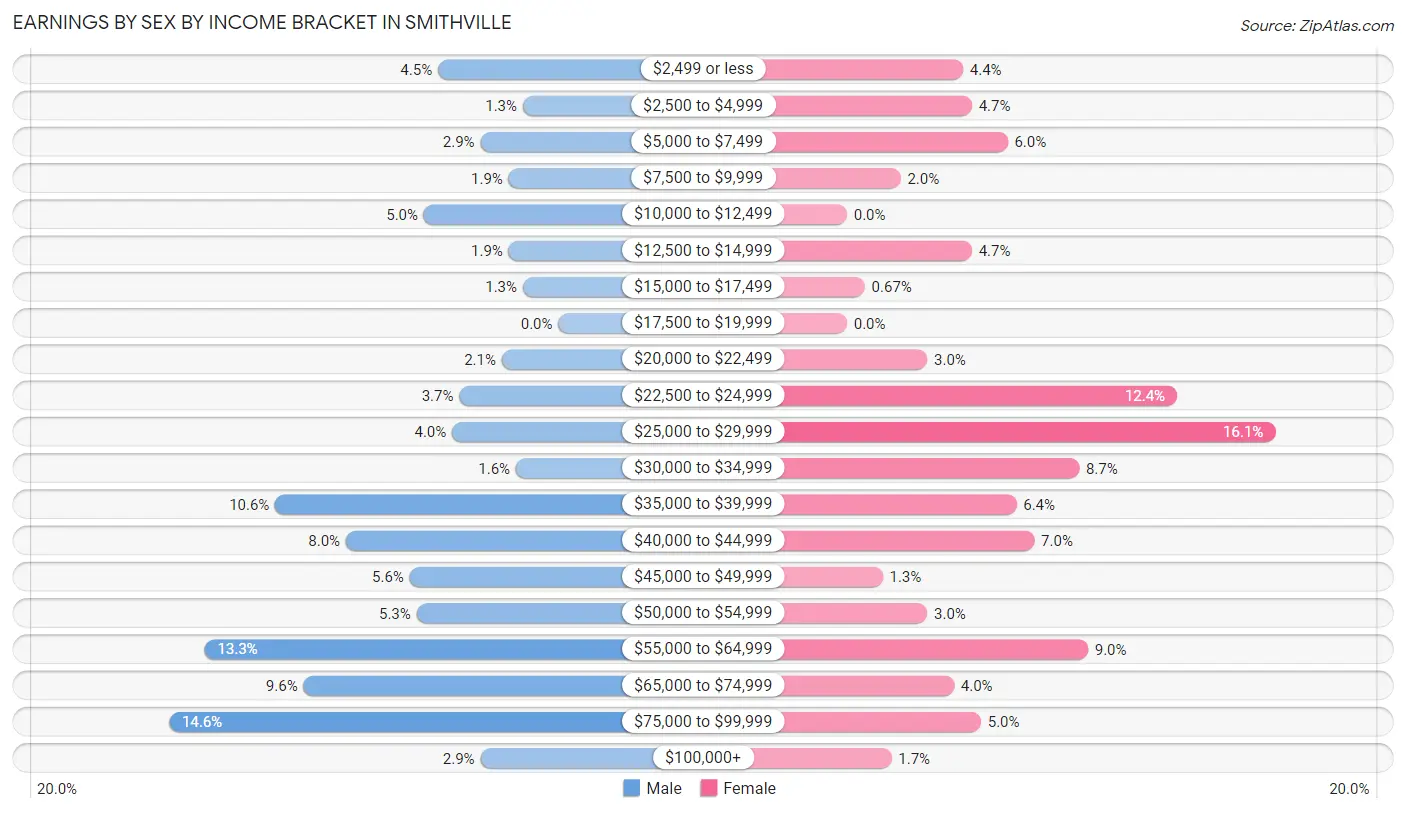
| Income | Male | Female |
| $2,499 or less | 17 (4.5%) | 13 (4.3%) |
| $2,500 to $4,999 | 5 (1.3%) | 14 (4.7%) |
| $5,000 to $7,499 | 11 (2.9%) | 18 (6.0%) |
| $7,500 to $9,999 | 7 (1.9%) | 6 (2.0%) |
| $10,000 to $12,499 | 19 (5.0%) | 0 (0.0%) |
| $12,500 to $14,999 | 7 (1.9%) | 14 (4.7%) |
| $15,000 to $17,499 | 5 (1.3%) | 2 (0.7%) |
| $17,500 to $19,999 | 0 (0.0%) | 0 (0.0%) |
| $20,000 to $22,499 | 8 (2.1%) | 9 (3.0%) |
| $22,500 to $24,999 | 14 (3.7%) | 37 (12.4%) |
| $25,000 to $29,999 | 15 (4.0%) | 48 (16.1%) |
| $30,000 to $34,999 | 6 (1.6%) | 26 (8.7%) |
| $35,000 to $39,999 | 40 (10.6%) | 19 (6.4%) |
| $40,000 to $44,999 | 30 (8.0%) | 21 (7.0%) |
| $45,000 to $49,999 | 21 (5.6%) | 4 (1.3%) |
| $50,000 to $54,999 | 20 (5.3%) | 9 (3.0%) |
| $55,000 to $64,999 | 50 (13.3%) | 27 (9.0%) |
| $65,000 to $74,999 | 36 (9.6%) | 12 (4.0%) |
| $75,000 to $99,999 | 55 (14.6%) | 15 (5.0%) |
| $100,000+ | 11 (2.9%) | 5 (1.7%) |
| Total | 377 (100.0%) | 299 (100.0%) |
Earnings by Sex by Educational Attainment in Smithville
Average earnings in Smithville are $54,028 for men and $32,772 for women, a difference of 39.3%. Men with an educational attainment of graduate degree enjoy the highest average annual earnings of $63,250, while those with high school diploma education earn the least with $46,250. Women with an educational attainment of graduate degree earn the most with the average annual earnings of $47,500, while those with high school diploma education have the smallest earnings of $28,375.
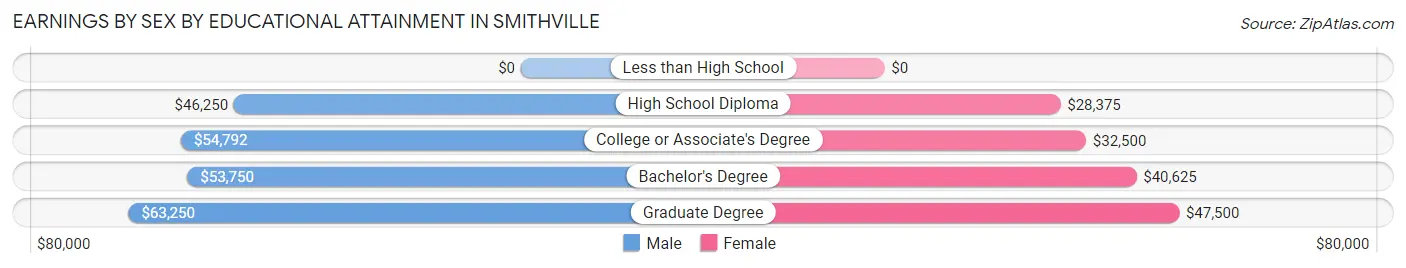
| Educational Attainment | Male Income | Female Income |
| Less than High School | - | - |
| High School Diploma | $46,250 | $28,375 |
| College or Associate's Degree | $54,792 | $32,500 |
| Bachelor's Degree | $53,750 | $40,625 |
| Graduate Degree | $63,250 | $47,500 |
| Total | $54,028 | $32,772 |
Family Income in Smithville
Family Income Brackets in Smithville
According to the Smithville family income data, there are 110 families falling into the $50,000 to $74,999 income range, which is the most common income bracket and makes up 25.7% of all families. Conversely, the $15,000 to $24,999 income bracket is the least frequent group with only 2 families (0.5%) belonging to this category.
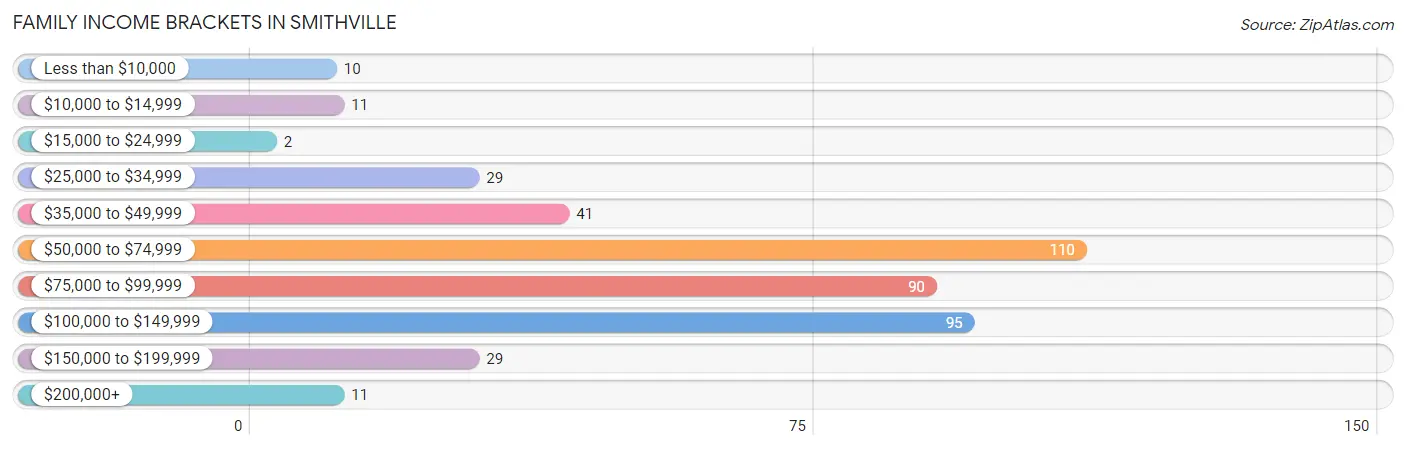
| Income Bracket | # Families | % Families |
| Less than $10,000 | 10 | 2.3% |
| $10,000 to $14,999 | 11 | 2.6% |
| $15,000 to $24,999 | 2 | 0.5% |
| $25,000 to $34,999 | 29 | 6.8% |
| $35,000 to $49,999 | 41 | 9.6% |
| $50,000 to $74,999 | 110 | 25.7% |
| $75,000 to $99,999 | 90 | 21.0% |
| $100,000 to $149,999 | 95 | 22.2% |
| $150,000 to $199,999 | 29 | 6.8% |
| $200,000+ | 11 | 2.6% |
Family Income by Famaliy Size in Smithville
4-person families (49 | 11.5%) account for the highest median family income in Smithville with $130,750 per family, while 2-person families (275 | 64.2%) have the highest median income of $34,554 per family member.
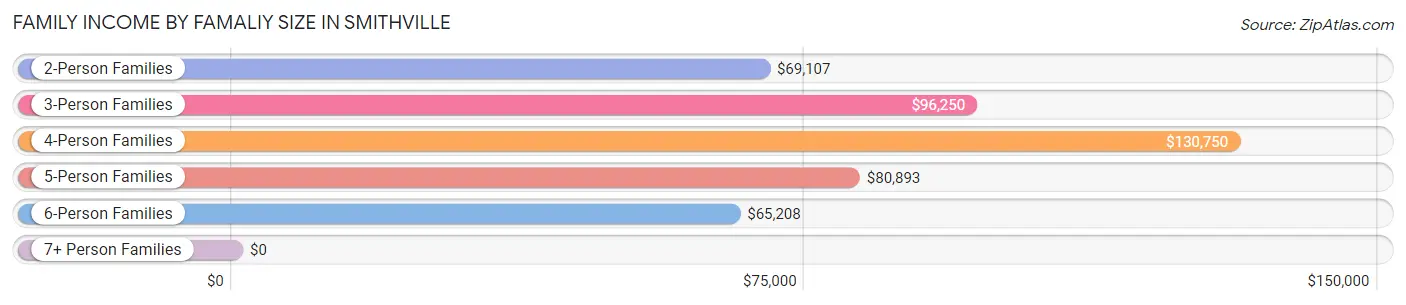
| Income Bracket | # Families | Median Income |
| 2-Person Families | 275 (64.2%) | $69,107 |
| 3-Person Families | 61 (14.2%) | $96,250 |
| 4-Person Families | 49 (11.5%) | $130,750 |
| 5-Person Families | 19 (4.4%) | $80,893 |
| 6-Person Families | 17 (4.0%) | $65,208 |
| 7+ Person Families | 7 (1.6%) | $0 |
| Total | 428 (100.0%) | $76,618 |
Family Income by Number of Earners in Smithville
The median family income in Smithville is $76,618, with families comprising 3+ earners (31) having the highest median family income of $143,750, while families with 1 earner (149) have the lowest median family income of $51,563, accounting for 7.2% and 34.8% of families, respectively.
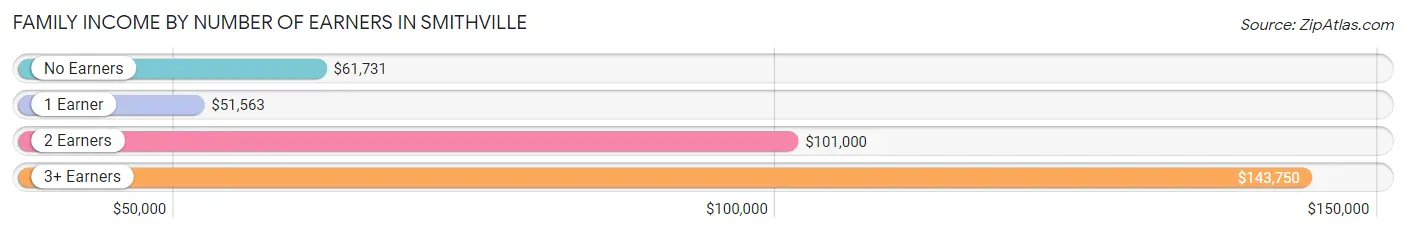
| Number of Earners | # Families | Median Income |
| No Earners | 100 (23.4%) | $61,731 |
| 1 Earner | 149 (34.8%) | $51,563 |
| 2 Earners | 148 (34.6%) | $101,000 |
| 3+ Earners | 31 (7.2%) | $143,750 |
| Total | 428 (100.0%) | $76,618 |
Household Income in Smithville
Household Income Brackets in Smithville
With 143 households falling in the category, the $50,000 to $74,999 income range is the most frequent in Smithville, accounting for 25.5% of all households. In contrast, only 11 households (2.0%) fall into the $10,000 to $14,999 income bracket, making it the least populous group.
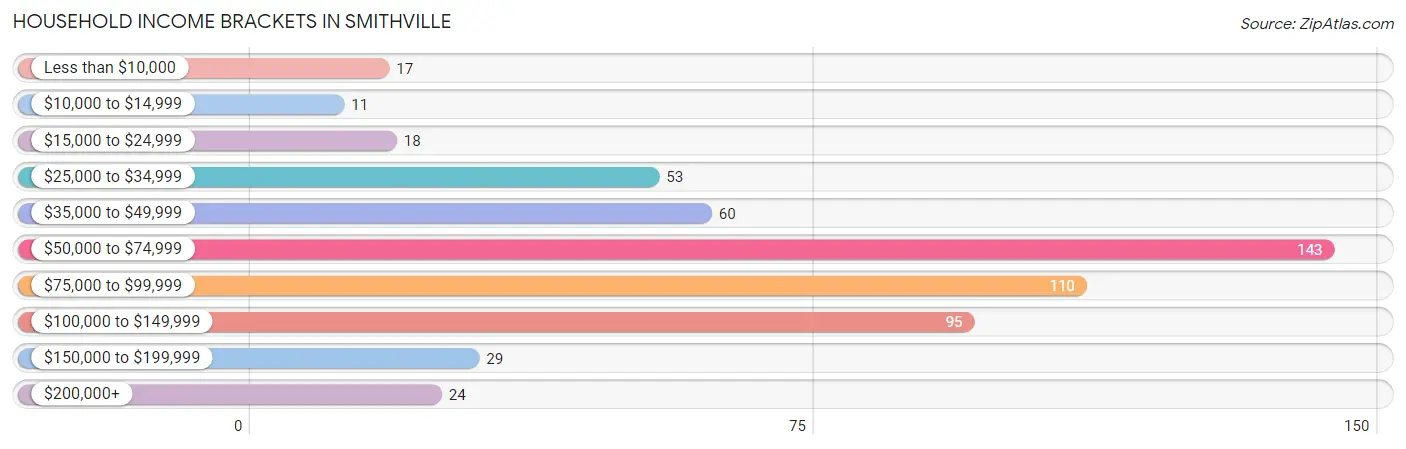
| Income Bracket | # Households | % Households |
| Less than $10,000 | 17 | 3.0% |
| $10,000 to $14,999 | 11 | 2.0% |
| $15,000 to $24,999 | 18 | 3.2% |
| $25,000 to $34,999 | 53 | 9.5% |
| $35,000 to $49,999 | 60 | 10.7% |
| $50,000 to $74,999 | 143 | 25.5% |
| $75,000 to $99,999 | 110 | 19.6% |
| $100,000 to $149,999 | 95 | 17.0% |
| $150,000 to $199,999 | 29 | 5.2% |
| $200,000+ | 24 | 4.3% |
Household Income by Householder Age in Smithville
The median household income in Smithville is $69,063, with the highest median household income of $84,545 found in the 45 to 64 years age bracket for the primary householder. A total of 190 households (33.9%) fall into this category. Meanwhile, the 15 to 24 years age bracket for the primary householder has the lowest median household income of $49,583, with 45 households (8.0%) in this group.
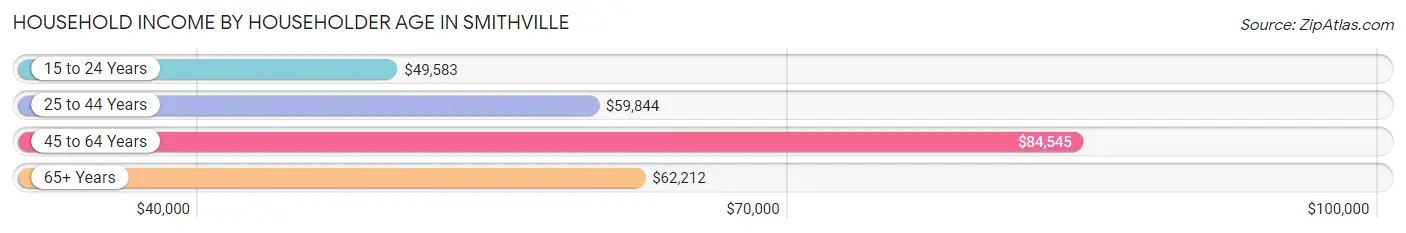
| Income Bracket | # Households | Median Income |
| 15 to 24 Years | 45 (8.0%) | $49,583 |
| 25 to 44 Years | 152 (27.1%) | $59,844 |
| 45 to 64 Years | 190 (33.9%) | $84,545 |
| 65+ Years | 173 (30.9%) | $62,212 |
| Total | 560 (100.0%) | $69,063 |
Poverty in Smithville
Income Below Poverty by Sex and Age in Smithville
With 7.1% poverty level for males and 5.6% for females among the residents of Smithville, under 5 year old males and 16 and 17 year old females are the most vulnerable to poverty, with 21 males (35.0%) and 5 females (26.3%) in their respective age groups living below the poverty level.
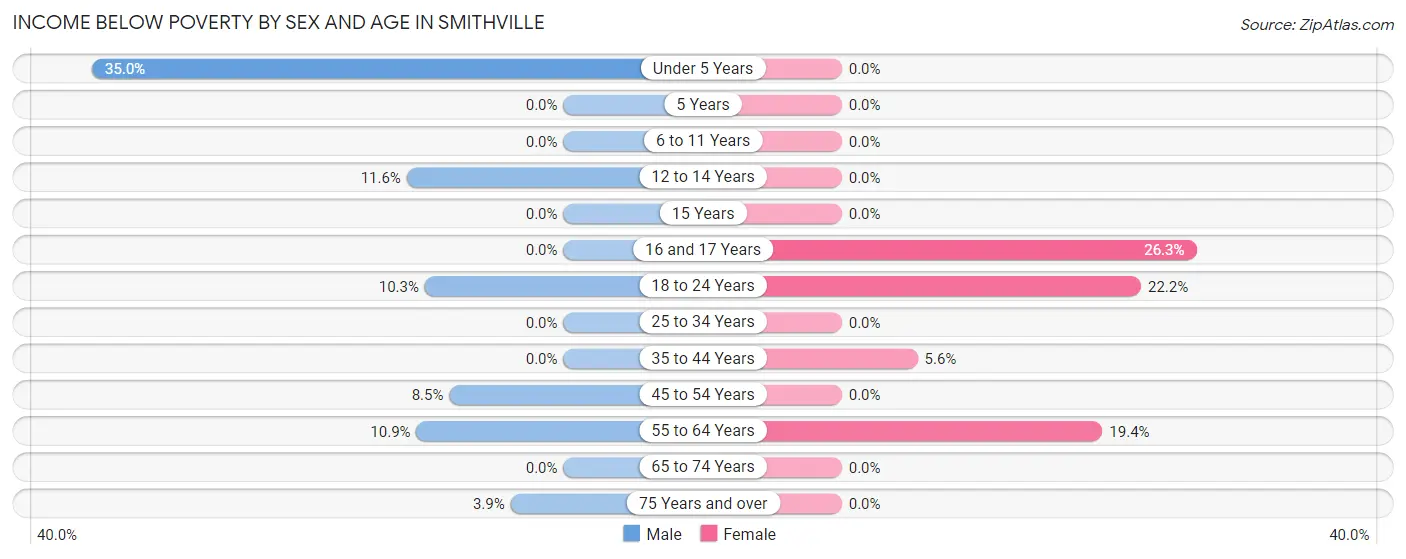
| Age Bracket | Male | Female |
| Under 5 Years | 21 (35.0%) | 0 (0.0%) |
| 5 Years | 0 (0.0%) | 0 (0.0%) |
| 6 to 11 Years | 0 (0.0%) | 0 (0.0%) |
| 12 to 14 Years | 5 (11.6%) | 0 (0.0%) |
| 15 Years | 0 (0.0%) | 0 (0.0%) |
| 16 and 17 Years | 0 (0.0%) | 5 (26.3%) |
| 18 to 24 Years | 7 (10.3%) | 8 (22.2%) |
| 25 to 34 Years | 0 (0.0%) | 0 (0.0%) |
| 35 to 44 Years | 0 (0.0%) | 4 (5.6%) |
| 45 to 54 Years | 5 (8.5%) | 0 (0.0%) |
| 55 to 64 Years | 12 (10.9%) | 18 (19.4%) |
| 65 to 74 Years | 0 (0.0%) | 0 (0.0%) |
| 75 Years and over | 2 (3.9%) | 0 (0.0%) |
| Total | 52 (7.1%) | 35 (5.6%) |
Income Above Poverty by Sex and Age in Smithville
According to the poverty statistics in Smithville, males aged 5 years and females aged under 5 years are the age groups that are most secure financially, with 100.0% of males and 100.0% of females in these age groups living above the poverty line.
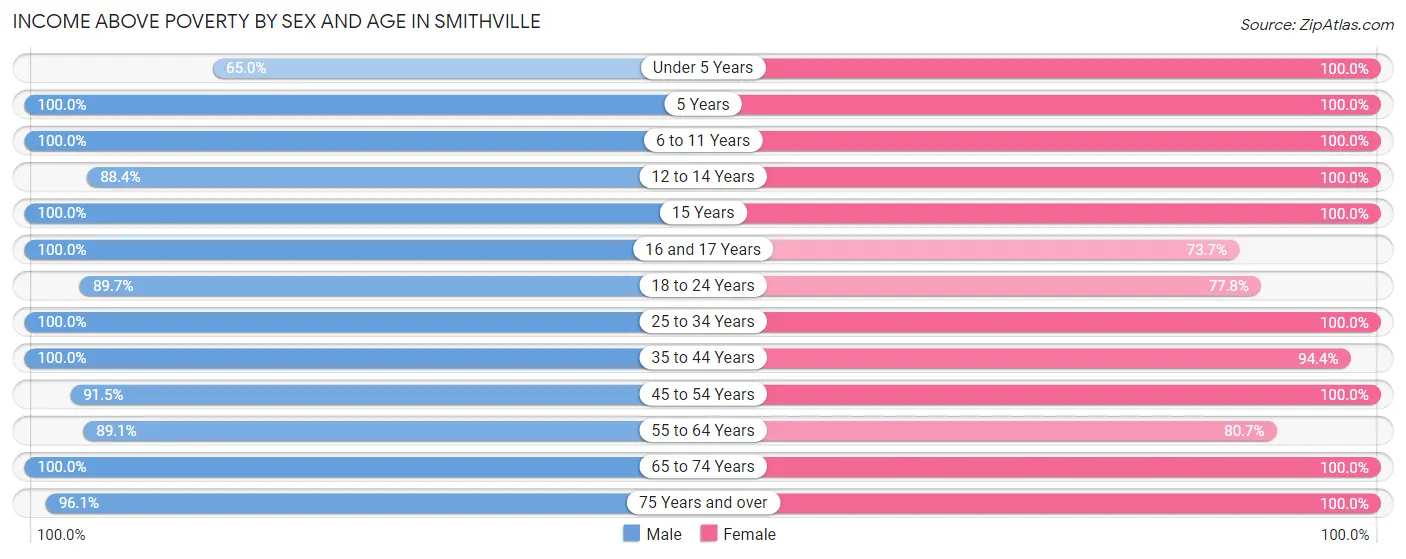
| Age Bracket | Male | Female |
| Under 5 Years | 39 (65.0%) | 39 (100.0%) |
| 5 Years | 8 (100.0%) | 8 (100.0%) |
| 6 to 11 Years | 69 (100.0%) | 49 (100.0%) |
| 12 to 14 Years | 38 (88.4%) | 18 (100.0%) |
| 15 Years | 11 (100.0%) | 9 (100.0%) |
| 16 and 17 Years | 18 (100.0%) | 14 (73.7%) |
| 18 to 24 Years | 61 (89.7%) | 28 (77.8%) |
| 25 to 34 Years | 57 (100.0%) | 75 (100.0%) |
| 35 to 44 Years | 76 (100.0%) | 67 (94.4%) |
| 45 to 54 Years | 54 (91.5%) | 48 (100.0%) |
| 55 to 64 Years | 98 (89.1%) | 75 (80.6%) |
| 65 to 74 Years | 101 (100.0%) | 103 (100.0%) |
| 75 Years and over | 49 (96.1%) | 58 (100.0%) |
| Total | 679 (92.9%) | 591 (94.4%) |
Income Below Poverty Among Married-Couple Families in Smithville
The poverty statistics for married-couple families in Smithville show that 1.5% or 5 of the total 328 families live below the poverty line. Families with no children have the highest poverty rate of 2.1%, comprising of 5 families. On the other hand, families with 1 or 2 children have the lowest poverty rate of 0.0%, which includes 0 families.
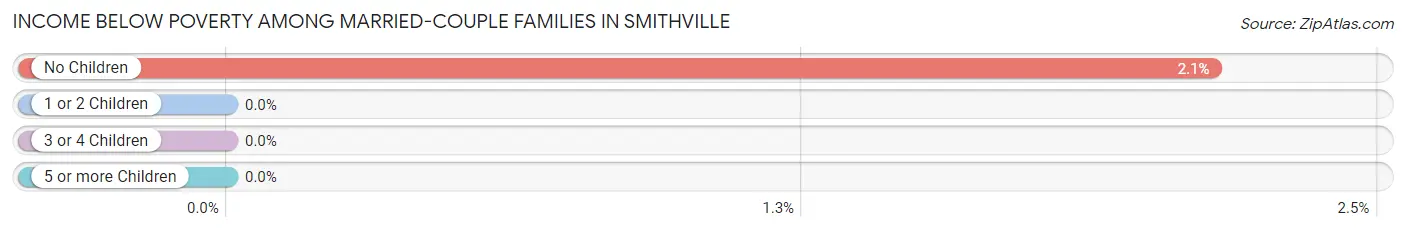
| Children | Above Poverty | Below Poverty |
| No Children | 229 (97.9%) | 5 (2.1%) |
| 1 or 2 Children | 55 (100.0%) | 0 (0.0%) |
| 3 or 4 Children | 32 (100.0%) | 0 (0.0%) |
| 5 or more Children | 7 (100.0%) | 0 (0.0%) |
| Total | 323 (98.5%) | 5 (1.5%) |
Income Below Poverty Among Single-Parent Households in Smithville
According to the poverty data in Smithville, 22.6% or 7 single-father households and 15.9% or 11 single-mother households are living below the poverty line. Among single-father households, those with 1 or 2 children have the highest poverty rate, with 7 households (33.3%) experiencing poverty. Likewise, among single-mother households, those with 3 or 4 children have the highest poverty rate, with 5 households (62.5%) falling below the poverty line.
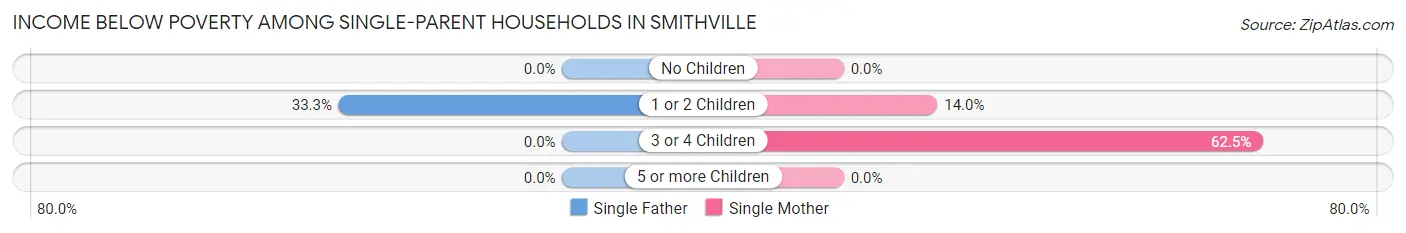
| Children | Single Father | Single Mother |
| No Children | 0 (0.0%) | 0 (0.0%) |
| 1 or 2 Children | 7 (33.3%) | 6 (14.0%) |
| 3 or 4 Children | 0 (0.0%) | 5 (62.5%) |
| 5 or more Children | 0 (0.0%) | 0 (0.0%) |
| Total | 7 (22.6%) | 11 (15.9%) |
Income Below Poverty Among Married-Couple vs Single-Parent Households in Smithville
The poverty data for Smithville shows that 5 of the married-couple family households (1.5%) and 18 of the single-parent households (18.0%) are living below the poverty level. Within the married-couple family households, those with no children have the highest poverty rate, with 5 households (2.1%) falling below the poverty line. Among the single-parent households, those with 3 or 4 children have the highest poverty rate, with 5 household (62.5%) living below poverty.
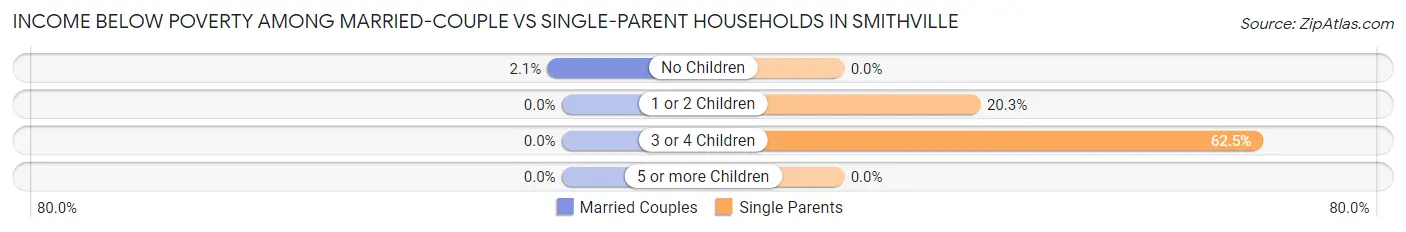
| Children | Married-Couple Families | Single-Parent Households |
| No Children | 5 (2.1%) | 0 (0.0%) |
| 1 or 2 Children | 0 (0.0%) | 13 (20.3%) |
| 3 or 4 Children | 0 (0.0%) | 5 (62.5%) |
| 5 or more Children | 0 (0.0%) | 0 (0.0%) |
| Total | 5 (1.5%) | 18 (18.0%) |
Race in Smithville
The most populous races in Smithville are White / Caucasian (1,306 | 96.2%), Two or more Races (27 | 2.0%), and Hispanic or Latino (16 | 1.2%).
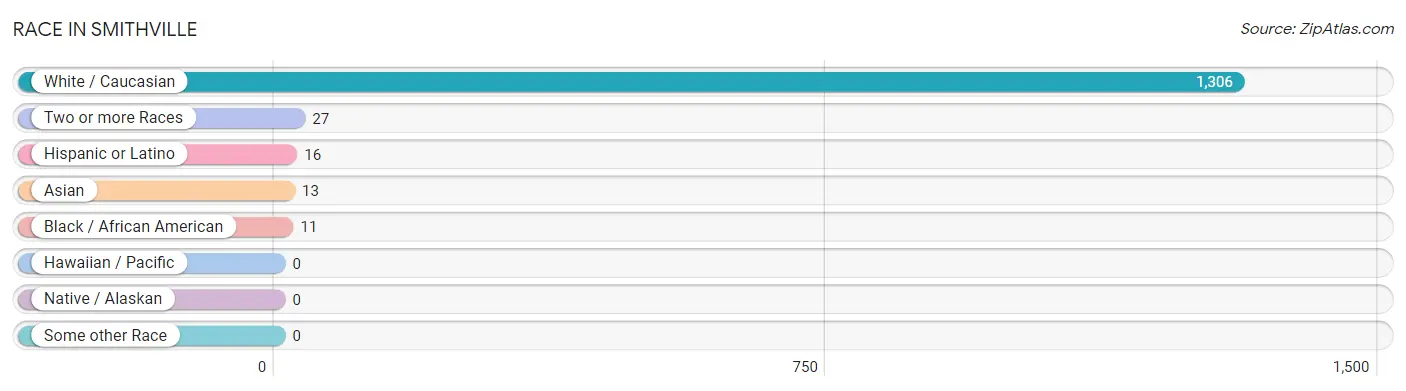
| Race | # Population | % Population |
| Asian | 13 | 1.0% |
| Black / African American | 11 | 0.8% |
| Hawaiian / Pacific | 0 | 0.0% |
| Hispanic or Latino | 16 | 1.2% |
| Native / Alaskan | 0 | 0.0% |
| White / Caucasian | 1,306 | 96.2% |
| Two or more Races | 27 | 2.0% |
| Some other Race | 0 | 0.0% |
| Total | 1,357 | 100.0% |
Ancestry in Smithville
The most populous ancestries reported in Smithville are German (463 | 34.1%), English (181 | 13.3%), Irish (118 | 8.7%), American (81 | 6.0%), and Swiss (60 | 4.4%), together accounting for 66.5% of all Smithville residents.
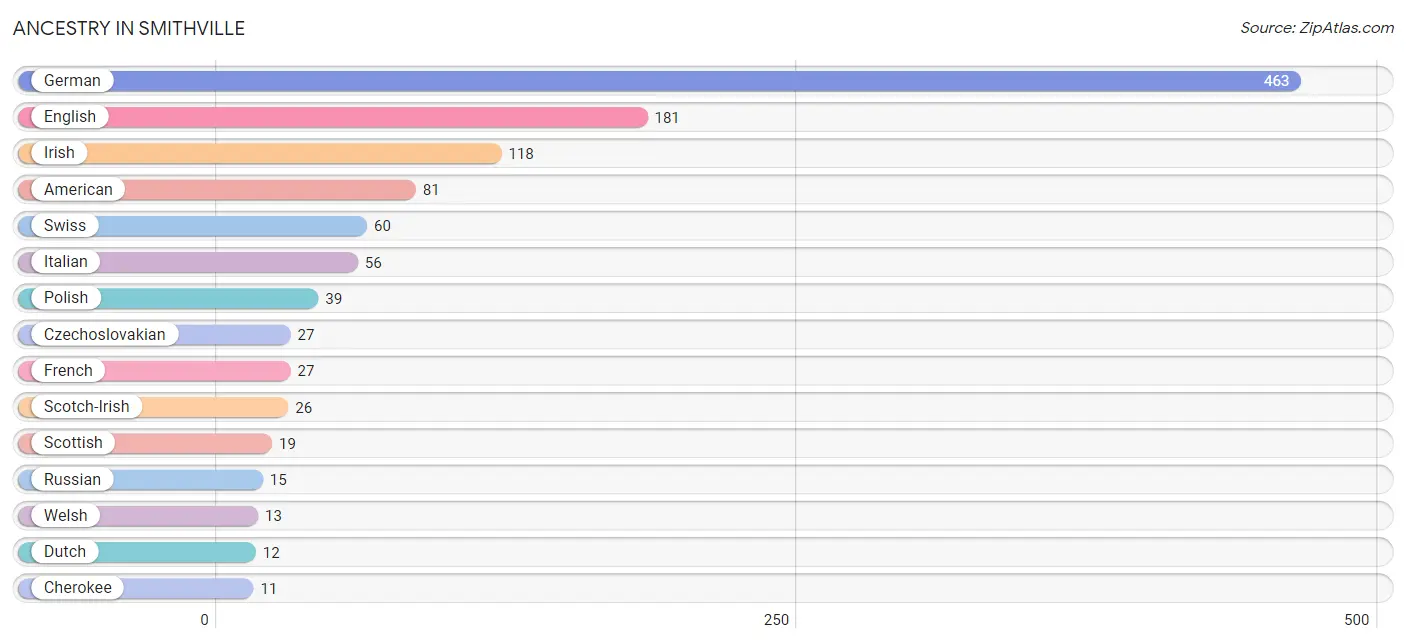
| Ancestry | # Population | % Population |
| African | 4 | 0.3% |
| American | 81 | 6.0% |
| Arab | 3 | 0.2% |
| British | 4 | 0.3% |
| Burmese | 4 | 0.3% |
| Cherokee | 11 | 0.8% |
| Chippewa | 5 | 0.4% |
| Czechoslovakian | 27 | 2.0% |
| Dutch | 12 | 0.9% |
| English | 181 | 13.3% |
| European | 11 | 0.8% |
| Finnish | 6 | 0.4% |
| French | 27 | 2.0% |
| French Canadian | 6 | 0.4% |
| German | 463 | 34.1% |
| Greek | 8 | 0.6% |
| Hungarian | 5 | 0.4% |
| Indian (Asian) | 4 | 0.3% |
| Irish | 118 | 8.7% |
| Iroquois | 3 | 0.2% |
| Italian | 56 | 4.1% |
| Korean | 6 | 0.4% |
| Lebanese | 3 | 0.2% |
| Norwegian | 3 | 0.2% |
| Pennsylvania German | 2 | 0.2% |
| Polish | 39 | 2.9% |
| Russian | 15 | 1.1% |
| Scotch-Irish | 26 | 1.9% |
| Scottish | 19 | 1.4% |
| Subsaharan African | 4 | 0.3% |
| Swiss | 60 | 4.4% |
| Welsh | 13 | 1.0% | View All 32 Rows |
Immigrants in Smithville
The most numerous immigrant groups reported in Smithville came from England (4 | 0.3%), Europe (4 | 0.3%), Northern Europe (4 | 0.3%), Asia (3 | 0.2%), and South Central Asia (3 | 0.2%), together accounting for 1.3% of all Smithville residents.
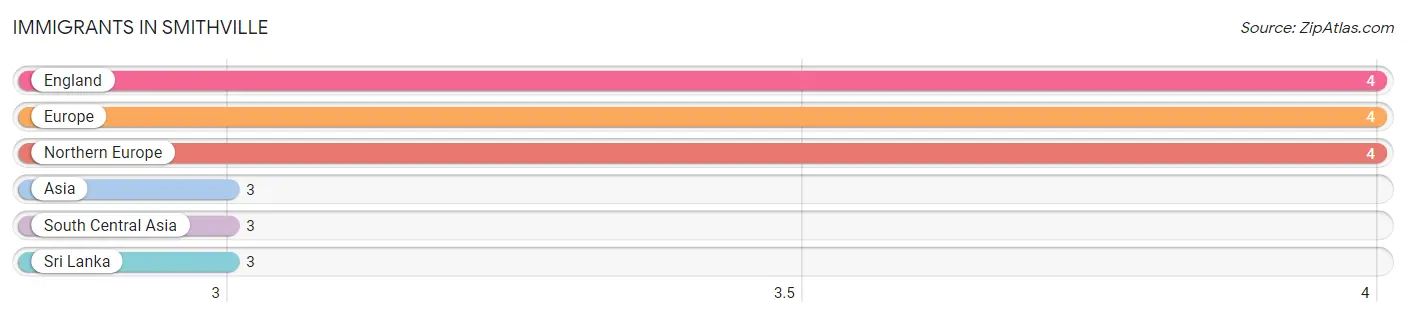
| Immigration Origin | # Population | % Population |
| Asia | 3 | 0.2% |
| England | 4 | 0.3% |
| Europe | 4 | 0.3% |
| Northern Europe | 4 | 0.3% |
| South Central Asia | 3 | 0.2% |
| Sri Lanka | 3 | 0.2% | View All 6 Rows |
Sex and Age in Smithville
Sex and Age in Smithville
The most populous age groups in Smithville are 10 to 14 Years (83 | 11.4%) for men and 70 to 74 Years (59 | 9.4%) for women.
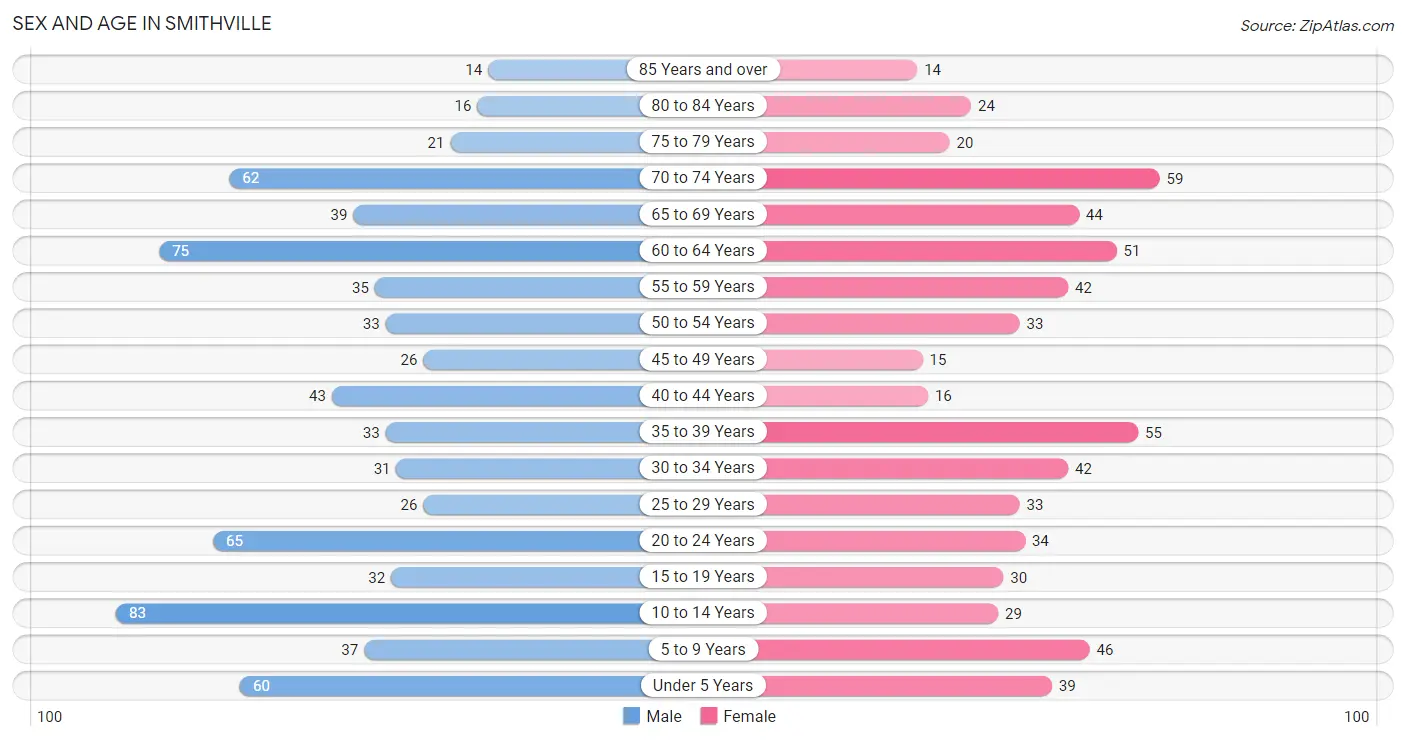
| Age Bracket | Male | Female |
| Under 5 Years | 60 (8.2%) | 39 (6.2%) |
| 5 to 9 Years | 37 (5.1%) | 46 (7.3%) |
| 10 to 14 Years | 83 (11.4%) | 29 (4.6%) |
| 15 to 19 Years | 32 (4.4%) | 30 (4.8%) |
| 20 to 24 Years | 65 (8.9%) | 34 (5.4%) |
| 25 to 29 Years | 26 (3.6%) | 33 (5.3%) |
| 30 to 34 Years | 31 (4.2%) | 42 (6.7%) |
| 35 to 39 Years | 33 (4.5%) | 55 (8.8%) |
| 40 to 44 Years | 43 (5.9%) | 16 (2.6%) |
| 45 to 49 Years | 26 (3.6%) | 15 (2.4%) |
| 50 to 54 Years | 33 (4.5%) | 33 (5.3%) |
| 55 to 59 Years | 35 (4.8%) | 42 (6.7%) |
| 60 to 64 Years | 75 (10.3%) | 51 (8.2%) |
| 65 to 69 Years | 39 (5.3%) | 44 (7.0%) |
| 70 to 74 Years | 62 (8.5%) | 59 (9.4%) |
| 75 to 79 Years | 21 (2.9%) | 20 (3.2%) |
| 80 to 84 Years | 16 (2.2%) | 24 (3.8%) |
| 85 Years and over | 14 (1.9%) | 14 (2.2%) |
| Total | 731 (100.0%) | 626 (100.0%) |
Families and Households in Smithville
Median Family Size in Smithville
The median family size in Smithville is 2.77 persons per family, with married-couple families (328 | 76.6%) accounting for the largest median family size of 2.91 persons per family. On the other hand, single male/father families (31 | 7.2%) represent the smallest median family size with 2.06 persons per family.
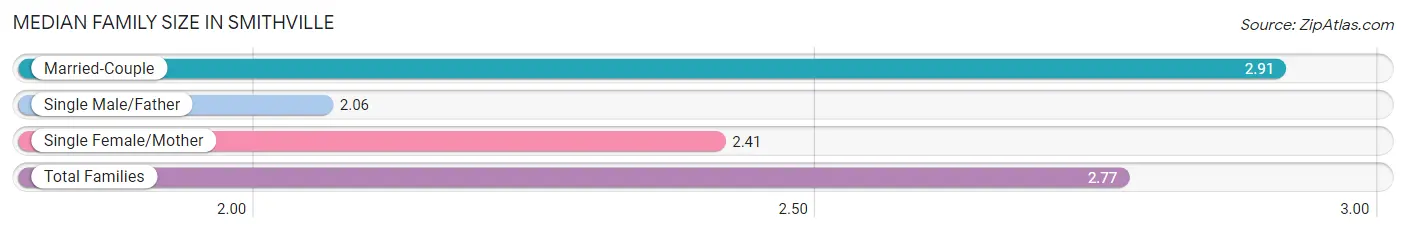
| Family Type | # Families | Family Size |
| Married-Couple | 328 (76.6%) | 2.91 |
| Single Male/Father | 31 (7.2%) | 2.06 |
| Single Female/Mother | 69 (16.1%) | 2.41 |
| Total Families | 428 (100.0%) | 2.77 |
Median Household Size in Smithville
The median household size in Smithville is 2.42 persons per household, with married-couple households (328 | 58.6%) accounting for the largest median household size of 2.91 persons per household. non-family households (132 | 23.6%) represent the smallest median household size with 1.22 persons per household.
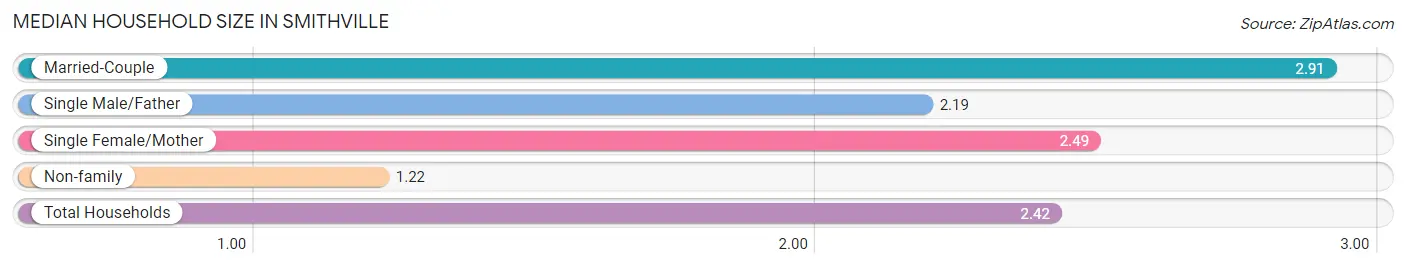
| Household Type | # Households | Household Size |
| Married-Couple | 328 (58.6%) | 2.91 |
| Single Male/Father | 31 (5.5%) | 2.19 |
| Single Female/Mother | 69 (12.3%) | 2.49 |
| Non-family | 132 (23.6%) | 1.22 |
| Total Households | 560 (100.0%) | 2.42 |
Household Size by Marriage Status in Smithville
Out of a total of 560 households in Smithville, 428 (76.4%) are family households, while 132 (23.6%) are nonfamily households. The most numerous type of family households are 2-person households, comprising 267, and the most common type of nonfamily households are 1-person households, comprising 106.
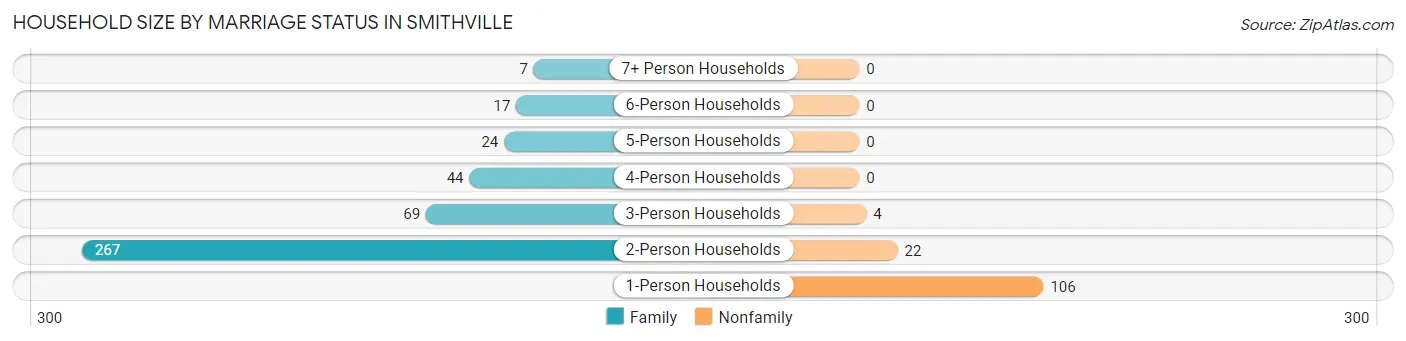
| Household Size | Family Households | Nonfamily Households |
| 1-Person Households | - | 106 (18.9%) |
| 2-Person Households | 267 (47.7%) | 22 (3.9%) |
| 3-Person Households | 69 (12.3%) | 4 (0.7%) |
| 4-Person Households | 44 (7.9%) | 0 (0.0%) |
| 5-Person Households | 24 (4.3%) | 0 (0.0%) |
| 6-Person Households | 17 (3.0%) | 0 (0.0%) |
| 7+ Person Households | 7 (1.3%) | 0 (0.0%) |
| Total | 428 (76.4%) | 132 (23.6%) |
Female Fertility in Smithville
Fertility by Age in Smithville
Average fertility rate in Smithville is 79.0 births per 1,000 women. Women in the age bracket of 20 to 34 years have the highest fertility rate with 165.0 births per 1,000 women. Women in the age bracket of 20 to 34 years acount for 100.0% of all women with births.
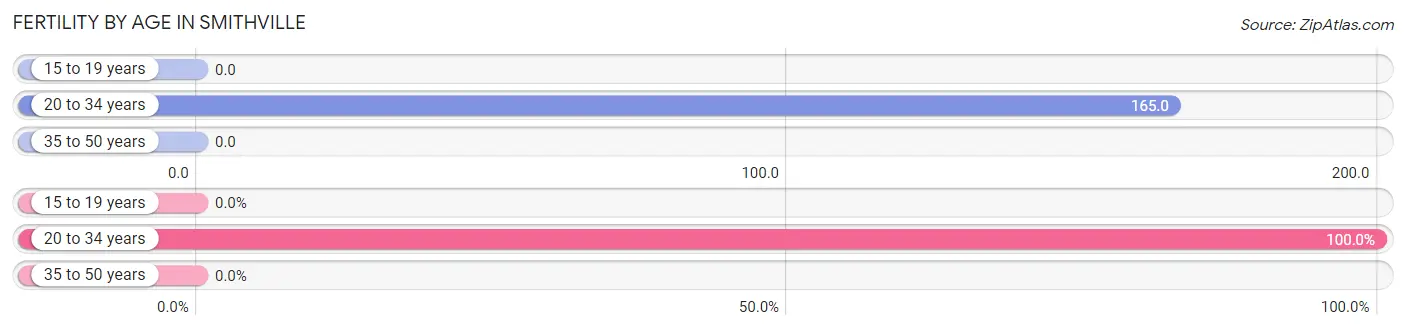
| Age Bracket | Women with Births | Births / 1,000 Women |
| 15 to 19 years | 0 (0.0%) | 0.0 |
| 20 to 34 years | 18 (100.0%) | 165.0 |
| 35 to 50 years | 0 (0.0%) | 0.0 |
| Total | 18 (100.0%) | 79.0 |
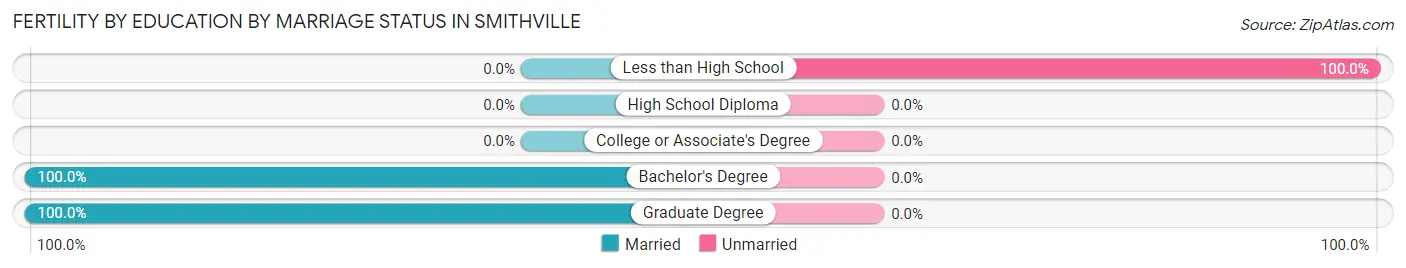
Fertility by Age by Marriage Status in Smithville
66.7% of women with births (18) in Smithville are married. The highest percentage of unmarried women with births falls into 20 to 34 years age bracket with 33.3% of them unmarried at the time of birth, while the lowest percentage of unmarried women with births belong to 20 to 34 years age bracket with 33.3% of them unmarried.
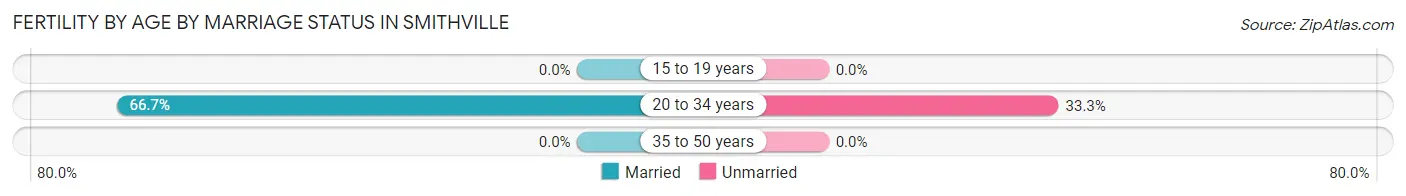
| Age Bracket | Married | Unmarried |
| 15 to 19 years | 0 (0.0%) | 0 (0.0%) |
| 20 to 34 years | 12 (66.7%) | 6 (33.3%) |
| 35 to 50 years | 0 (0.0%) | 0 (0.0%) |
| Total | 12 (66.7%) | 6 (33.3%) |
Fertility by Education in Smithville
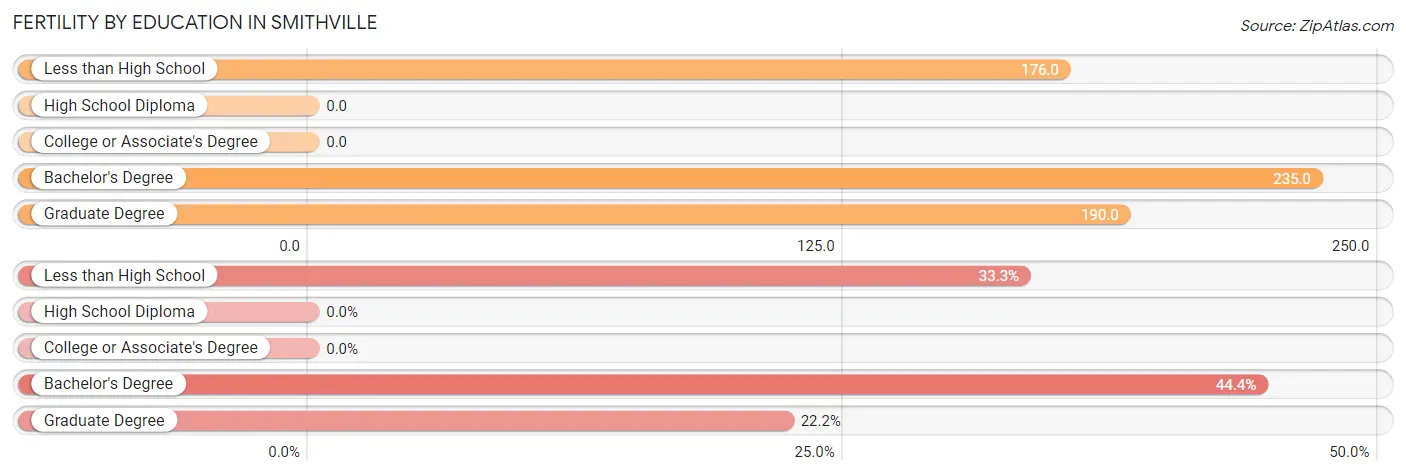
| Educational Attainment | Women with Births | Births / 1,000 Women |
| Less than High School | 6 (33.3%) | 176.0 |
| High School Diploma | 0 (0.0%) | 0.0 |
| College or Associate's Degree | 0 (0.0%) | 0.0 |
| Bachelor's Degree | 8 (44.4%) | 235.0 |
| Graduate Degree | 4 (22.2%) | 190.0 |
| Total | 18 (100.0%) | 79.0 |
Fertility by Education by Marriage Status in Smithville
33.3% of women with births in Smithville are unmarried. Women with the educational attainment of bachelor's degree are most likely to be married with 100.0% of them married at childbirth, while women with the educational attainment of less than high school are least likely to be married with 100.0% of them unmarried at childbirth.
| Educational Attainment | Married | Unmarried |
| Less than High School | 0 (0.0%) | 6 (100.0%) |
| High School Diploma | 0 (0.0%) | 0 (0.0%) |
| College or Associate's Degree | 0 (0.0%) | 0 (0.0%) |
| Bachelor's Degree | 8 (100.0%) | 0 (0.0%) |
| Graduate Degree | 4 (100.0%) | 0 (0.0%) |
| Total | 12 (66.7%) | 6 (33.3%) |
Employment Characteristics in Smithville
Employment by Class of Employer in Smithville
Among the 631 employed individuals in Smithville, private company employees (417 | 66.1%), not-for-profit organizations (74 | 11.7%), and local government employees (70 | 11.1%) make up the most common classes of employment.
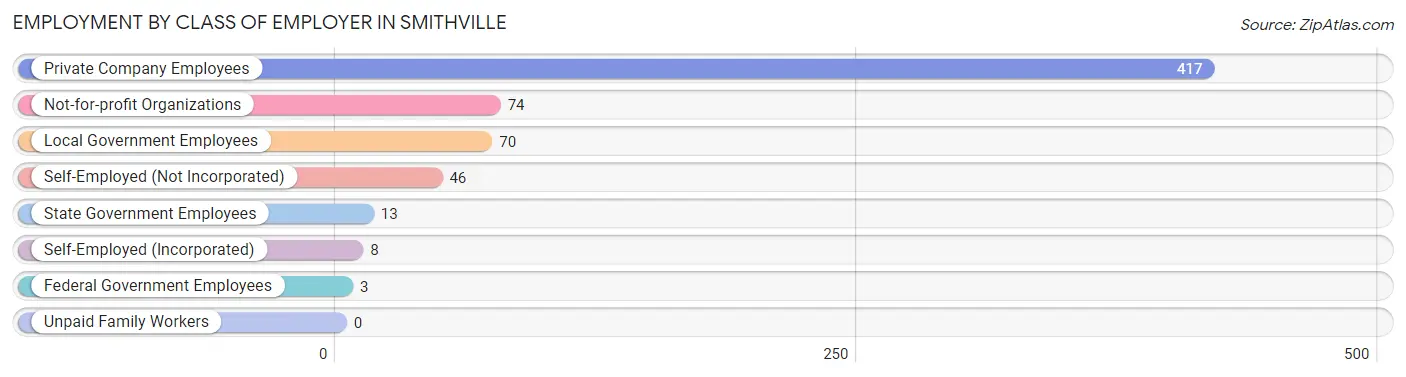
| Employer Class | # Employees | % Employees |
| Private Company Employees | 417 | 66.1% |
| Self-Employed (Incorporated) | 8 | 1.3% |
| Self-Employed (Not Incorporated) | 46 | 7.3% |
| Not-for-profit Organizations | 74 | 11.7% |
| Local Government Employees | 70 | 11.1% |
| State Government Employees | 13 | 2.1% |
| Federal Government Employees | 3 | 0.5% |
| Unpaid Family Workers | 0 | 0.0% |
| Total | 631 | 100.0% |
Employment Status by Age in Smithville
According to the labor force statistics for Smithville, out of the total population over 16 years of age (1,043), 62.4% or 651 individuals are in the labor force, with 2.3% or 15 of them unemployed. The age group with the highest labor force participation rate is 30 to 34 years, with 95.9% or 70 individuals in the labor force. Within the labor force, the 60 to 64 years age range has the highest percentage of unemployed individuals, with 4.9% or 4 of them being unemployed.
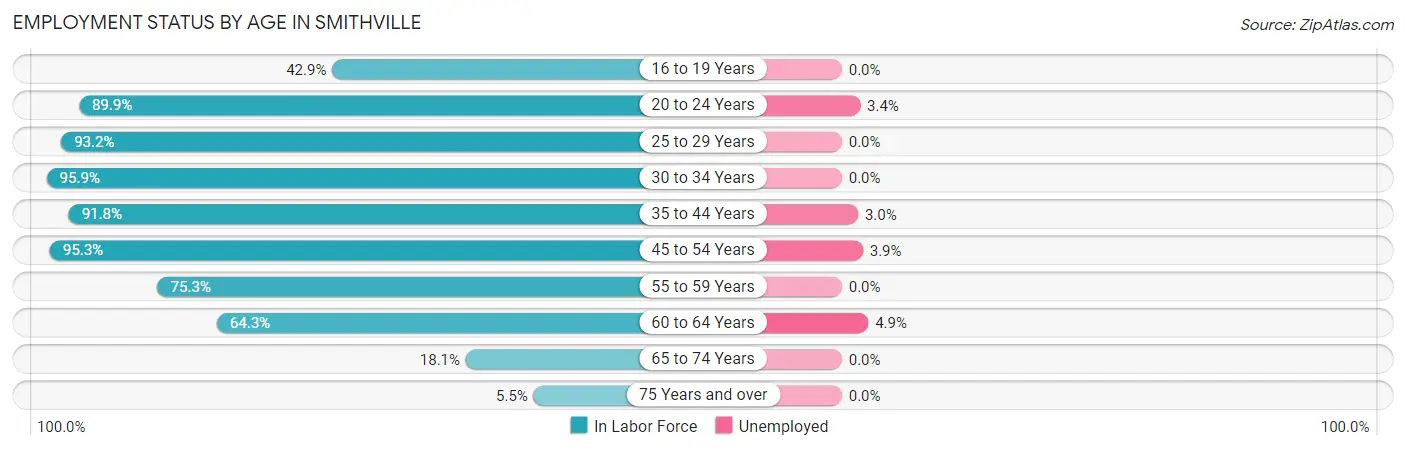
| Age Bracket | In Labor Force | Unemployed |
| 16 to 19 Years | 18 (42.9%) | 0 (0.0%) |
| 20 to 24 Years | 89 (89.9%) | 3 (3.4%) |
| 25 to 29 Years | 55 (93.2%) | 0 (0.0%) |
| 30 to 34 Years | 70 (95.9%) | 0 (0.0%) |
| 35 to 44 Years | 135 (91.8%) | 4 (3.0%) |
| 45 to 54 Years | 102 (95.3%) | 4 (3.9%) |
| 55 to 59 Years | 58 (75.3%) | 0 (0.0%) |
| 60 to 64 Years | 81 (64.3%) | 4 (4.9%) |
| 65 to 74 Years | 37 (18.1%) | 0 (0.0%) |
| 75 Years and over | 6 (5.5%) | 0 (0.0%) |
| Total | 651 (62.4%) | 15 (2.3%) |
Employment Status by Educational Attainment in Smithville
According to labor force statistics for Smithville, 85.1% of individuals (501) out of the total population between 25 and 64 years of age (589) are in the labor force, with 2.4% or 12 of them being unemployed. The group with the highest labor force participation rate are those with the educational attainment of less than high school, with 91.7% or 11 individuals in the labor force. Within the labor force, individuals with college / associate degree education have the highest percentage of unemployment, with 5.2% or 8 of them being unemployed.
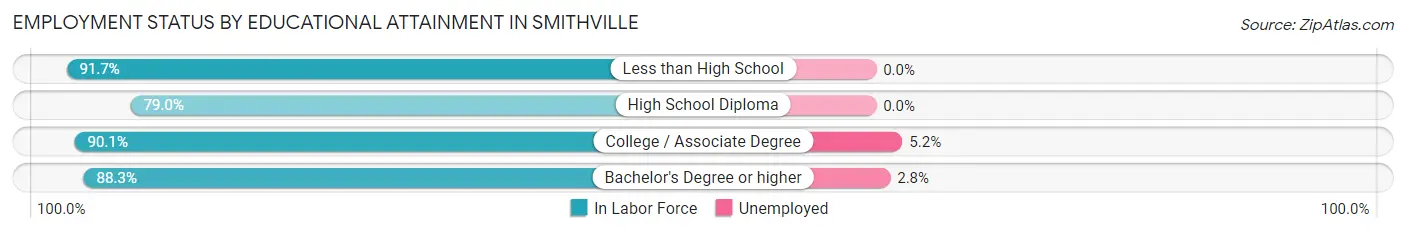
| Educational Attainment | In Labor Force | Unemployed |
| Less than High School | 11 (91.7%) | 0 (0.0%) |
| High School Diploma | 192 (79.0%) | 0 (0.0%) |
| College / Associate Degree | 155 (90.1%) | 9 (5.2%) |
| Bachelor's Degree or higher | 143 (88.3%) | 5 (2.8%) |
| Total | 501 (85.1%) | 14 (2.4%) |
Employment Occupations by Sex in Smithville
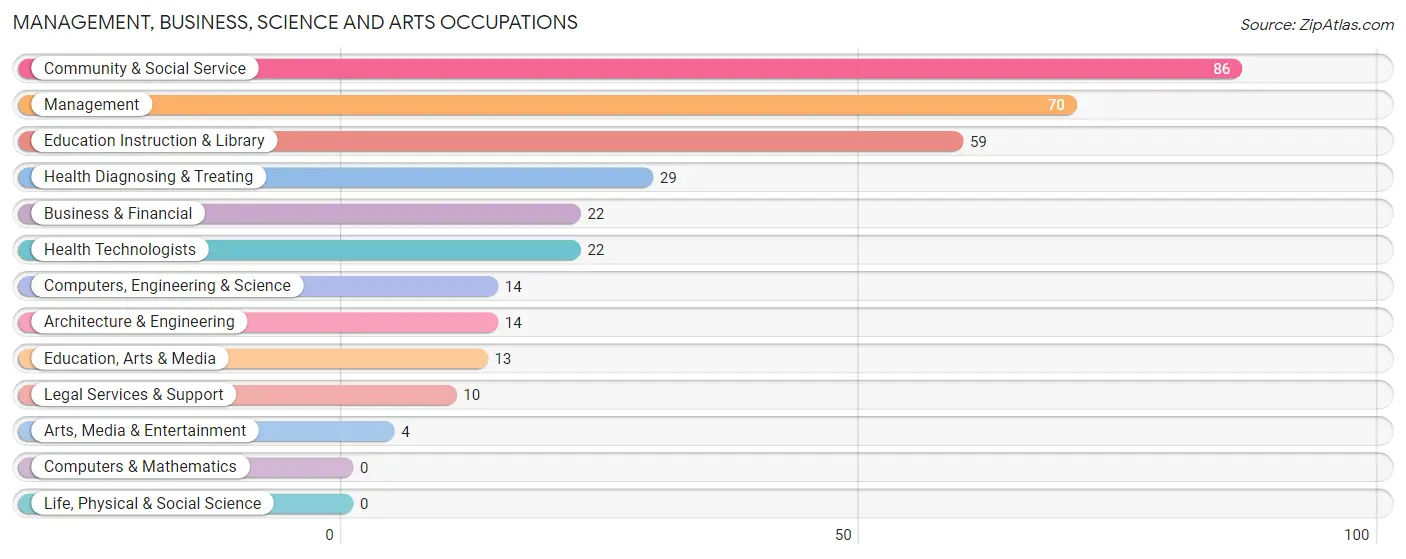
Management, Business, Science and Arts Occupations
The most common Management, Business, Science and Arts occupations in Smithville are Community & Social Service (86 | 13.5%), Management (70 | 11.0%), Education Instruction & Library (59 | 9.3%), Health Diagnosing & Treating (29 | 4.6%), and Business & Financial (22 | 3.5%).
Management, Business, Science and Arts Occupations by Sex
Within the Management, Business, Science and Arts occupations in Smithville, the most male-oriented occupations are Computers, Engineering & Science (100.0%), Architecture & Engineering (100.0%), and Education, Arts & Media (100.0%), while the most female-oriented occupations are Arts, Media & Entertainment (100.0%), Health Diagnosing & Treating (75.9%), and Health Technologists (68.2%).
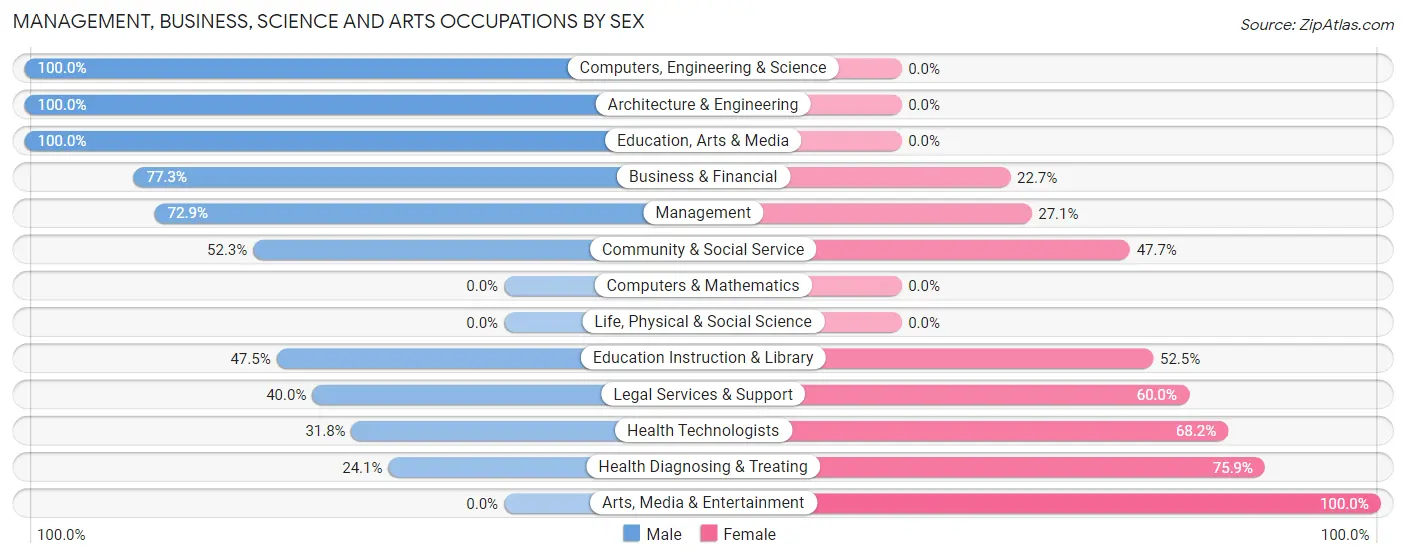
| Occupation | Male | Female |
| Management | 51 (72.9%) | 19 (27.1%) |
| Business & Financial | 17 (77.3%) | 5 (22.7%) |
| Computers, Engineering & Science | 14 (100.0%) | 0 (0.0%) |
| Computers & Mathematics | 0 (0.0%) | 0 (0.0%) |
| Architecture & Engineering | 14 (100.0%) | 0 (0.0%) |
| Life, Physical & Social Science | 0 (0.0%) | 0 (0.0%) |
| Community & Social Service | 45 (52.3%) | 41 (47.7%) |
| Education, Arts & Media | 13 (100.0%) | 0 (0.0%) |
| Legal Services & Support | 4 (40.0%) | 6 (60.0%) |
| Education Instruction & Library | 28 (47.5%) | 31 (52.5%) |
| Arts, Media & Entertainment | 0 (0.0%) | 4 (100.0%) |
| Health Diagnosing & Treating | 7 (24.1%) | 22 (75.9%) |
| Health Technologists | 7 (31.8%) | 15 (68.2%) |
| Total (Category) | 134 (60.6%) | 87 (39.4%) |
| Total (Overall) | 366 (57.6%) | 270 (42.4%) |
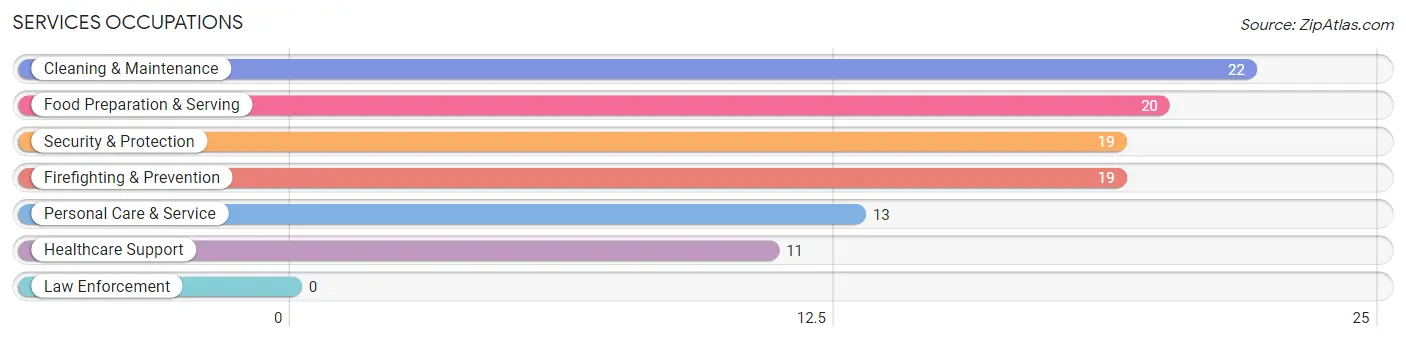
Services Occupations
The most common Services occupations in Smithville are Cleaning & Maintenance (22 | 3.5%), Food Preparation & Serving (20 | 3.1%), Security & Protection (19 | 3.0%), Firefighting & Prevention (19 | 3.0%), and Personal Care & Service (13 | 2.0%).
Services Occupations by Sex
Within the Services occupations in Smithville, the most male-oriented occupations are Security & Protection (100.0%), Firefighting & Prevention (100.0%), and Cleaning & Maintenance (45.5%), while the most female-oriented occupations are Healthcare Support (100.0%), Personal Care & Service (100.0%), and Food Preparation & Serving (65.0%).
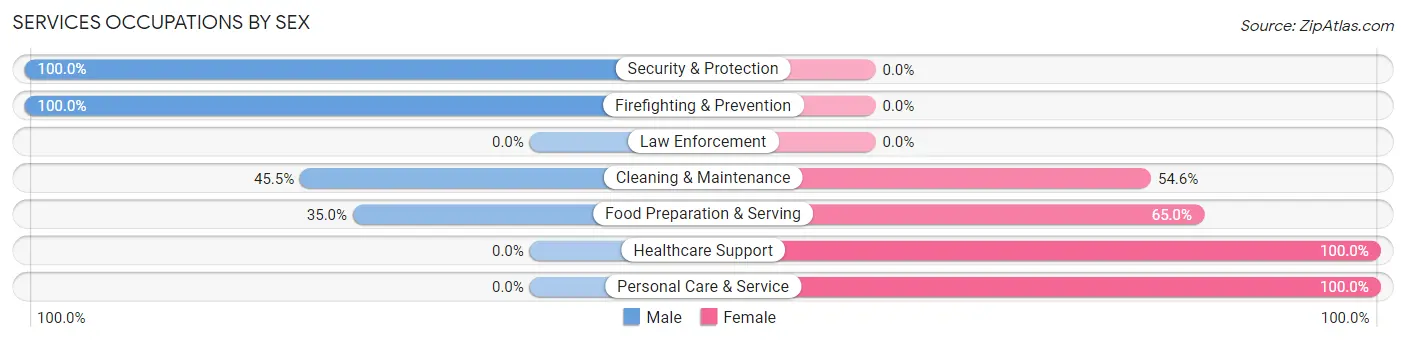
| Occupation | Male | Female |
| Healthcare Support | 0 (0.0%) | 11 (100.0%) |
| Security & Protection | 19 (100.0%) | 0 (0.0%) |
| Firefighting & Prevention | 19 (100.0%) | 0 (0.0%) |
| Law Enforcement | 0 (0.0%) | 0 (0.0%) |
| Food Preparation & Serving | 7 (35.0%) | 13 (65.0%) |
| Cleaning & Maintenance | 10 (45.5%) | 12 (54.5%) |
| Personal Care & Service | 0 (0.0%) | 13 (100.0%) |
| Total (Category) | 36 (42.3%) | 49 (57.7%) |
| Total (Overall) | 366 (57.6%) | 270 (42.4%) |
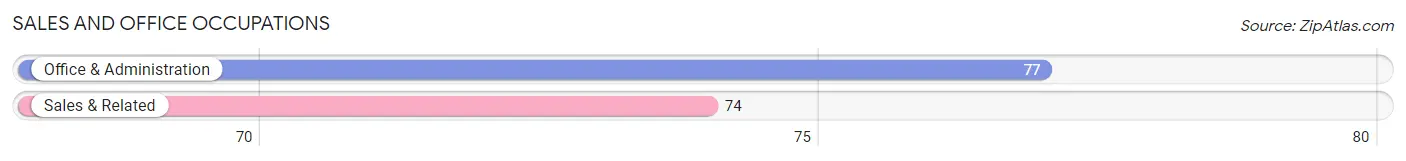
Sales and Office Occupations
The most common Sales and Office occupations in Smithville are Office & Administration (77 | 12.1%), and Sales & Related (74 | 11.6%).
Sales and Office Occupations by Sex
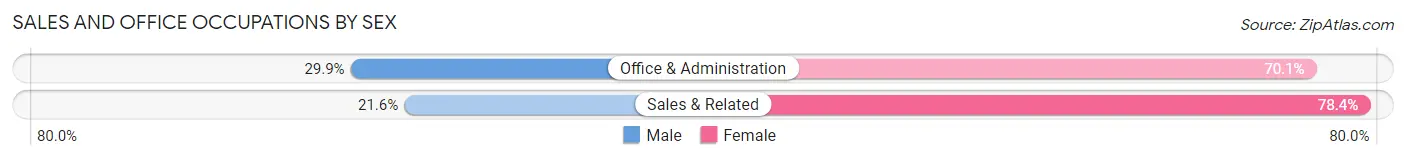
| Occupation | Male | Female |
| Sales & Related | 16 (21.6%) | 58 (78.4%) |
| Office & Administration | 23 (29.9%) | 54 (70.1%) |
| Total (Category) | 39 (25.8%) | 112 (74.2%) |
| Total (Overall) | 366 (57.6%) | 270 (42.4%) |
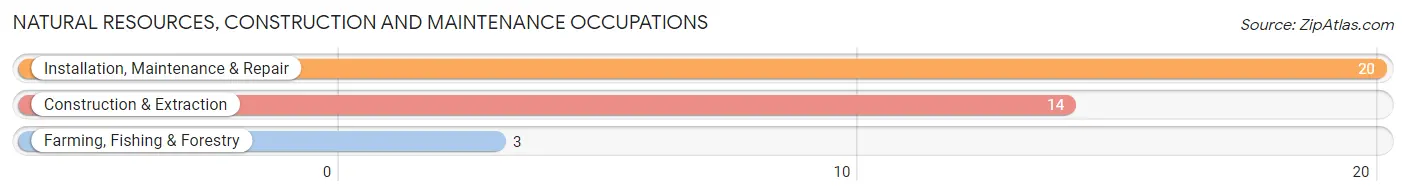
Natural Resources, Construction and Maintenance Occupations
The most common Natural Resources, Construction and Maintenance occupations in Smithville are Installation, Maintenance & Repair (20 | 3.1%), Construction & Extraction (14 | 2.2%), and Farming, Fishing & Forestry (3 | 0.5%).
Natural Resources, Construction and Maintenance Occupations by Sex
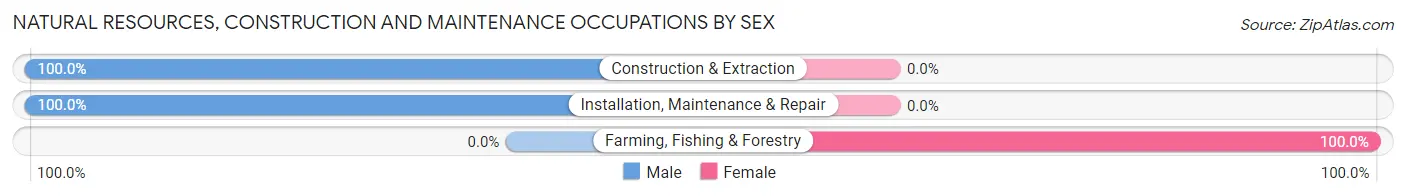
| Occupation | Male | Female |
| Farming, Fishing & Forestry | 0 (0.0%) | 3 (100.0%) |
| Construction & Extraction | 14 (100.0%) | 0 (0.0%) |
| Installation, Maintenance & Repair | 20 (100.0%) | 0 (0.0%) |
| Total (Category) | 34 (91.9%) | 3 (8.1%) |
| Total (Overall) | 366 (57.6%) | 270 (42.4%) |
Production, Transportation and Moving Occupations
The most common Production, Transportation and Moving occupations in Smithville are Production (65 | 10.2%), Material Moving (41 | 6.5%), and Transportation (36 | 5.7%).
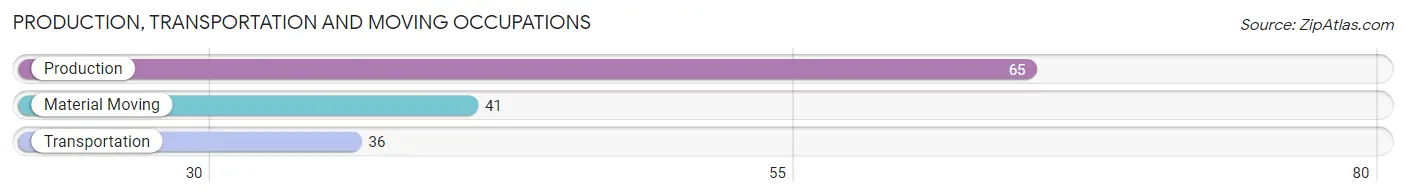
Production, Transportation and Moving Occupations by Sex
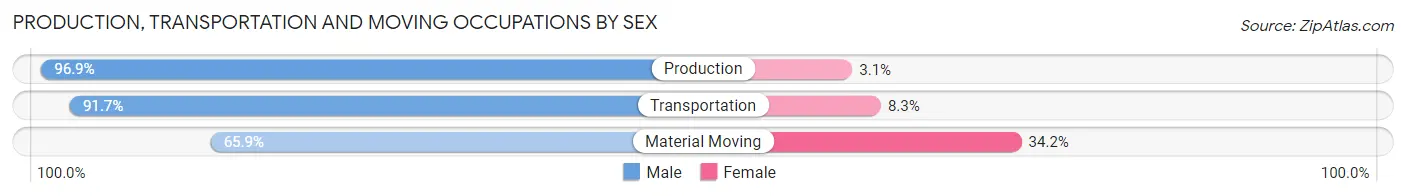
| Occupation | Male | Female |
| Production | 63 (96.9%) | 2 (3.1%) |
| Transportation | 33 (91.7%) | 3 (8.3%) |
| Material Moving | 27 (65.8%) | 14 (34.2%) |
| Total (Category) | 123 (86.6%) | 19 (13.4%) |
| Total (Overall) | 366 (57.6%) | 270 (42.4%) |
Employment Industries by Sex in Smithville
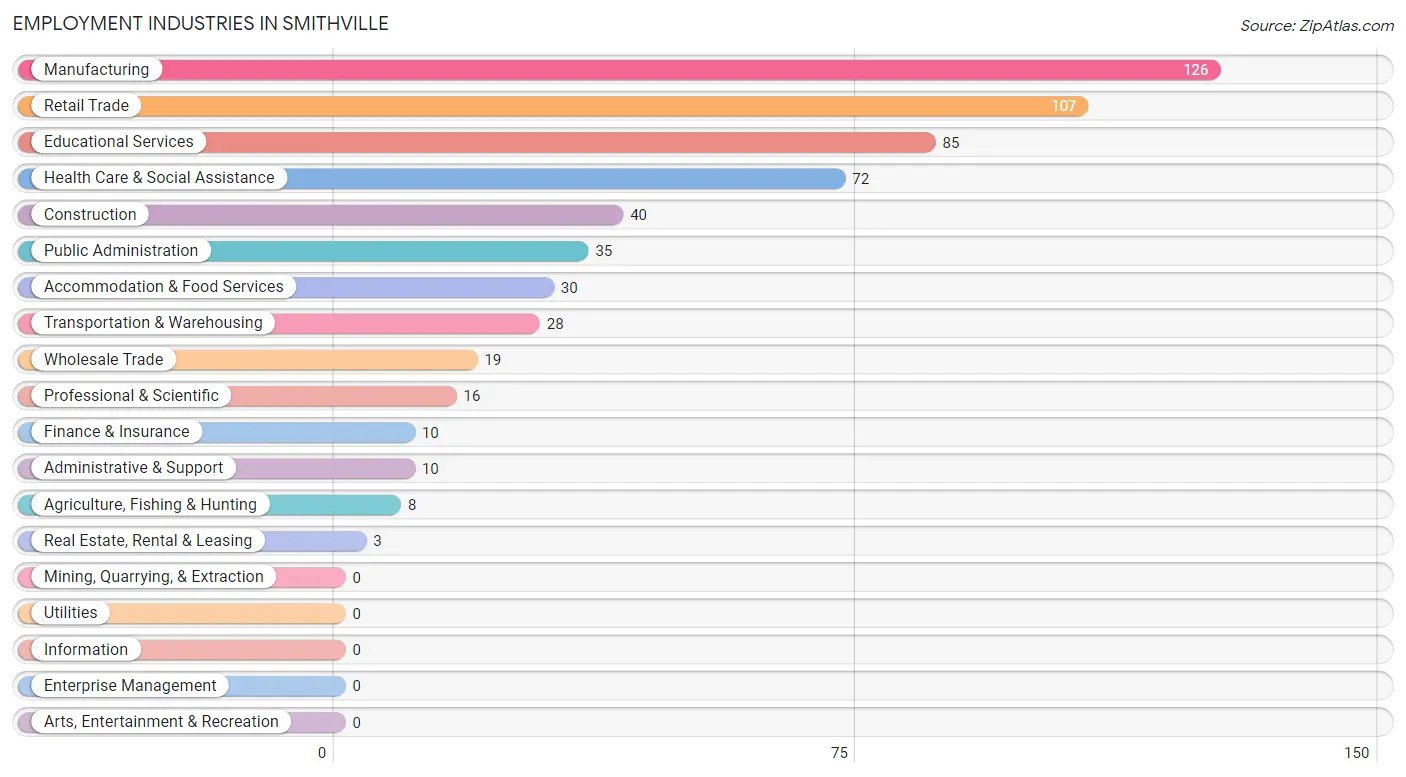
Employment Industries in Smithville
The major employment industries in Smithville include Manufacturing (126 | 19.8%), Retail Trade (107 | 16.8%), Educational Services (85 | 13.4%), Health Care & Social Assistance (72 | 11.3%), and Construction (40 | 6.3%).
Employment Industries by Sex in Smithville
The Smithville industries that see more men than women are Wholesale Trade (100.0%), Transportation & Warehousing (100.0%), and Manufacturing (82.5%), whereas the industries that tend to have a higher number of women are Finance & Insurance (100.0%), Real Estate, Rental & Leasing (100.0%), and Health Care & Social Assistance (83.3%).
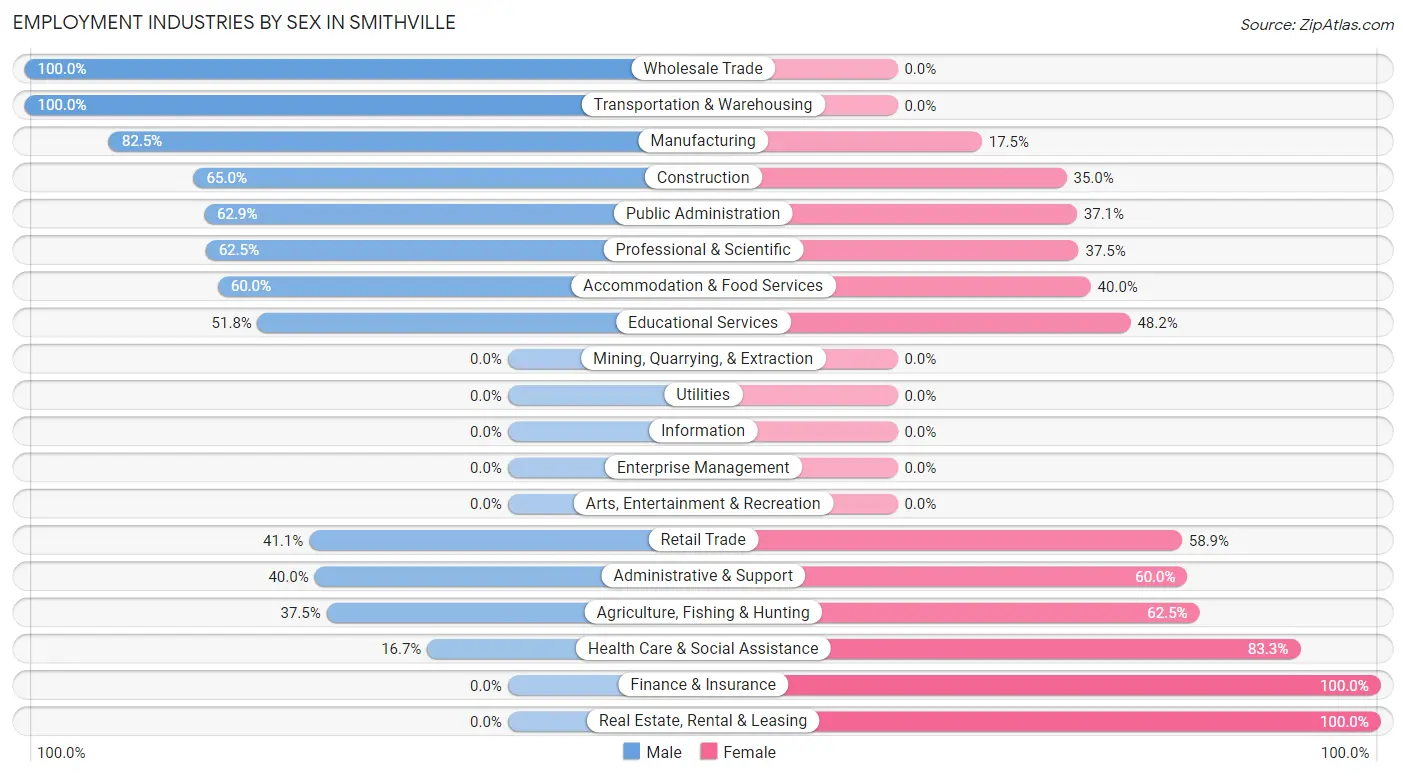
| Industry | Male | Female |
| Agriculture, Fishing & Hunting | 3 (37.5%) | 5 (62.5%) |
| Mining, Quarrying, & Extraction | 0 (0.0%) | 0 (0.0%) |
| Construction | 26 (65.0%) | 14 (35.0%) |
| Manufacturing | 104 (82.5%) | 22 (17.5%) |
| Wholesale Trade | 19 (100.0%) | 0 (0.0%) |
| Retail Trade | 44 (41.1%) | 63 (58.9%) |
| Transportation & Warehousing | 28 (100.0%) | 0 (0.0%) |
| Utilities | 0 (0.0%) | 0 (0.0%) |
| Information | 0 (0.0%) | 0 (0.0%) |
| Finance & Insurance | 0 (0.0%) | 10 (100.0%) |
| Real Estate, Rental & Leasing | 0 (0.0%) | 3 (100.0%) |
| Professional & Scientific | 10 (62.5%) | 6 (37.5%) |
| Enterprise Management | 0 (0.0%) | 0 (0.0%) |
| Administrative & Support | 4 (40.0%) | 6 (60.0%) |
| Educational Services | 44 (51.8%) | 41 (48.2%) |
| Health Care & Social Assistance | 12 (16.7%) | 60 (83.3%) |
| Arts, Entertainment & Recreation | 0 (0.0%) | 0 (0.0%) |
| Accommodation & Food Services | 18 (60.0%) | 12 (40.0%) |
| Public Administration | 22 (62.9%) | 13 (37.1%) |
| Total | 366 (57.6%) | 270 (42.4%) |
Education in Smithville
School Enrollment in Smithville
The most common levels of schooling among the 310 students in Smithville are middle school (88 | 28.4%), high school (78 | 25.2%), and elementary school (66 | 21.3%).
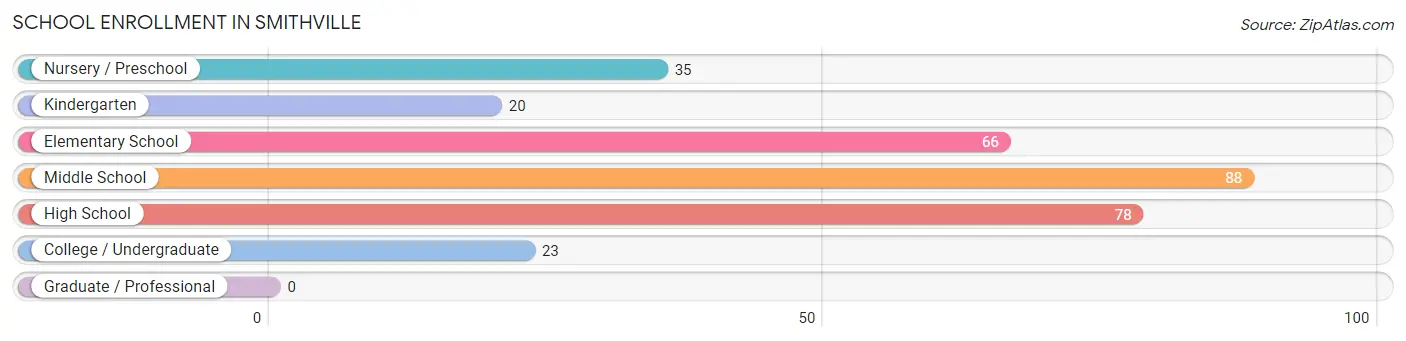
| School Level | # Students | % Students |
| Nursery / Preschool | 35 | 11.3% |
| Kindergarten | 20 | 6.5% |
| Elementary School | 66 | 21.3% |
| Middle School | 88 | 28.4% |
| High School | 78 | 25.2% |
| College / Undergraduate | 23 | 7.4% |
| Graduate / Professional | 0 | 0.0% |
| Total | 310 | 100.0% |
School Enrollment by Age by Funding Source in Smithville
Out of a total of 310 students who are enrolled in schools in Smithville, 41 (13.2%) attend a private institution, while the remaining 269 (86.8%) are enrolled in public schools. The age group of 3 to 4 year olds has the highest likelihood of being enrolled in private schools, with 12 (44.4% in the age bracket) enrolled. Conversely, the age group of 15 to 17 year olds has the lowest likelihood of being enrolled in a private school, with 57 (100.0% in the age bracket) attending a public institution.
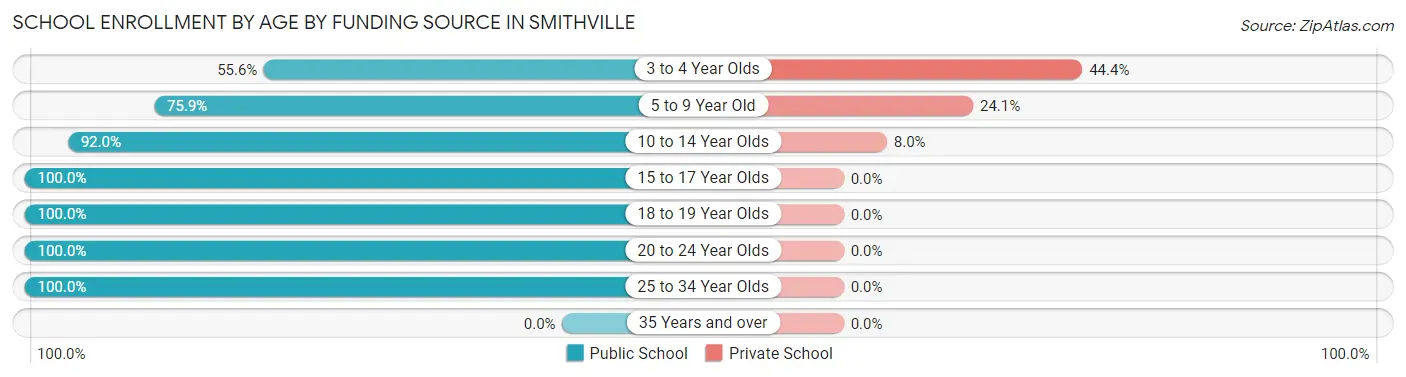
| Age Bracket | Public School | Private School |
| 3 to 4 Year Olds | 15 (55.6%) | 12 (44.4%) |
| 5 to 9 Year Old | 63 (75.9%) | 20 (24.1%) |
| 10 to 14 Year Olds | 103 (92.0%) | 9 (8.0%) |
| 15 to 17 Year Olds | 57 (100.0%) | 0 (0.0%) |
| 18 to 19 Year Olds | 3 (100.0%) | 0 (0.0%) |
| 20 to 24 Year Olds | 24 (100.0%) | 0 (0.0%) |
| 25 to 34 Year Olds | 4 (100.0%) | 0 (0.0%) |
| 35 Years and over | 0 (0.0%) | 0 (0.0%) |
| Total | 269 (86.8%) | 41 (13.2%) |
Educational Attainment by Field of Study in Smithville
Education (123 | 40.6%), business (31 | 10.2%), visual & performing arts (27 | 8.9%), science & technology (25 | 8.3%), and liberal arts & history (18 | 5.9%) are the most common fields of study among 303 individuals in Smithville who have obtained a bachelor's degree or higher.
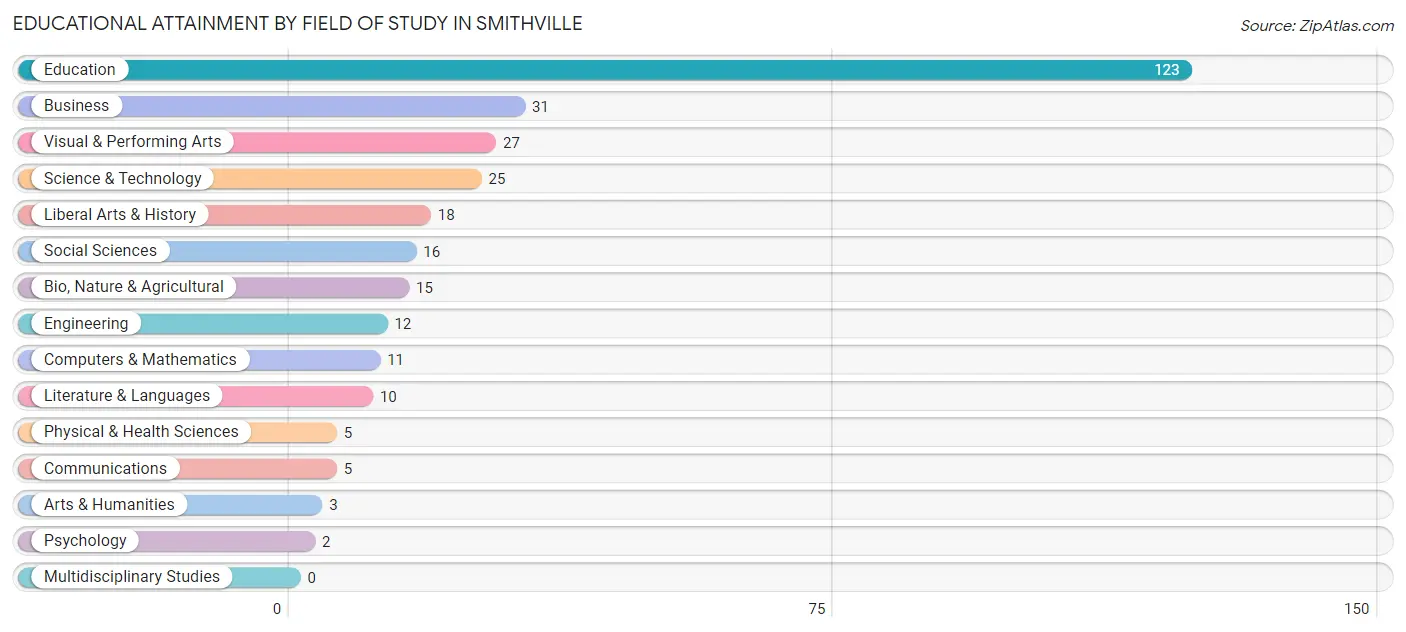
| Field of Study | # Graduates | % Graduates |
| Computers & Mathematics | 11 | 3.6% |
| Bio, Nature & Agricultural | 15 | 5.0% |
| Physical & Health Sciences | 5 | 1.7% |
| Psychology | 2 | 0.7% |
| Social Sciences | 16 | 5.3% |
| Engineering | 12 | 4.0% |
| Multidisciplinary Studies | 0 | 0.0% |
| Science & Technology | 25 | 8.3% |
| Business | 31 | 10.2% |
| Education | 123 | 40.6% |
| Literature & Languages | 10 | 3.3% |
| Liberal Arts & History | 18 | 5.9% |
| Visual & Performing Arts | 27 | 8.9% |
| Communications | 5 | 1.7% |
| Arts & Humanities | 3 | 1.0% |
| Total | 303 | 100.0% |
Transportation & Commute in Smithville
Vehicle Availability by Sex in Smithville
The most prevalent vehicle ownership categories in Smithville are males with 2 vehicles (226, accounting for 61.8%) and females with 2 vehicles (139, making up 85.3%).
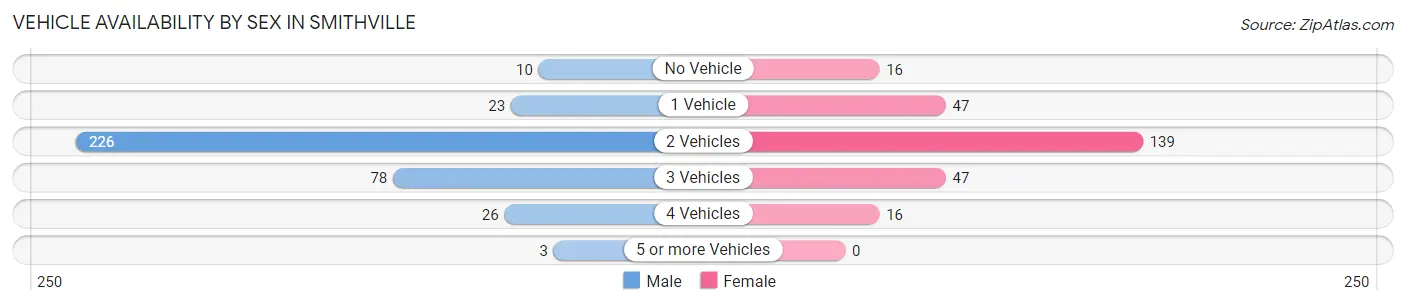
| Vehicles Available | Male | Female |
| No Vehicle | 10 (2.7%) | 16 (6.0%) |
| 1 Vehicle | 23 (6.3%) | 47 (17.7%) |
| 2 Vehicles | 226 (61.8%) | 139 (52.4%) |
| 3 Vehicles | 78 (21.3%) | 47 (17.7%) |
| 4 Vehicles | 26 (7.1%) | 16 (6.0%) |
| 5 or more Vehicles | 3 (0.8%) | 0 (0.0%) |
| Total | 366 (100.0%) | 265 (100.0%) |
Commute Time in Smithville
The most frequently occuring commute durations in Smithville are 15 to 19 minutes (145 commuters, 25.3%), 10 to 14 minutes (124 commuters, 21.6%), and 20 to 24 minutes (70 commuters, 12.2%).
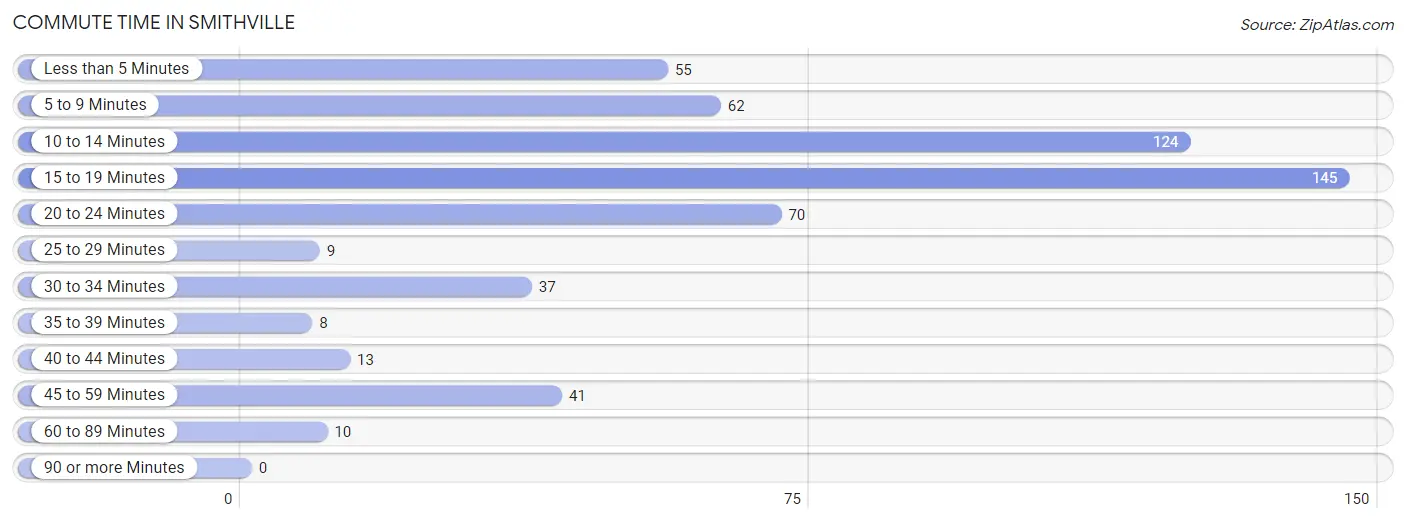
| Commute Time | # Commuters | % Commuters |
| Less than 5 Minutes | 55 | 9.6% |
| 5 to 9 Minutes | 62 | 10.8% |
| 10 to 14 Minutes | 124 | 21.6% |
| 15 to 19 Minutes | 145 | 25.3% |
| 20 to 24 Minutes | 70 | 12.2% |
| 25 to 29 Minutes | 9 | 1.6% |
| 30 to 34 Minutes | 37 | 6.5% |
| 35 to 39 Minutes | 8 | 1.4% |
| 40 to 44 Minutes | 13 | 2.3% |
| 45 to 59 Minutes | 41 | 7.1% |
| 60 to 89 Minutes | 10 | 1.7% |
| 90 or more Minutes | 0 | 0.0% |
Commute Time by Sex in Smithville
The most common commute times in Smithville are 15 to 19 minutes (88 commuters, 26.2%) for males and 15 to 19 minutes (57 commuters, 23.9%) for females.
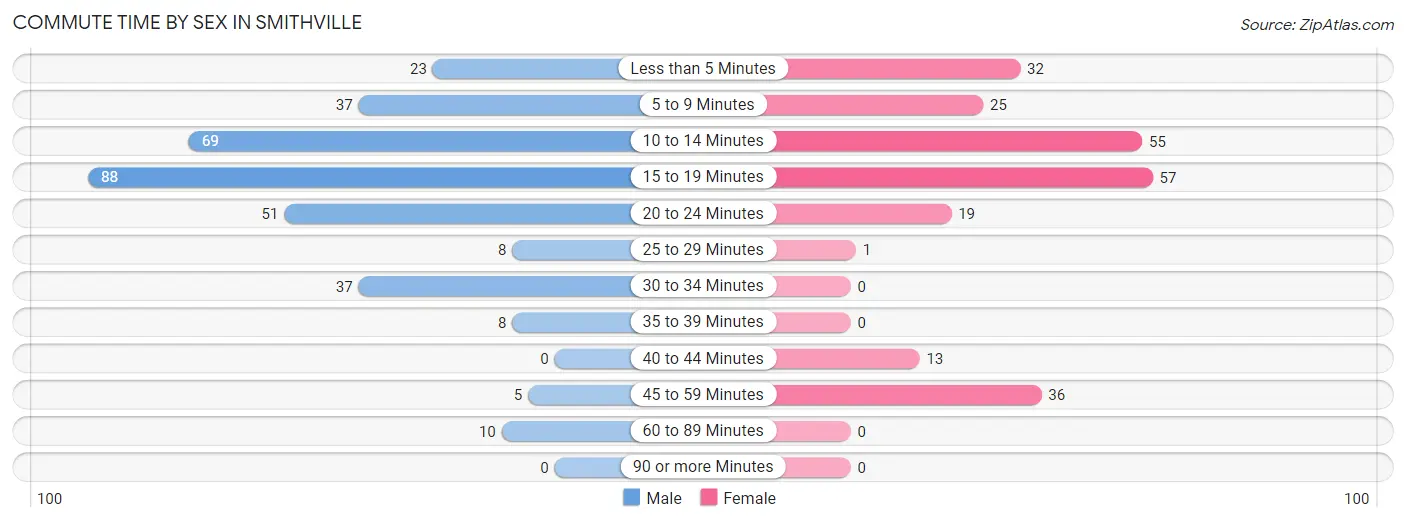
| Commute Time | Male | Female |
| Less than 5 Minutes | 23 (6.9%) | 32 (13.5%) |
| 5 to 9 Minutes | 37 (11.0%) | 25 (10.5%) |
| 10 to 14 Minutes | 69 (20.5%) | 55 (23.1%) |
| 15 to 19 Minutes | 88 (26.2%) | 57 (23.9%) |
| 20 to 24 Minutes | 51 (15.2%) | 19 (8.0%) |
| 25 to 29 Minutes | 8 (2.4%) | 1 (0.4%) |
| 30 to 34 Minutes | 37 (11.0%) | 0 (0.0%) |
| 35 to 39 Minutes | 8 (2.4%) | 0 (0.0%) |
| 40 to 44 Minutes | 0 (0.0%) | 13 (5.5%) |
| 45 to 59 Minutes | 5 (1.5%) | 36 (15.1%) |
| 60 to 89 Minutes | 10 (3.0%) | 0 (0.0%) |
| 90 or more Minutes | 0 (0.0%) | 0 (0.0%) |
Time of Departure to Work by Sex in Smithville
The most frequent times of departure to work in Smithville are 6:30 AM to 6:59 AM (67, 19.9%) for males and 6:30 AM to 6:59 AM (61, 25.6%) for females.
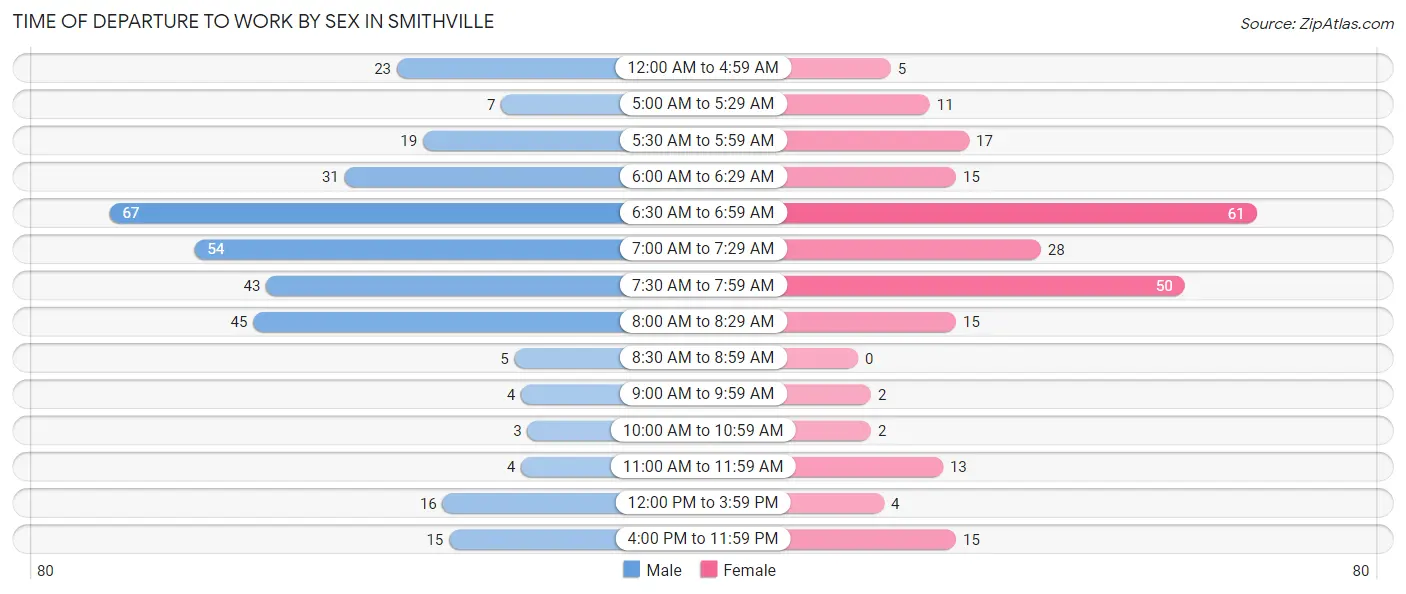
| Time of Departure | Male | Female |
| 12:00 AM to 4:59 AM | 23 (6.9%) | 5 (2.1%) |
| 5:00 AM to 5:29 AM | 7 (2.1%) | 11 (4.6%) |
| 5:30 AM to 5:59 AM | 19 (5.7%) | 17 (7.1%) |
| 6:00 AM to 6:29 AM | 31 (9.2%) | 15 (6.3%) |
| 6:30 AM to 6:59 AM | 67 (19.9%) | 61 (25.6%) |
| 7:00 AM to 7:29 AM | 54 (16.1%) | 28 (11.8%) |
| 7:30 AM to 7:59 AM | 43 (12.8%) | 50 (21.0%) |
| 8:00 AM to 8:29 AM | 45 (13.4%) | 15 (6.3%) |
| 8:30 AM to 8:59 AM | 5 (1.5%) | 0 (0.0%) |
| 9:00 AM to 9:59 AM | 4 (1.2%) | 2 (0.8%) |
| 10:00 AM to 10:59 AM | 3 (0.9%) | 2 (0.8%) |
| 11:00 AM to 11:59 AM | 4 (1.2%) | 13 (5.5%) |
| 12:00 PM to 3:59 PM | 16 (4.8%) | 4 (1.7%) |
| 4:00 PM to 11:59 PM | 15 (4.5%) | 15 (6.3%) |
| Total | 336 (100.0%) | 238 (100.0%) |
Housing Occupancy in Smithville
Occupancy by Ownership in Smithville
Of the total 560 dwellings in Smithville, owner-occupied units account for 413 (73.8%), while renter-occupied units make up 147 (26.3%).
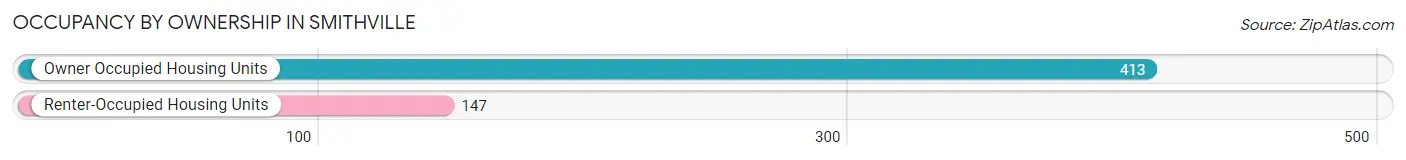
| Occupancy | # Housing Units | % Housing Units |
| Owner Occupied Housing Units | 413 | 73.8% |
| Renter-Occupied Housing Units | 147 | 26.3% |
| Total Occupied Housing Units | 560 | 100.0% |
Occupancy by Household Size in Smithville
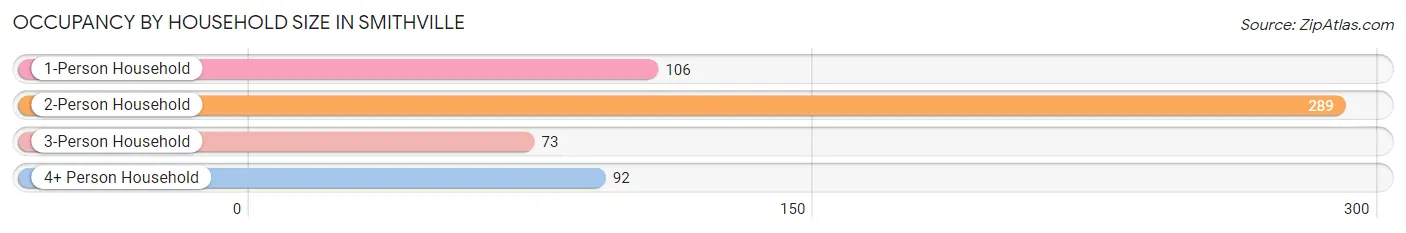
| Household Size | # Housing Units | % Housing Units |
| 1-Person Household | 106 | 18.9% |
| 2-Person Household | 289 | 51.6% |
| 3-Person Household | 73 | 13.0% |
| 4+ Person Household | 92 | 16.4% |
| Total Housing Units | 560 | 100.0% |
Occupancy by Ownership by Household Size in Smithville
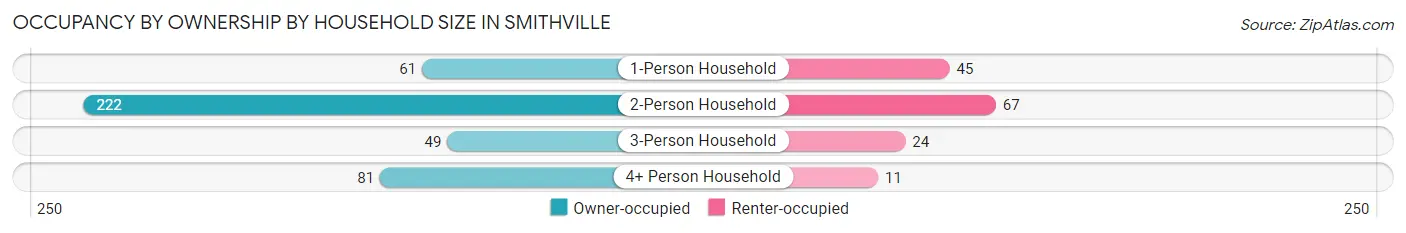
| Household Size | Owner-occupied | Renter-occupied |
| 1-Person Household | 61 (57.6%) | 45 (42.4%) |
| 2-Person Household | 222 (76.8%) | 67 (23.2%) |
| 3-Person Household | 49 (67.1%) | 24 (32.9%) |
| 4+ Person Household | 81 (88.0%) | 11 (12.0%) |
| Total Housing Units | 413 (73.8%) | 147 (26.3%) |
Occupancy by Educational Attainment in Smithville
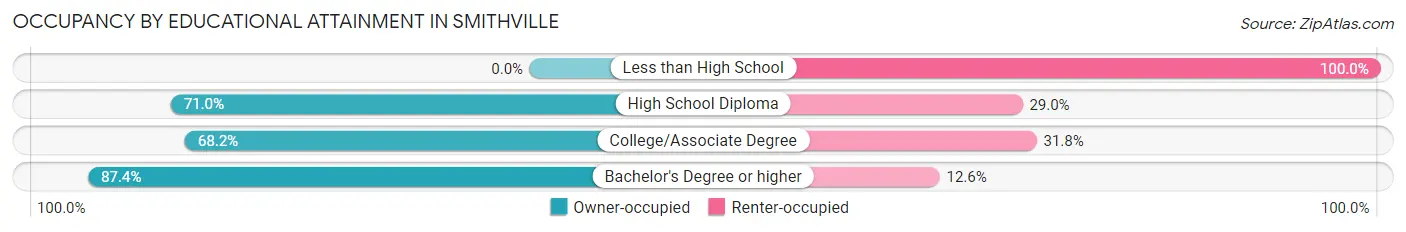
| Household Size | Owner-occupied | Renter-occupied |
| Less than High School | 0 (0.0%) | 12 (100.0%) |
| High School Diploma | 142 (71.0%) | 58 (29.0%) |
| College/Associate Degree | 118 (68.2%) | 55 (31.8%) |
| Bachelor's Degree or higher | 153 (87.4%) | 22 (12.6%) |
Occupancy by Age of Householder in Smithville
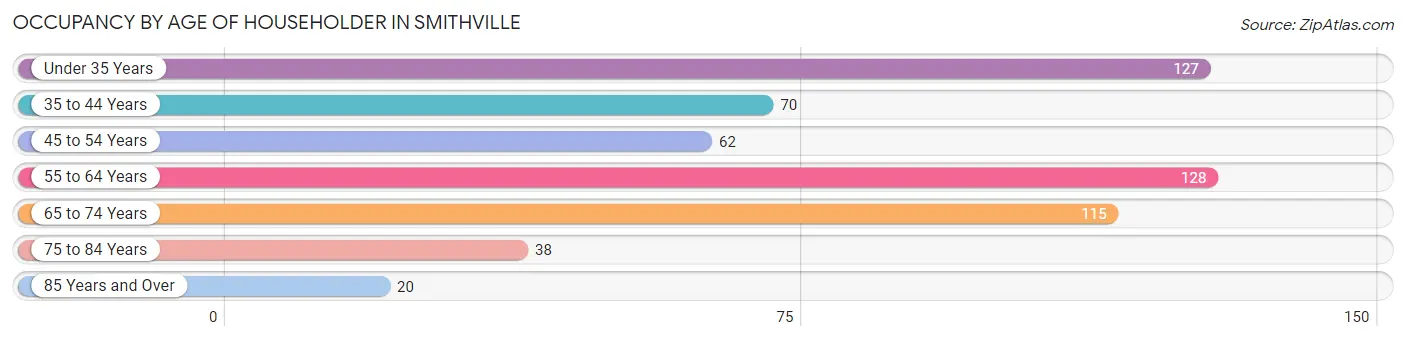
| Age Bracket | # Households | % Households |
| Under 35 Years | 127 | 22.7% |
| 35 to 44 Years | 70 | 12.5% |
| 45 to 54 Years | 62 | 11.1% |
| 55 to 64 Years | 128 | 22.9% |
| 65 to 74 Years | 115 | 20.5% |
| 75 to 84 Years | 38 | 6.8% |
| 85 Years and Over | 20 | 3.6% |
| Total | 560 | 100.0% |
Housing Finances in Smithville
Median Income by Occupancy in Smithville
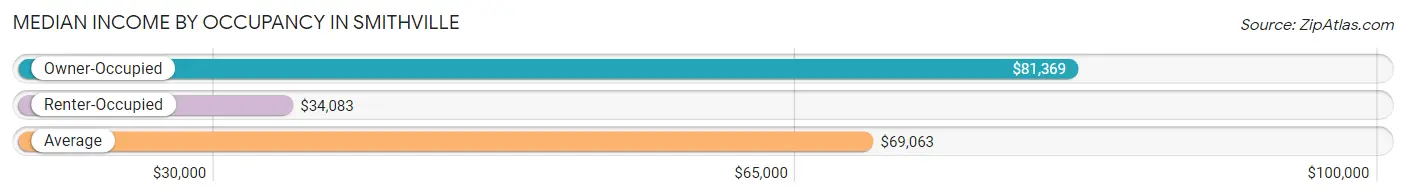
| Occupancy Type | # Households | Median Income |
| Owner-Occupied | 413 (73.8%) | $81,369 |
| Renter-Occupied | 147 (26.3%) | $34,083 |
| Average | 560 (100.0%) | $69,063 |
Occupancy by Householder Income Bracket in Smithville
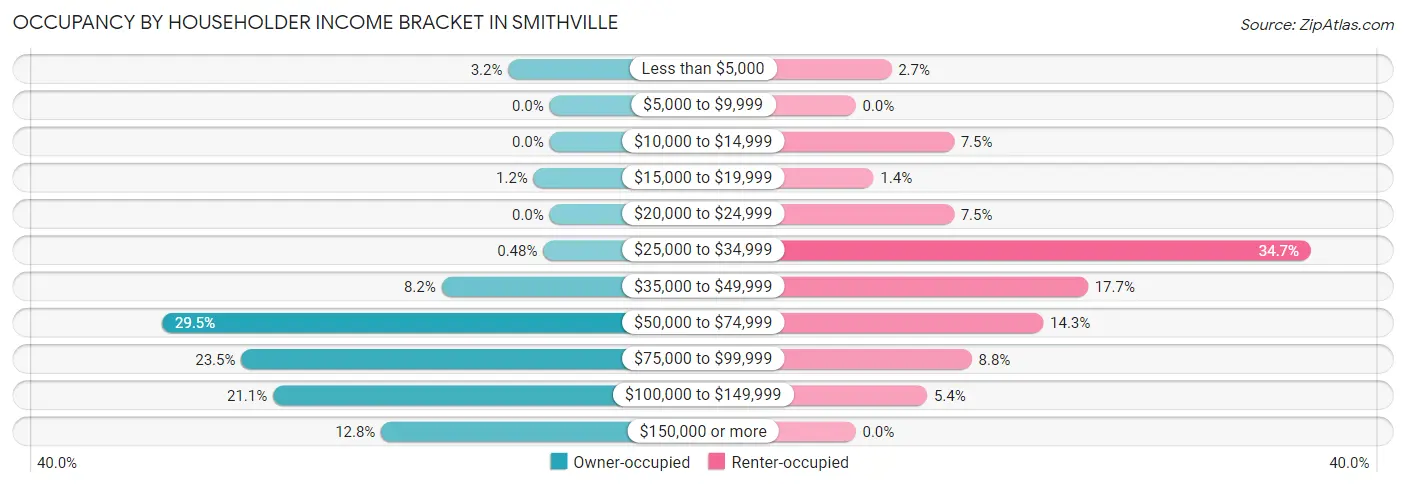
| Income Bracket | Owner-occupied | Renter-occupied |
| Less than $5,000 | 13 (3.2%) | 4 (2.7%) |
| $5,000 to $9,999 | 0 (0.0%) | 0 (0.0%) |
| $10,000 to $14,999 | 0 (0.0%) | 11 (7.5%) |
| $15,000 to $19,999 | 5 (1.2%) | 2 (1.4%) |
| $20,000 to $24,999 | 0 (0.0%) | 11 (7.5%) |
| $25,000 to $34,999 | 2 (0.5%) | 51 (34.7%) |
| $35,000 to $49,999 | 34 (8.2%) | 26 (17.7%) |
| $50,000 to $74,999 | 122 (29.5%) | 21 (14.3%) |
| $75,000 to $99,999 | 97 (23.5%) | 13 (8.8%) |
| $100,000 to $149,999 | 87 (21.1%) | 8 (5.4%) |
| $150,000 or more | 53 (12.8%) | 0 (0.0%) |
| Total | 413 (100.0%) | 147 (100.0%) |
Monthly Housing Cost Tiers in Smithville
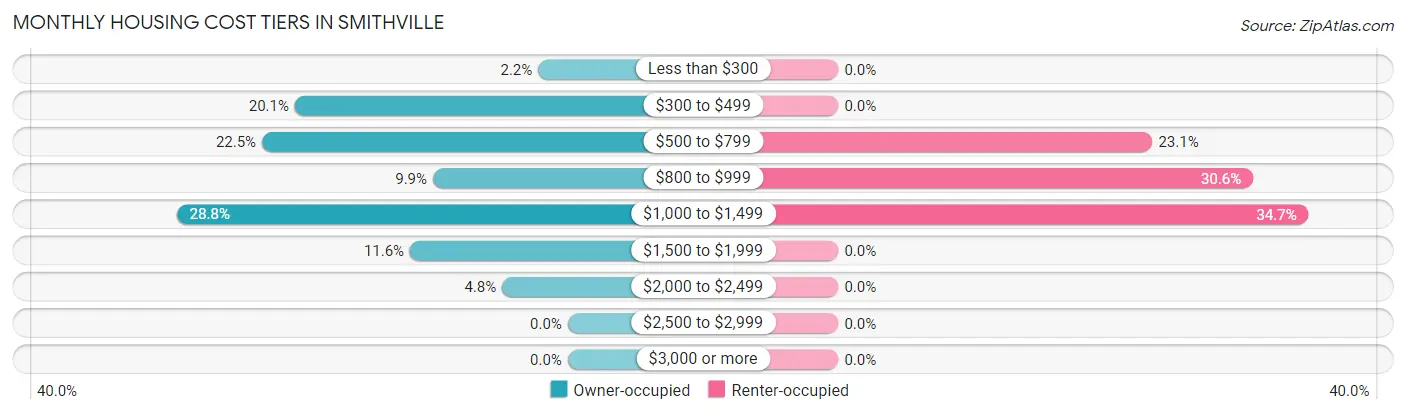
| Monthly Cost | Owner-occupied | Renter-occupied |
| Less than $300 | 9 (2.2%) | 0 (0.0%) |
| $300 to $499 | 83 (20.1%) | 0 (0.0%) |
| $500 to $799 | 93 (22.5%) | 34 (23.1%) |
| $800 to $999 | 41 (9.9%) | 45 (30.6%) |
| $1,000 to $1,499 | 119 (28.8%) | 51 (34.7%) |
| $1,500 to $1,999 | 48 (11.6%) | 0 (0.0%) |
| $2,000 to $2,499 | 20 (4.8%) | 0 (0.0%) |
| $2,500 to $2,999 | 0 (0.0%) | 0 (0.0%) |
| $3,000 or more | 0 (0.0%) | 0 (0.0%) |
| Total | 413 (100.0%) | 147 (100.0%) |
Physical Housing Characteristics in Smithville
Housing Structures in Smithville
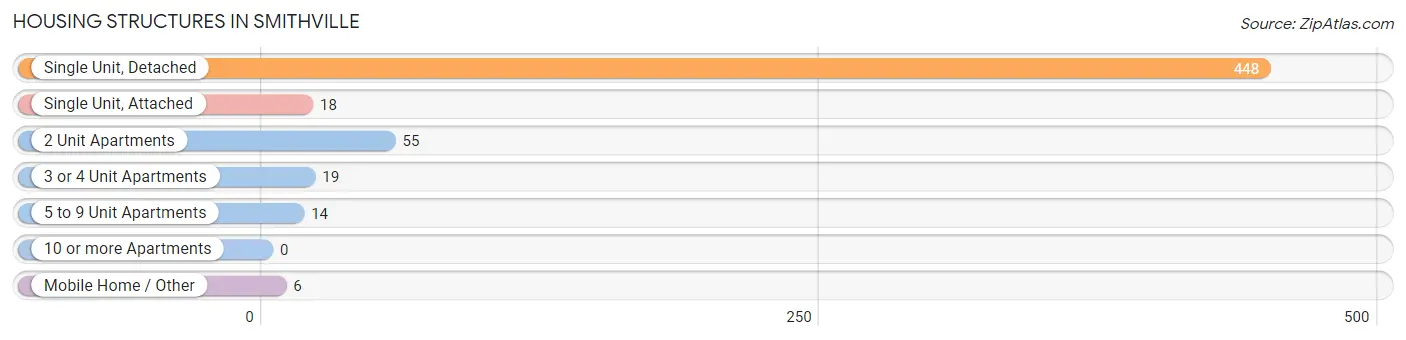
| Structure Type | # Housing Units | % Housing Units |
| Single Unit, Detached | 448 | 80.0% |
| Single Unit, Attached | 18 | 3.2% |
| 2 Unit Apartments | 55 | 9.8% |
| 3 or 4 Unit Apartments | 19 | 3.4% |
| 5 to 9 Unit Apartments | 14 | 2.5% |
| 10 or more Apartments | 0 | 0.0% |
| Mobile Home / Other | 6 | 1.1% |
| Total | 560 | 100.0% |
Housing Structures by Occupancy in Smithville
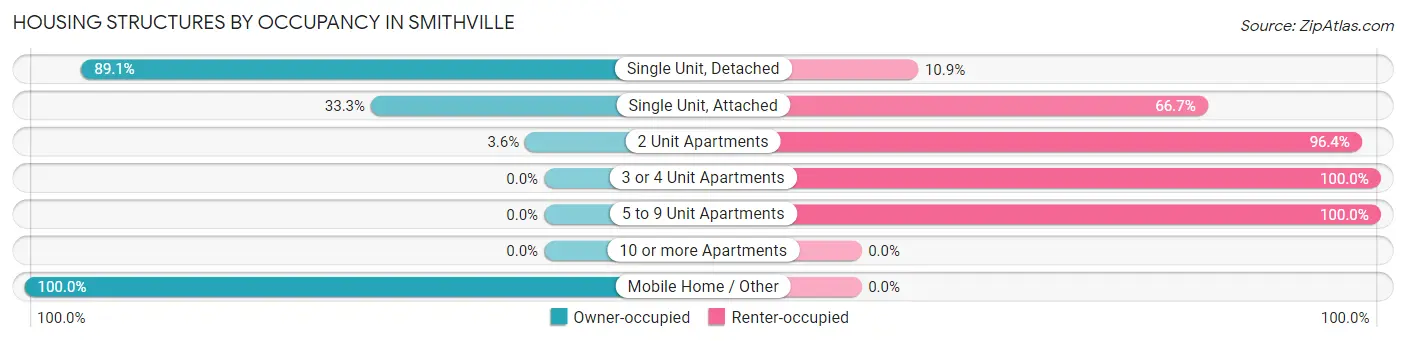
| Structure Type | Owner-occupied | Renter-occupied |
| Single Unit, Detached | 399 (89.1%) | 49 (10.9%) |
| Single Unit, Attached | 6 (33.3%) | 12 (66.7%) |
| 2 Unit Apartments | 2 (3.6%) | 53 (96.4%) |
| 3 or 4 Unit Apartments | 0 (0.0%) | 19 (100.0%) |
| 5 to 9 Unit Apartments | 0 (0.0%) | 14 (100.0%) |
| 10 or more Apartments | 0 (0.0%) | 0 (0.0%) |
| Mobile Home / Other | 6 (100.0%) | 0 (0.0%) |
| Total | 413 (73.8%) | 147 (26.3%) |
Housing Structures by Number of Rooms in Smithville
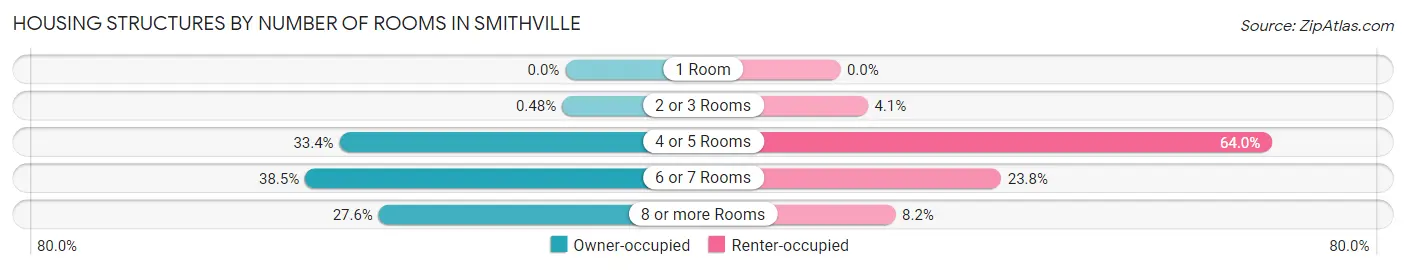
| Number of Rooms | Owner-occupied | Renter-occupied |
| 1 Room | 0 (0.0%) | 0 (0.0%) |
| 2 or 3 Rooms | 2 (0.5%) | 6 (4.1%) |
| 4 or 5 Rooms | 138 (33.4%) | 94 (63.9%) |
| 6 or 7 Rooms | 159 (38.5%) | 35 (23.8%) |
| 8 or more Rooms | 114 (27.6%) | 12 (8.2%) |
| Total | 413 (100.0%) | 147 (100.0%) |
Housing Structure by Heating Type in Smithville
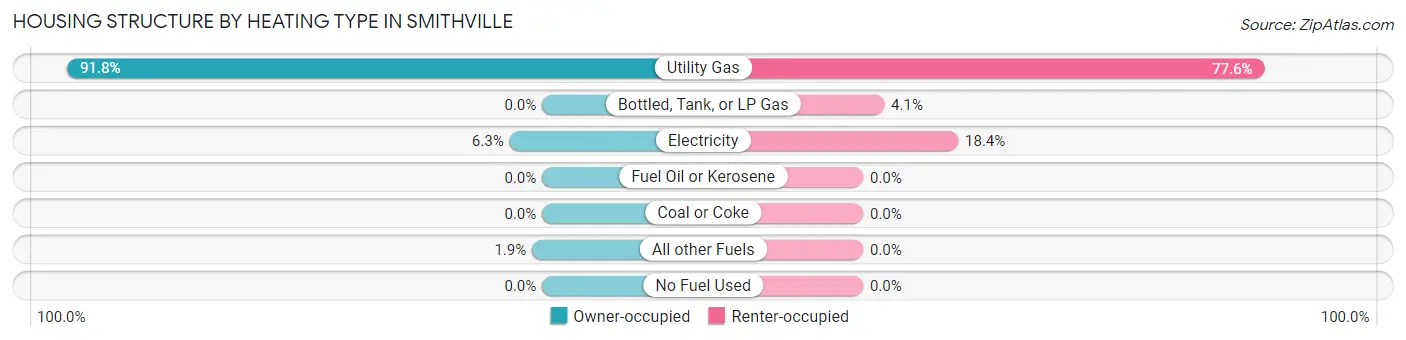
| Heating Type | Owner-occupied | Renter-occupied |
| Utility Gas | 379 (91.8%) | 114 (77.5%) |
| Bottled, Tank, or LP Gas | 0 (0.0%) | 6 (4.1%) |
| Electricity | 26 (6.3%) | 27 (18.4%) |
| Fuel Oil or Kerosene | 0 (0.0%) | 0 (0.0%) |
| Coal or Coke | 0 (0.0%) | 0 (0.0%) |
| All other Fuels | 8 (1.9%) | 0 (0.0%) |
| No Fuel Used | 0 (0.0%) | 0 (0.0%) |
| Total | 413 (100.0%) | 147 (100.0%) |
Household Vehicle Usage in Smithville
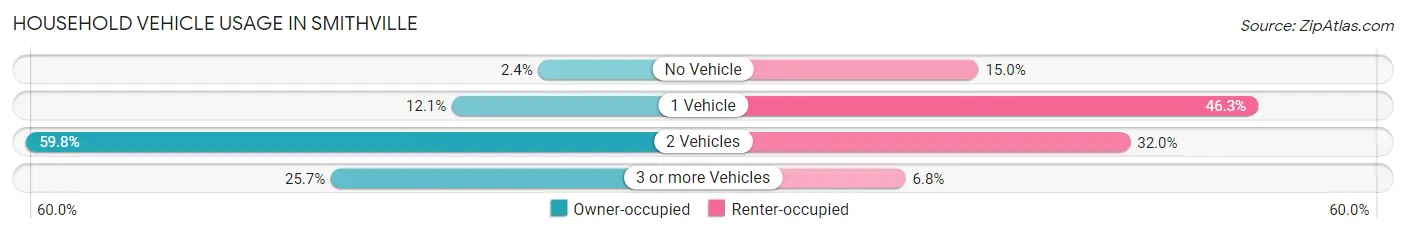
| Vehicles per Household | Owner-occupied | Renter-occupied |
| No Vehicle | 10 (2.4%) | 22 (15.0%) |
| 1 Vehicle | 50 (12.1%) | 68 (46.3%) |
| 2 Vehicles | 247 (59.8%) | 47 (32.0%) |
| 3 or more Vehicles | 106 (25.7%) | 10 (6.8%) |
| Total | 413 (100.0%) | 147 (100.0%) |
Real Estate & Mortgages in Smithville
Real Estate and Mortgage Overview in Smithville
| Characteristic | Without Mortgage | With Mortgage |
| Housing Units | 173 | 240 |
| Median Property Value | $183,400 | $169,200 |
| Median Household Income | $84,018 | $28 |
| Monthly Housing Costs | $517 | $0 |
| Real Estate Taxes | $2,308 | $4 |
Property Value by Mortgage Status in Smithville
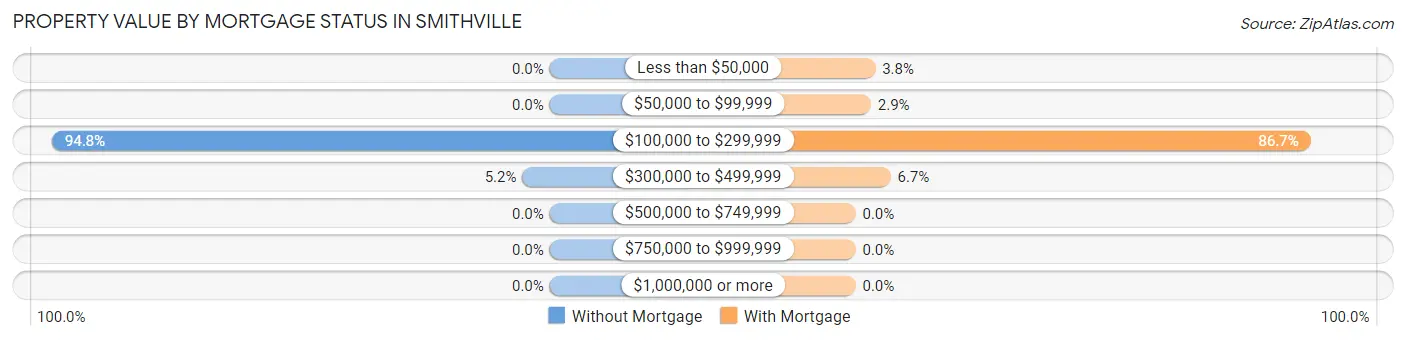
| Property Value | Without Mortgage | With Mortgage |
| Less than $50,000 | 0 (0.0%) | 9 (3.7%) |
| $50,000 to $99,999 | 0 (0.0%) | 7 (2.9%) |
| $100,000 to $299,999 | 164 (94.8%) | 208 (86.7%) |
| $300,000 to $499,999 | 9 (5.2%) | 16 (6.7%) |
| $500,000 to $749,999 | 0 (0.0%) | 0 (0.0%) |
| $750,000 to $999,999 | 0 (0.0%) | 0 (0.0%) |
| $1,000,000 or more | 0 (0.0%) | 0 (0.0%) |
| Total | 173 (100.0%) | 240 (100.0%) |
Household Income by Mortgage Status in Smithville
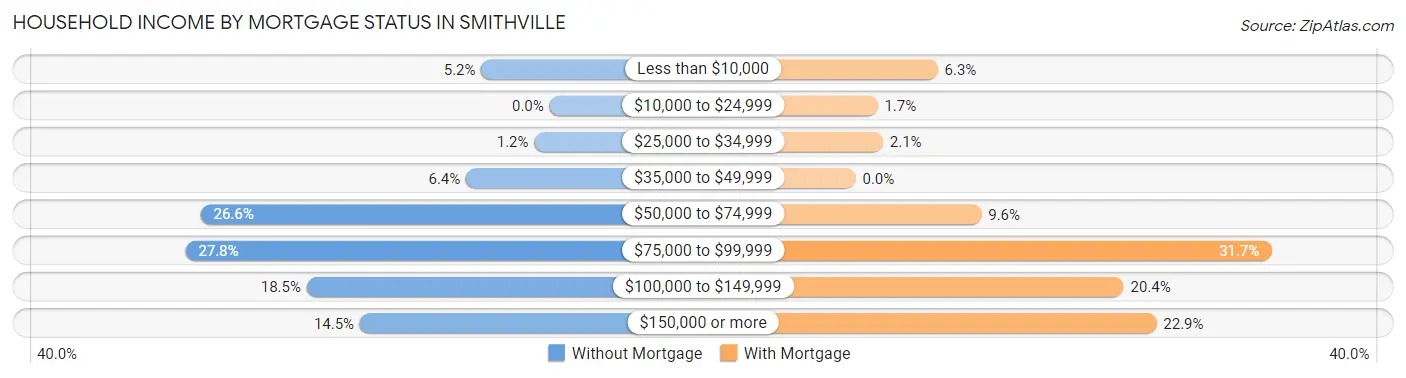
| Household Income | Without Mortgage | With Mortgage |
| Less than $10,000 | 9 (5.2%) | 15 (6.2%) |
| $10,000 to $24,999 | 0 (0.0%) | 4 (1.7%) |
| $25,000 to $34,999 | 2 (1.2%) | 5 (2.1%) |
| $35,000 to $49,999 | 11 (6.4%) | 0 (0.0%) |
| $50,000 to $74,999 | 46 (26.6%) | 23 (9.6%) |
| $75,000 to $99,999 | 48 (27.8%) | 76 (31.7%) |
| $100,000 to $149,999 | 32 (18.5%) | 49 (20.4%) |
| $150,000 or more | 25 (14.4%) | 55 (22.9%) |
| Total | 173 (100.0%) | 240 (100.0%) |
Property Value to Household Income Ratio in Smithville
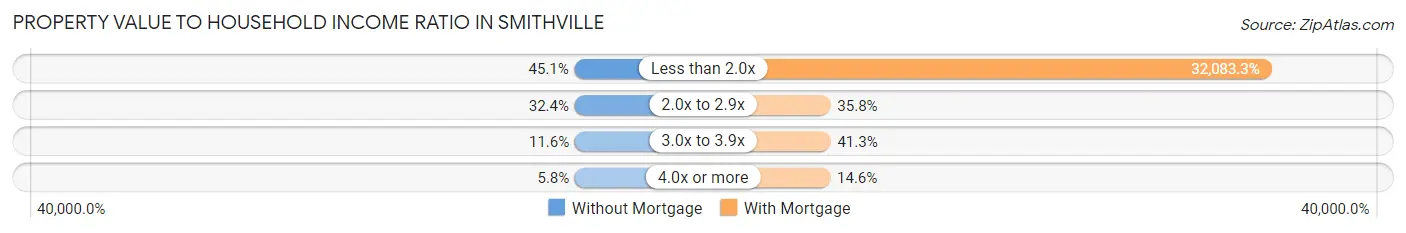
| Value-to-Income Ratio | Without Mortgage | With Mortgage |
| Less than 2.0x | 78 (45.1%) | 77,000 (32,083.3%) |
| 2.0x to 2.9x | 56 (32.4%) | 86 (35.8%) |
| 3.0x to 3.9x | 20 (11.6%) | 99 (41.2%) |
| 4.0x or more | 10 (5.8%) | 35 (14.6%) |
| Total | 173 (100.0%) | 240 (100.0%) |
Real Estate Taxes by Mortgage Status in Smithville
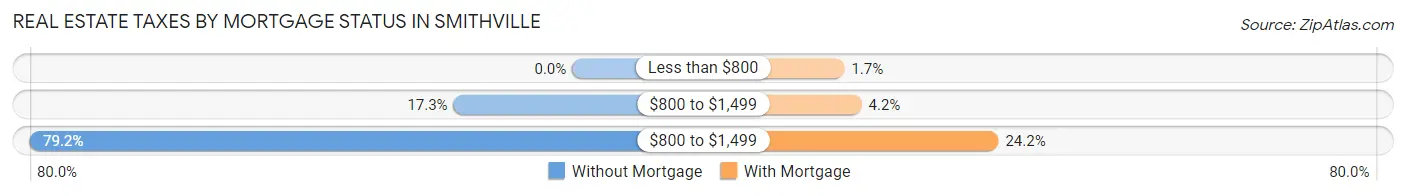
| Property Taxes | Without Mortgage | With Mortgage |
| Less than $800 | 0 (0.0%) | 4 (1.7%) |
| $800 to $1,499 | 30 (17.3%) | 10 (4.2%) |
| $800 to $1,499 | 137 (79.2%) | 58 (24.2%) |
| Total | 173 (100.0%) | 240 (100.0%) |
Health & Disability in Smithville
Health Insurance Coverage by Age in Smithville
| Age Bracket | With Coverage | Without Coverage |
| Under 6 Years | 115 (100.0%) | 0 (0.0%) |
| 6 to 18 Years | 239 (100.0%) | 0 (0.0%) |
| 19 to 25 Years | 110 (96.5%) | 4 (3.5%) |
| 26 to 34 Years | 119 (100.0%) | 0 (0.0%) |
| 35 to 44 Years | 144 (98.0%) | 3 (2.0%) |
| 45 to 54 Years | 103 (96.3%) | 4 (3.7%) |
| 55 to 64 Years | 191 (94.1%) | 12 (5.9%) |
| 65 to 74 Years | 204 (100.0%) | 0 (0.0%) |
| 75 Years and older | 109 (100.0%) | 0 (0.0%) |
| Total | 1,334 (98.3%) | 23 (1.7%) |
Health Insurance Coverage by Citizenship Status in Smithville
| Citizenship Status | With Coverage | Without Coverage |
| Native Born | 115 (100.0%) | 0 (0.0%) |
| Foreign Born, Citizen | 239 (100.0%) | 0 (0.0%) |
| Foreign Born, not a Citizen | 110 (96.5%) | 4 (3.5%) |
Health Insurance Coverage by Household Income in Smithville
| Household Income | With Coverage | Without Coverage |
| Under $25,000 | 81 (87.1%) | 12 (12.9%) |
| $25,000 to $49,999 | 192 (98.0%) | 4 (2.0%) |
| $50,000 to $74,999 | 356 (100.0%) | 0 (0.0%) |
| $75,000 to $99,999 | 244 (97.2%) | 7 (2.8%) |
| $100,000 and over | 461 (100.0%) | 0 (0.0%) |
Public vs Private Health Insurance Coverage by Age in Smithville
| Age Bracket | Public Insurance | Private Insurance |
| Under 6 | 64 (55.6%) | 75 (65.2%) |
| 6 to 18 Years | 64 (26.8%) | 207 (86.6%) |
| 19 to 25 Years | 12 (10.5%) | 100 (87.7%) |
| 25 to 34 Years | 18 (15.1%) | 105 (88.2%) |
| 35 to 44 Years | 22 (15.0%) | 128 (87.1%) |
| 45 to 54 Years | 16 (14.9%) | 92 (86.0%) |
| 55 to 64 Years | 24 (11.8%) | 179 (88.2%) |
| 65 to 74 Years | 198 (97.1%) | 132 (64.7%) |
| 75 Years and over | 109 (100.0%) | 44 (40.4%) |
| Total | 527 (38.8%) | 1,062 (78.3%) |
Disability Status by Sex by Age in Smithville
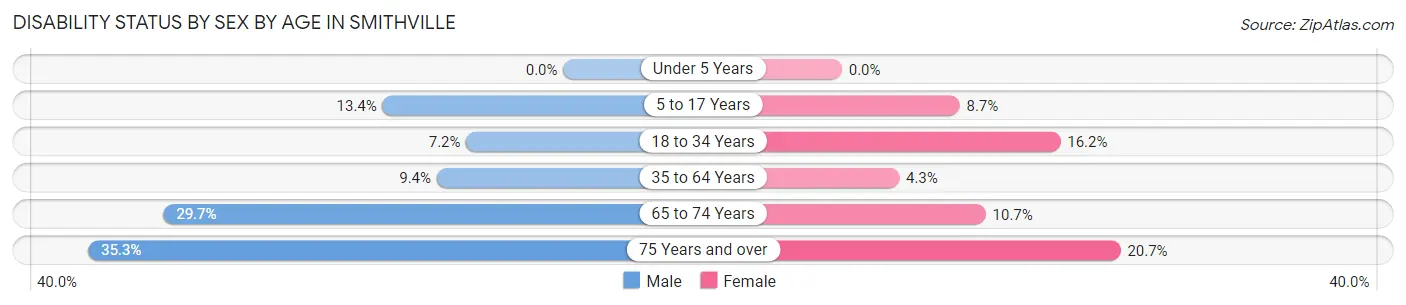
| Age Bracket | Male | Female |
| Under 5 Years | 0 (0.0%) | 0 (0.0%) |
| 5 to 17 Years | 20 (13.4%) | 9 (8.7%) |
| 18 to 34 Years | 9 (7.2%) | 18 (16.2%) |
| 35 to 64 Years | 23 (9.4%) | 9 (4.3%) |
| 65 to 74 Years | 30 (29.7%) | 11 (10.7%) |
| 75 Years and over | 18 (35.3%) | 12 (20.7%) |
Disability Class by Sex by Age in Smithville
Disability Class: Hearing Difficulty
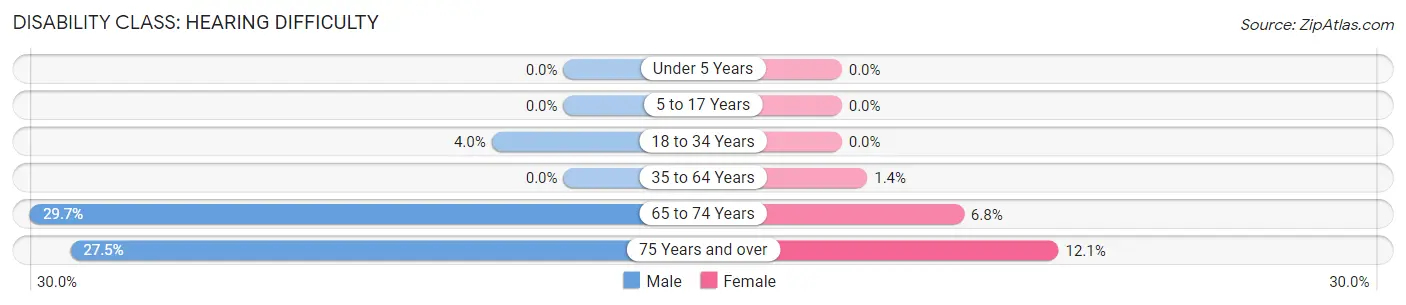
| Age Bracket | Male | Female |
| Under 5 Years | 0 (0.0%) | 0 (0.0%) |
| 5 to 17 Years | 0 (0.0%) | 0 (0.0%) |
| 18 to 34 Years | 5 (4.0%) | 0 (0.0%) |
| 35 to 64 Years | 0 (0.0%) | 3 (1.4%) |
| 65 to 74 Years | 30 (29.7%) | 7 (6.8%) |
| 75 Years and over | 14 (27.5%) | 7 (12.1%) |
Disability Class: Vision Difficulty
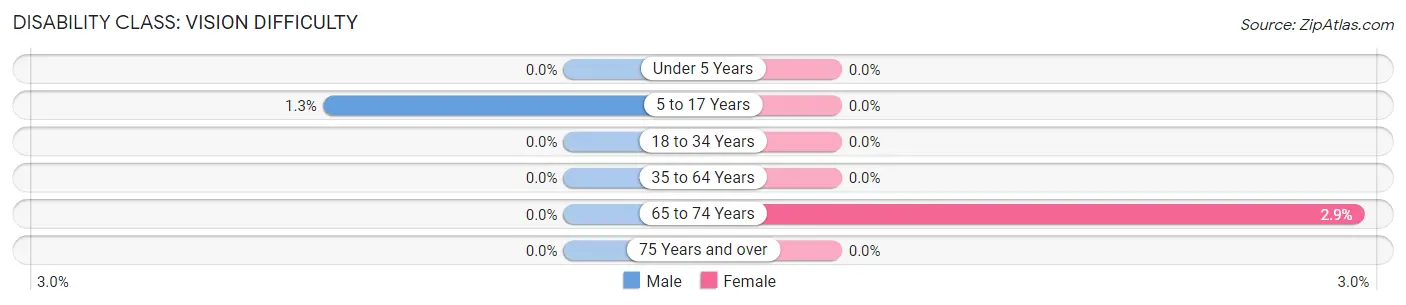
| Age Bracket | Male | Female |
| Under 5 Years | 0 (0.0%) | 0 (0.0%) |
| 5 to 17 Years | 2 (1.3%) | 0 (0.0%) |
| 18 to 34 Years | 0 (0.0%) | 0 (0.0%) |
| 35 to 64 Years | 0 (0.0%) | 0 (0.0%) |
| 65 to 74 Years | 0 (0.0%) | 3 (2.9%) |
| 75 Years and over | 0 (0.0%) | 0 (0.0%) |
Disability Class: Cognitive Difficulty
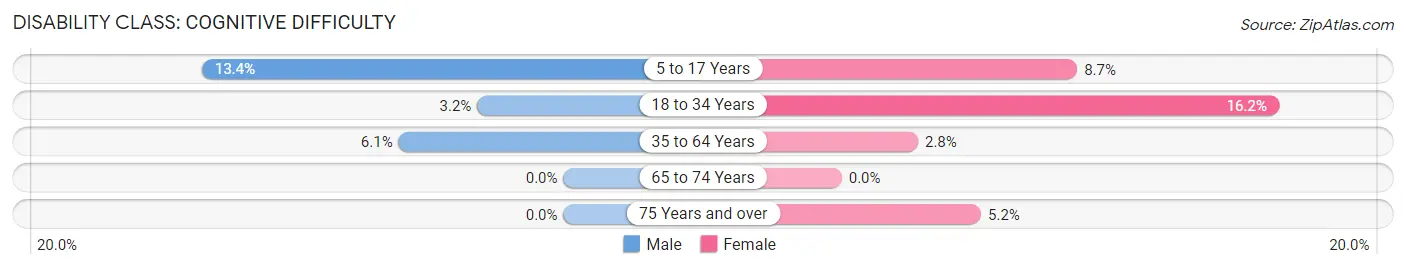
| Age Bracket | Male | Female |
| 5 to 17 Years | 20 (13.4%) | 9 (8.7%) |
| 18 to 34 Years | 4 (3.2%) | 18 (16.2%) |
| 35 to 64 Years | 15 (6.1%) | 6 (2.8%) |
| 65 to 74 Years | 0 (0.0%) | 0 (0.0%) |
| 75 Years and over | 0 (0.0%) | 3 (5.2%) |
Disability Class: Ambulatory Difficulty
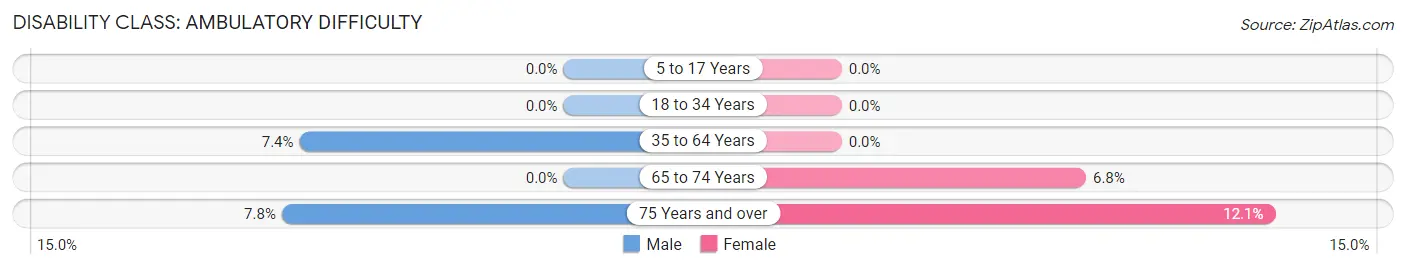
| Age Bracket | Male | Female |
| 5 to 17 Years | 0 (0.0%) | 0 (0.0%) |
| 18 to 34 Years | 0 (0.0%) | 0 (0.0%) |
| 35 to 64 Years | 18 (7.3%) | 0 (0.0%) |
| 65 to 74 Years | 0 (0.0%) | 7 (6.8%) |
| 75 Years and over | 4 (7.8%) | 7 (12.1%) |
Disability Class: Self-Care Difficulty
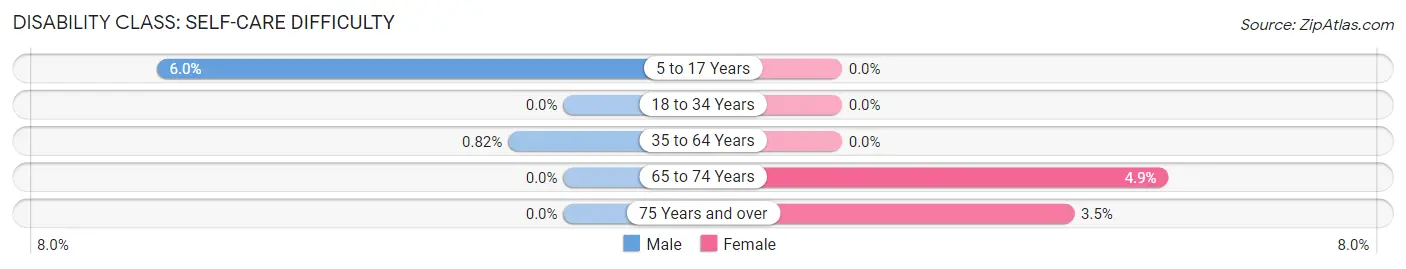
| Age Bracket | Male | Female |
| 5 to 17 Years | 9 (6.0%) | 0 (0.0%) |
| 18 to 34 Years | 0 (0.0%) | 0 (0.0%) |
| 35 to 64 Years | 2 (0.8%) | 0 (0.0%) |
| 65 to 74 Years | 0 (0.0%) | 5 (4.9%) |
| 75 Years and over | 0 (0.0%) | 2 (3.5%) |
Technology Access in Smithville
Computing Device Access in Smithville
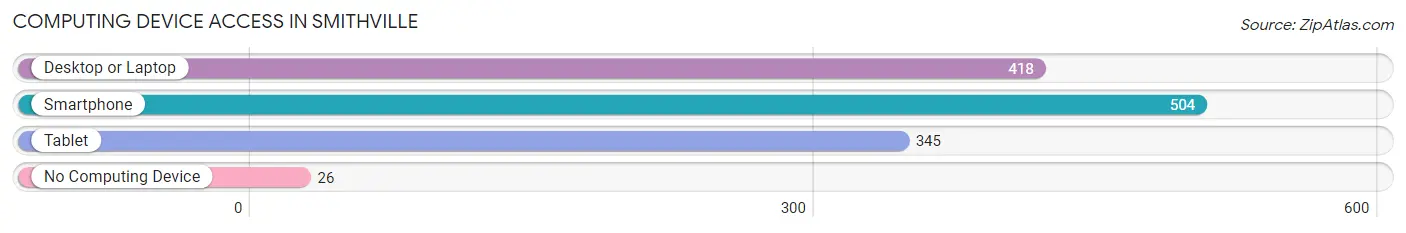
| Device Type | # Households | % Households |
| Desktop or Laptop | 418 | 74.6% |
| Smartphone | 504 | 90.0% |
| Tablet | 345 | 61.6% |
| No Computing Device | 26 | 4.6% |
| Total | 560 | 100.0% |
Internet Access in Smithville
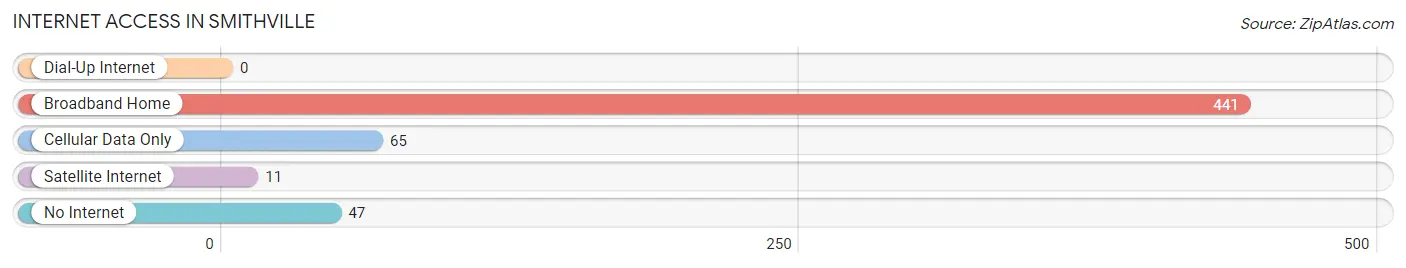
| Internet Type | # Households | % Households |
| Dial-Up Internet | 0 | 0.0% |
| Broadband Home | 441 | 78.7% |
| Cellular Data Only | 65 | 11.6% |
| Satellite Internet | 11 | 2.0% |
| No Internet | 47 | 8.4% |
| Total | 560 | 100.0% |
Smithville Summary
History
The small town of Smithville, Ohio is located in Wayne County, Ohio, and is part of the Wooster Metropolitan Statistical Area. The town was founded in 1815 by John Smith, who was a Revolutionary War veteran. Smithville was originally known as Smith’s Mill, and was a small farming community. The town was officially incorporated in 1837, and the population was just over 500 people.
The town of Smithville has a rich history of industry and agriculture. In the early 1900s, the town was home to several factories, including a flour mill, a sawmill, a brickyard, and a furniture factory. The town also had a thriving agricultural industry, with many farmers growing corn, wheat, and other crops.
In the late 1800s, the town was home to several churches, including the Methodist Episcopal Church, the Presbyterian Church, and the United Brethren Church. The town also had a school, a post office, and a general store.
Geography
Smithville is located in Wayne County, Ohio, and is part of the Wooster Metropolitan Statistical Area. The town is situated on the western edge of the county, and is bordered by the towns of Marshallville, Dalton, and Apple Creek. The town is located in the Appalachian Plateau region of Ohio, and is surrounded by rolling hills and forests.
The town of Smithville is located at an elevation of 1,068 feet above sea level. The town is located in the Central Time Zone, and the average annual temperature is around 50 degrees Fahrenheit. The town receives an average of 40 inches of precipitation each year.
Economy
The economy of Smithville is largely based on agriculture and manufacturing. The town is home to several small businesses, including a grocery store, a hardware store, and a restaurant. The town also has a few small manufacturing companies, including a furniture factory and a sawmill.
The town is also home to several farms, which produce corn, wheat, and other crops. The town is also home to several wineries, which produce a variety of wines.
Demographics
As of the 2010 census, the population of Smithville was 1,845 people. The town has a population density of 1,072 people per square mile. The median age of the population is 43.7 years, and the median household income is $45,945.
The racial makeup of the town is 97.3% White, 0.7% African American, 0.2% Native American, 0.2% Asian, 0.1% Pacific Islander, 0.3% from other races, and 1.3% from two or more races. The town has a Hispanic or Latino population of 1.3%.
Conclusion
Smithville, Ohio is a small town located in Wayne County, Ohio. The town has a rich history of industry and agriculture, and is home to several small businesses and farms. The town has a population of 1,845 people, and the median age of the population is 43.7 years. The town has a median household income of $45,945, and the racial makeup of the town is 97.3% White. Smithville is a small town with a rich history and a vibrant economy.
Common Questions
What is Per Capita Income in Smithville?
Per Capita income in Smithville is $33,674.
What is the Median Family Income in Smithville?
Median Family Income in Smithville is $76,618.
What is the Median Household income in Smithville?
Median Household Income in Smithville is $69,063.
What is Income or Wage Gap in Smithville?
Income or Wage Gap in Smithville is 39.5%.
Women in Smithville earn 60.5 cents for every dollar earned by a man.
What is Inequality or Gini Index in Smithville?
Inequality or Gini Index in Smithville is 0.36.
What is the Total Population of Smithville?
Total Population of Smithville is 1,357.
What is the Total Male Population of Smithville?
Total Male Population of Smithville is 731.
What is the Total Female Population of Smithville?
Total Female Population of Smithville is 626.
What is the Ratio of Males per 100 Females in Smithville?
There are 116.77 Males per 100 Females in Smithville.
What is the Ratio of Females per 100 Males in Smithville?
There are 85.64 Females per 100 Males in Smithville.
What is the Median Population Age in Smithville?
Median Population Age in Smithville is 40.2 Years.
What is the Average Family Size in Smithville
Average Family Size in Smithville is 2.8 People.
What is the Average Household Size in Smithville
Average Household Size in Smithville is 2.4 People.
How Large is the Labor Force in Smithville?
There are 651 People in the Labor Forcein in Smithville.
What is the Percentage of People in the Labor Force in Smithville?
62.4% of People are in the Labor Force in Smithville.
What is the Unemployment Rate in Smithville?
Unemployment Rate in Smithville is 2.3%.