North Canton, OH Map & Demographics
North Canton Map
North Canton Overview
$45,655
PER CAPITA INCOME
$95,000
AVG FAMILY INCOME
$69,132
AVG HOUSEHOLD INCOME
32.3%
WAGE / INCOME GAP [ % ]
67.7¢/ $1
WAGE / INCOME GAP [ $ ]
$10,918
FAMILY INCOME DEFICIT
0.47
INEQUALITY / GINI INDEX
17,773
TOTAL POPULATION
8,248
MALE POPULATION
9,525
FEMALE POPULATION
86.59
MALES / 100 FEMALES
115.48
FEMALES / 100 MALES
44.4
MEDIAN AGE
2.8
AVG FAMILY SIZE
2.0
AVG HOUSEHOLD SIZE
9,569
LABOR FORCE [ PEOPLE ]
63.8%
PERCENT IN LABOR FORCE
2.5%
UNEMPLOYMENT RATE
North Canton Zip Codes
Income in North Canton
Income Overview in North Canton
Per Capita Income in North Canton is $45,655, while median incomes of families and households are $95,000 and $69,132 respectively.
| Characteristic | Number | Measure |
| Per Capita Income | 17,773 | $45,655 |
| Median Family Income | 4,294 | $95,000 |
| Mean Family Income | 4,294 | $117,935 |
| Median Household Income | 8,046 | $69,132 |
| Mean Household Income | 8,046 | $98,371 |
| Income Deficit | 4,294 | $10,918 |
| Wage / Income Gap (%) | 17,773 | 32.29% |
| Wage / Income Gap ($) | 17,773 | 67.71¢ per $1 |
| Gini / Inequality Index | 17,773 | 0.47 |
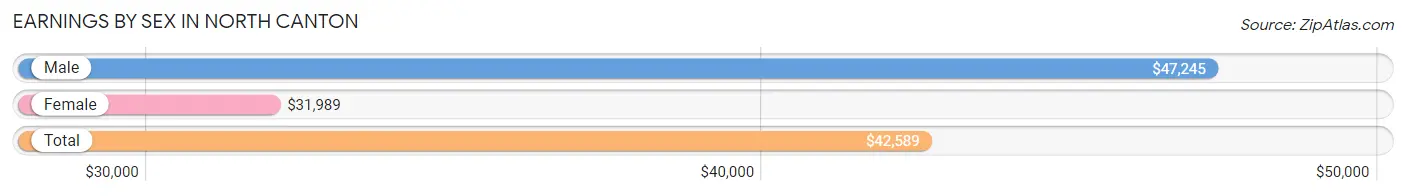
Earnings by Sex in North Canton
Average Earnings in North Canton are $42,589, $47,245 for men and $31,989 for women, a difference of 32.3%.
| Sex | Number | Average Earnings |
| Male | 5,041 (49.5%) | $47,245 |
| Female | 5,151 (50.5%) | $31,989 |
| Total | 10,192 (100.0%) | $42,589 |
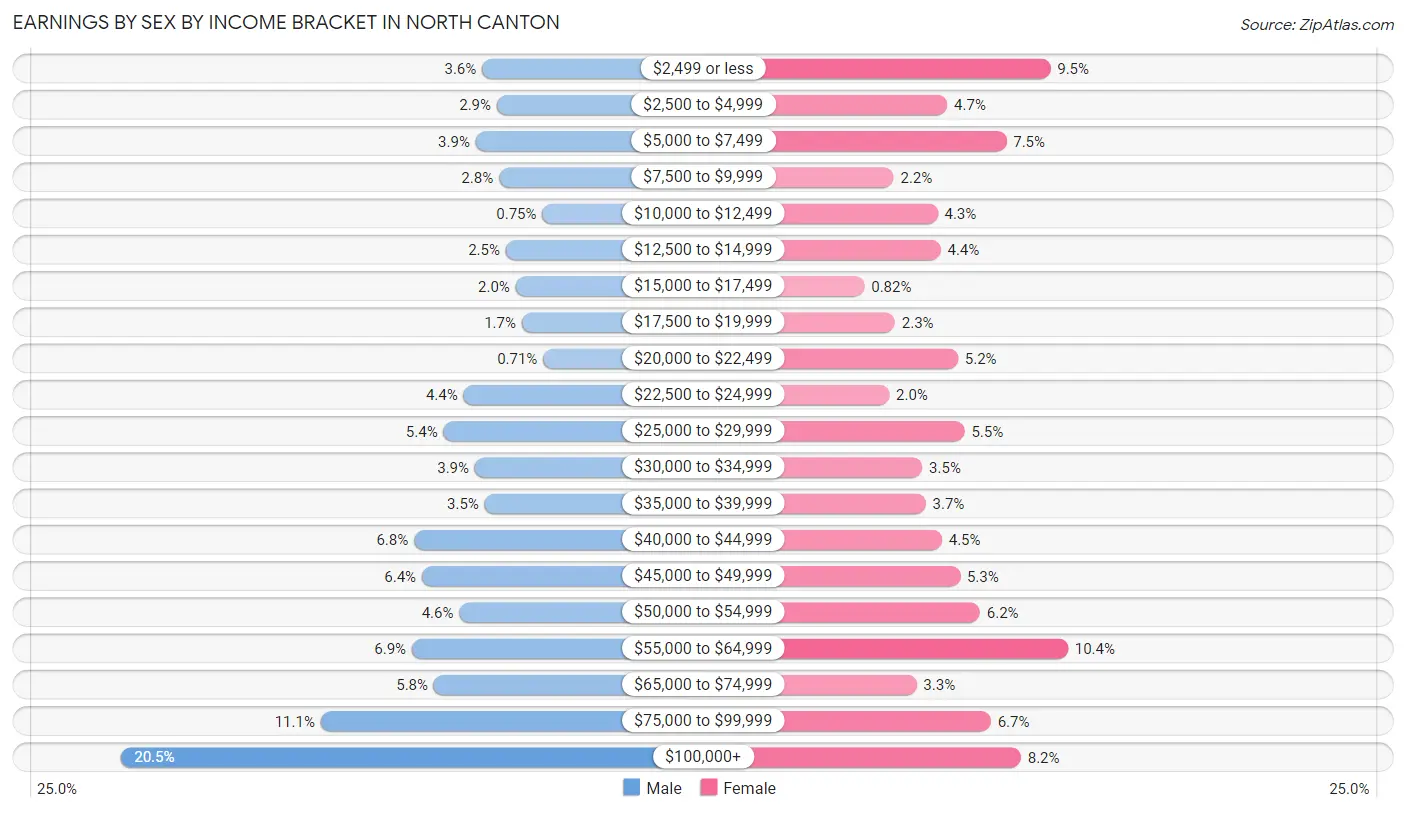
Earnings by Sex by Income Bracket in North Canton
The most common earnings brackets in North Canton are $100,000+ for men (1,032 | 20.5%) and $55,000 to $64,999 for women (533 | 10.3%).
| Income | Male | Female |
| $2,499 or less | 180 (3.6%) | 491 (9.5%) |
| $2,500 to $4,999 | 145 (2.9%) | 242 (4.7%) |
| $5,000 to $7,499 | 195 (3.9%) | 385 (7.5%) |
| $7,500 to $9,999 | 140 (2.8%) | 113 (2.2%) |
| $10,000 to $12,499 | 38 (0.7%) | 219 (4.3%) |
| $12,500 to $14,999 | 124 (2.5%) | 226 (4.4%) |
| $15,000 to $17,499 | 101 (2.0%) | 42 (0.8%) |
| $17,500 to $19,999 | 86 (1.7%) | 116 (2.2%) |
| $20,000 to $22,499 | 36 (0.7%) | 268 (5.2%) |
| $22,500 to $24,999 | 224 (4.4%) | 102 (2.0%) |
| $25,000 to $29,999 | 271 (5.4%) | 284 (5.5%) |
| $30,000 to $34,999 | 197 (3.9%) | 182 (3.5%) |
| $35,000 to $39,999 | 174 (3.5%) | 190 (3.7%) |
| $40,000 to $44,999 | 341 (6.8%) | 229 (4.4%) |
| $45,000 to $49,999 | 322 (6.4%) | 273 (5.3%) |
| $50,000 to $54,999 | 234 (4.6%) | 321 (6.2%) |
| $55,000 to $64,999 | 346 (6.9%) | 533 (10.3%) |
| $65,000 to $74,999 | 294 (5.8%) | 168 (3.3%) |
| $75,000 to $99,999 | 561 (11.1%) | 347 (6.7%) |
| $100,000+ | 1,032 (20.5%) | 420 (8.2%) |
| Total | 5,041 (100.0%) | 5,151 (100.0%) |
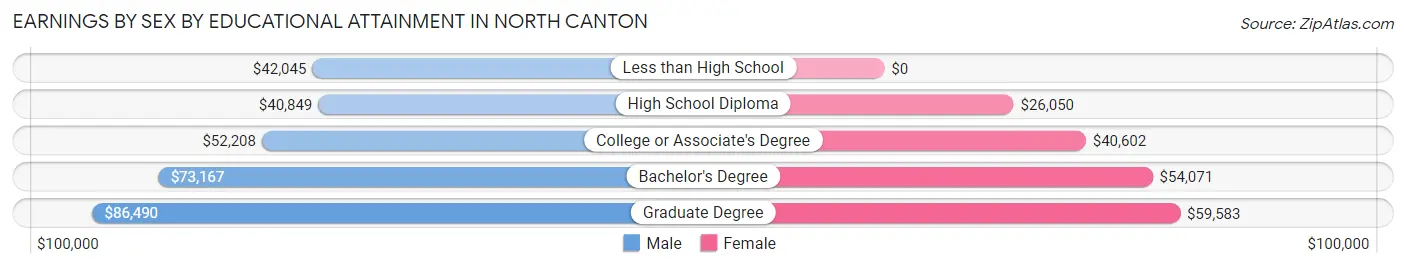
Earnings by Sex by Educational Attainment in North Canton
Average earnings in North Canton are $57,744 for men and $43,879 for women, a difference of 24.0%. Men with an educational attainment of graduate degree enjoy the highest average annual earnings of $86,490, while those with high school diploma education earn the least with $40,849. Women with an educational attainment of graduate degree earn the most with the average annual earnings of $59,583, while those with high school diploma education have the smallest earnings of $26,050.
| Educational Attainment | Male Income | Female Income |
| Less than High School | $42,045 | $0 |
| High School Diploma | $40,849 | $26,050 |
| College or Associate's Degree | $52,208 | $40,602 |
| Bachelor's Degree | $73,167 | $54,071 |
| Graduate Degree | $86,490 | $59,583 |
| Total | $57,744 | $43,879 |
Family Income in North Canton
Family Income Brackets in North Canton
According to the North Canton family income data, there are 1,065 families falling into the $100,000 to $149,999 income range, which is the most common income bracket and makes up 24.8% of all families. Conversely, the $10,000 to $14,999 income bracket is the least frequent group with only 21 families (0.5%) belonging to this category.
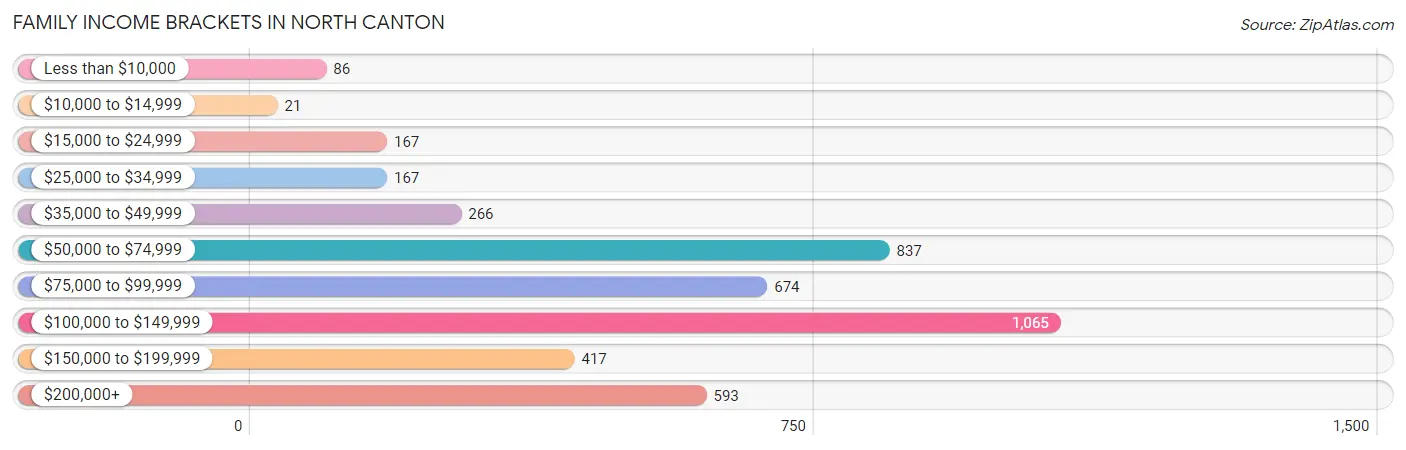
| Income Bracket | # Families | % Families |
| Less than $10,000 | 86 | 2.0% |
| $10,000 to $14,999 | 21 | 0.5% |
| $15,000 to $24,999 | 167 | 3.9% |
| $25,000 to $34,999 | 167 | 3.9% |
| $35,000 to $49,999 | 266 | 6.2% |
| $50,000 to $74,999 | 837 | 19.5% |
| $75,000 to $99,999 | 674 | 15.7% |
| $100,000 to $149,999 | 1,065 | 24.8% |
| $150,000 to $199,999 | 417 | 9.7% |
| $200,000+ | 593 | 13.8% |
Family Income by Famaliy Size in North Canton
4-person families (561 | 13.1%) account for the highest median family income in North Canton with $123,787 per family, while 2-person families (2,574 | 59.9%) have the highest median income of $41,750 per family member.
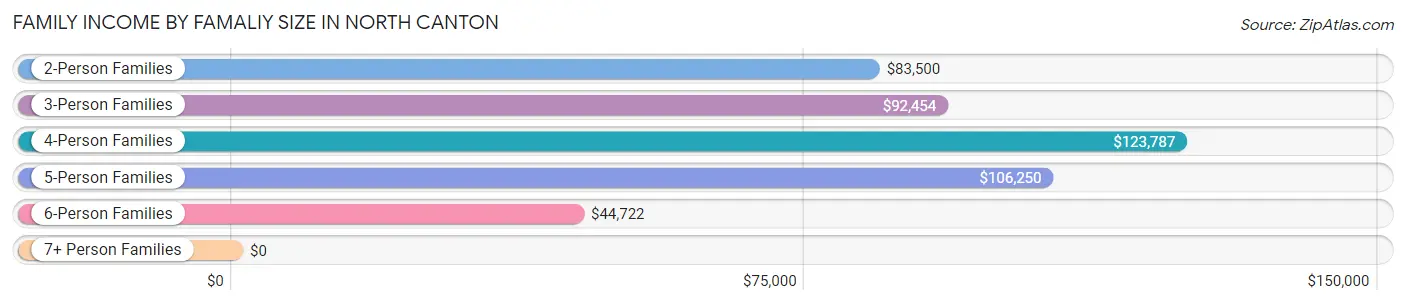
| Income Bracket | # Families | Median Income |
| 2-Person Families | 2,574 (59.9%) | $83,500 |
| 3-Person Families | 855 (19.9%) | $92,454 |
| 4-Person Families | 561 (13.1%) | $123,787 |
| 5-Person Families | 228 (5.3%) | $106,250 |
| 6-Person Families | 40 (0.9%) | $44,722 |
| 7+ Person Families | 36 (0.8%) | $0 |
| Total | 4,294 (100.0%) | $95,000 |
Family Income by Number of Earners in North Canton
The median family income in North Canton is $95,000, with families comprising 2 earners (1,898) having the highest median family income of $125,233, while families with 1 earner (1,465) have the lowest median family income of $59,417, accounting for 44.2% and 34.1% of families, respectively.
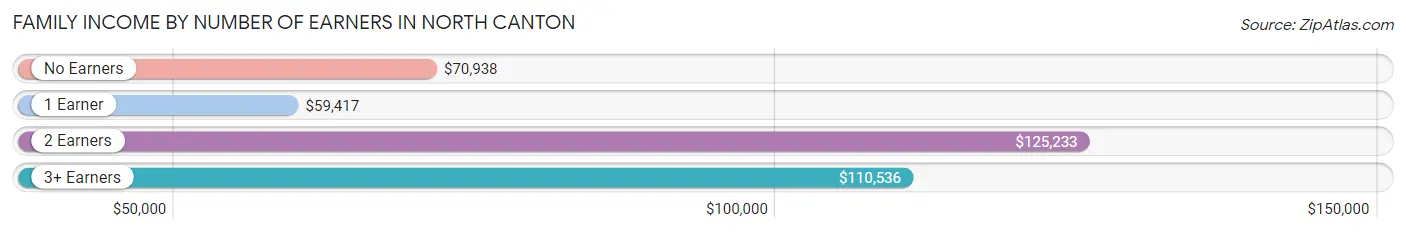
| Number of Earners | # Families | Median Income |
| No Earners | 646 (15.0%) | $70,938 |
| 1 Earner | 1,465 (34.1%) | $59,417 |
| 2 Earners | 1,898 (44.2%) | $125,233 |
| 3+ Earners | 285 (6.6%) | $110,536 |
| Total | 4,294 (100.0%) | $95,000 |
Household Income in North Canton
Household Income Brackets in North Canton
With 1,722 households falling in the category, the $50,000 to $74,999 income range is the most frequent in North Canton, accounting for 21.4% of all households. In contrast, only 129 households (1.6%) fall into the $10,000 to $14,999 income bracket, making it the least populous group.
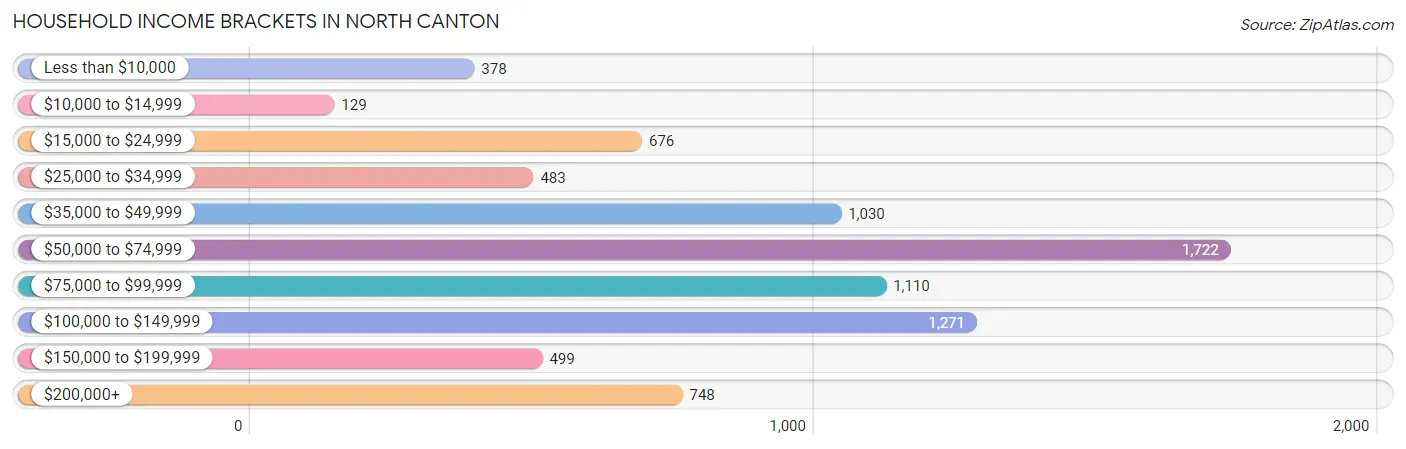
| Income Bracket | # Households | % Households |
| Less than $10,000 | 378 | 4.7% |
| $10,000 to $14,999 | 129 | 1.6% |
| $15,000 to $24,999 | 676 | 8.4% |
| $25,000 to $34,999 | 483 | 6.0% |
| $35,000 to $49,999 | 1,030 | 12.8% |
| $50,000 to $74,999 | 1,722 | 21.4% |
| $75,000 to $99,999 | 1,110 | 13.8% |
| $100,000 to $149,999 | 1,271 | 15.8% |
| $150,000 to $199,999 | 499 | 6.2% |
| $200,000+ | 748 | 9.3% |
Household Income by Householder Age in North Canton
The median household income in North Canton is $69,132, with the highest median household income of $98,143 found in the 45 to 64 years age bracket for the primary householder. A total of 2,494 households (31.0%) fall into this category. Meanwhile, the 15 to 24 years age bracket for the primary householder has the lowest median household income of $46,500, with 300 households (3.7%) in this group.
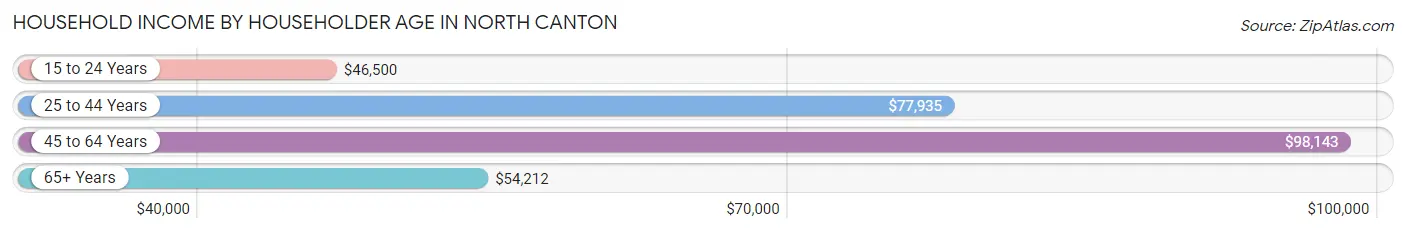
| Income Bracket | # Households | Median Income |
| 15 to 24 Years | 300 (3.7%) | $46,500 |
| 25 to 44 Years | 2,266 (28.2%) | $77,935 |
| 45 to 64 Years | 2,494 (31.0%) | $98,143 |
| 65+ Years | 2,986 (37.1%) | $54,212 |
| Total | 8,046 (100.0%) | $69,132 |
Poverty in North Canton
Income Below Poverty by Sex and Age in North Canton
With 6.0% poverty level for males and 7.9% for females among the residents of North Canton, 5 year old males and 75 year old and over females are the most vulnerable to poverty, with 28 males (47.5%) and 222 females (17.9%) in their respective age groups living below the poverty level.
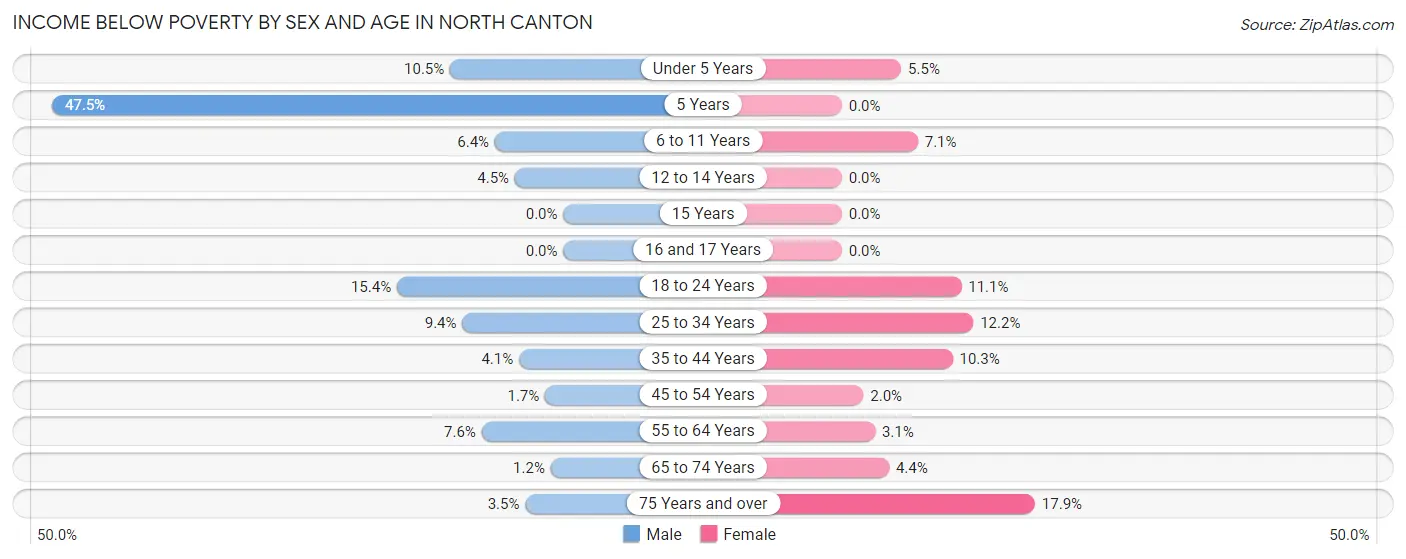
| Age Bracket | Male | Female |
| Under 5 Years | 29 (10.5%) | 22 (5.5%) |
| 5 Years | 28 (47.5%) | 0 (0.0%) |
| 6 to 11 Years | 39 (6.4%) | 31 (7.0%) |
| 12 to 14 Years | 20 (4.5%) | 0 (0.0%) |
| 15 Years | 0 (0.0%) | 0 (0.0%) |
| 16 and 17 Years | 0 (0.0%) | 0 (0.0%) |
| 18 to 24 Years | 90 (15.4%) | 67 (11.1%) |
| 25 to 34 Years | 100 (9.4%) | 143 (12.2%) |
| 35 to 44 Years | 34 (4.1%) | 99 (10.3%) |
| 45 to 54 Years | 20 (1.7%) | 18 (2.0%) |
| 55 to 64 Years | 66 (7.6%) | 41 (3.1%) |
| 65 to 74 Years | 11 (1.2%) | 49 (4.4%) |
| 75 Years and over | 27 (3.5%) | 222 (17.9%) |
| Total | 464 (6.0%) | 692 (7.9%) |
Income Above Poverty by Sex and Age in North Canton
According to the poverty statistics in North Canton, males aged 15 years and females aged 5 years are the age groups that are most secure financially, with 100.0% of males and 100.0% of females in these age groups living above the poverty line.
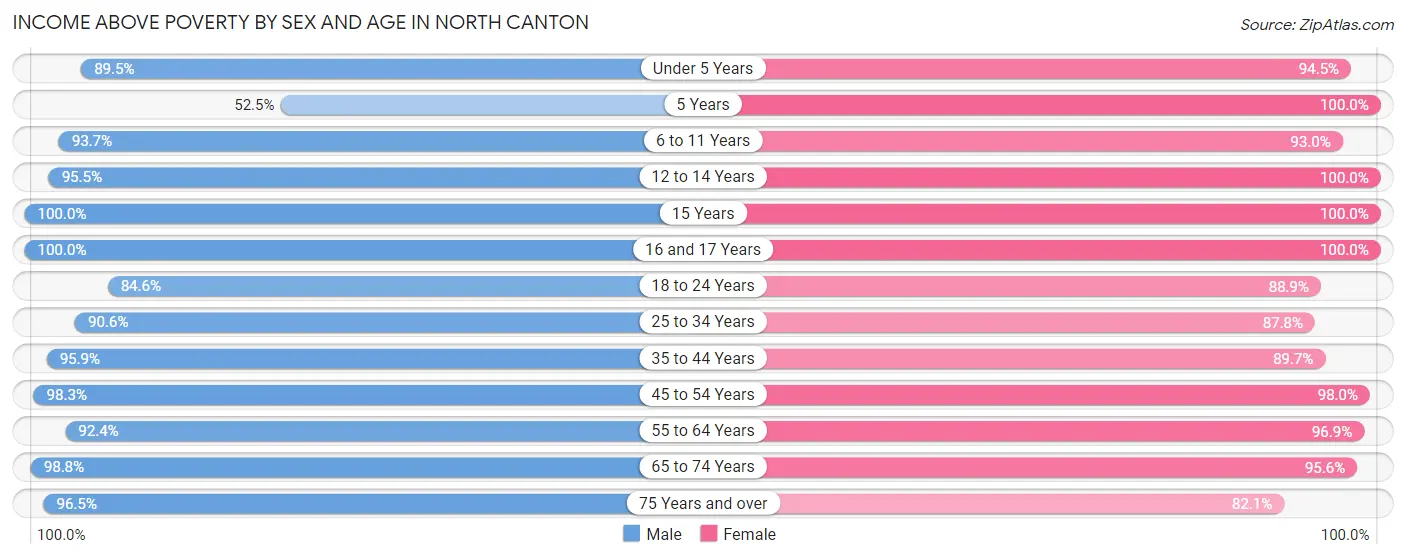
| Age Bracket | Male | Female |
| Under 5 Years | 247 (89.5%) | 377 (94.5%) |
| 5 Years | 31 (52.5%) | 43 (100.0%) |
| 6 to 11 Years | 575 (93.6%) | 409 (92.9%) |
| 12 to 14 Years | 425 (95.5%) | 229 (100.0%) |
| 15 Years | 63 (100.0%) | 174 (100.0%) |
| 16 and 17 Years | 76 (100.0%) | 134 (100.0%) |
| 18 to 24 Years | 493 (84.6%) | 537 (88.9%) |
| 25 to 34 Years | 967 (90.6%) | 1,029 (87.8%) |
| 35 to 44 Years | 793 (95.9%) | 864 (89.7%) |
| 45 to 54 Years | 1,162 (98.3%) | 884 (98.0%) |
| 55 to 64 Years | 805 (92.4%) | 1,292 (96.9%) |
| 65 to 74 Years | 926 (98.8%) | 1,071 (95.6%) |
| 75 Years and over | 737 (96.5%) | 1,017 (82.1%) |
| Total | 7,300 (94.0%) | 8,060 (92.1%) |
Income Below Poverty Among Married-Couple Families in North Canton
The poverty statistics for married-couple families in North Canton show that 1.3% or 43 of the total 3,397 families live below the poverty line. Families with 3 or 4 children have the highest poverty rate of 5.6%, comprising of 12 families. On the other hand, families with 1 or 2 children have the lowest poverty rate of 0.0%, which includes 0 families.
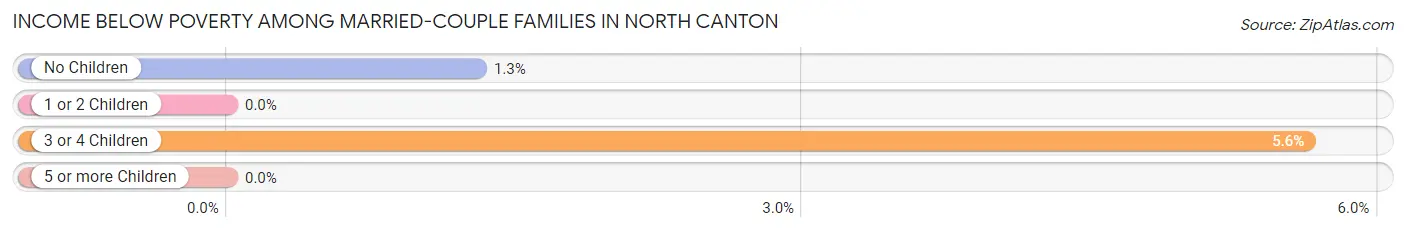
| Children | Above Poverty | Below Poverty |
| No Children | 2,354 (98.7%) | 31 (1.3%) |
| 1 or 2 Children | 777 (100.0%) | 0 (0.0%) |
| 3 or 4 Children | 201 (94.4%) | 12 (5.6%) |
| 5 or more Children | 22 (100.0%) | 0 (0.0%) |
| Total | 3,354 (98.7%) | 43 (1.3%) |
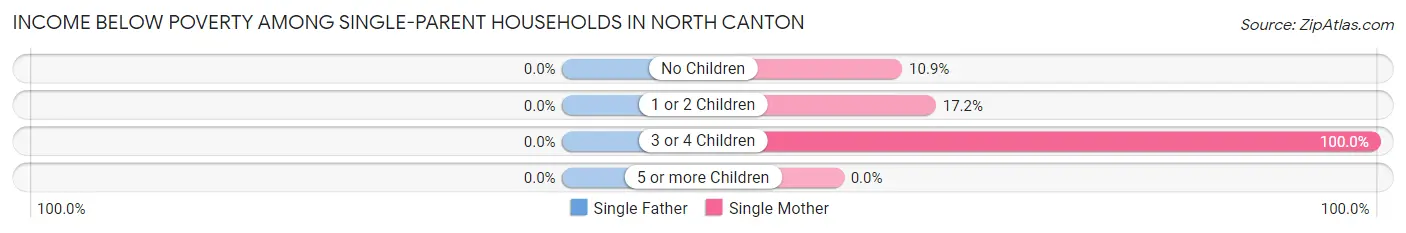
Income Below Poverty Among Single-Parent Households in North Canton
| Children | Single Father | Single Mother |
| No Children | 0 (0.0%) | 22 (10.9%) |
| 1 or 2 Children | 0 (0.0%) | 81 (17.2%) |
| 3 or 4 Children | 0 (0.0%) | 13 (100.0%) |
| 5 or more Children | 0 (0.0%) | 0 (0.0%) |
| Total | 0 (0.0%) | 116 (16.6%) |
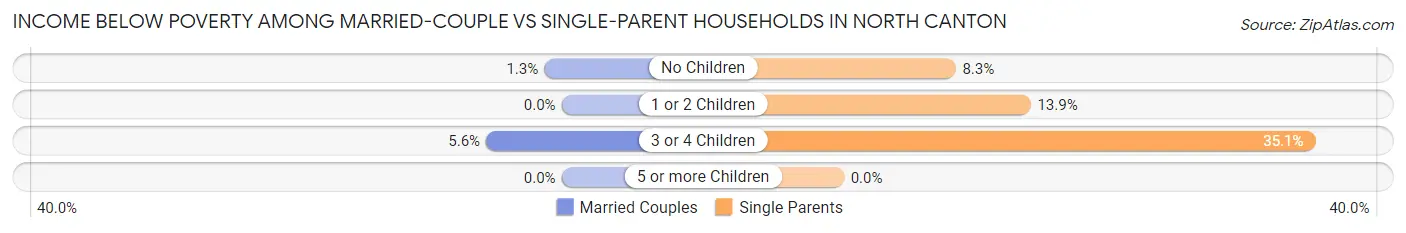
Income Below Poverty Among Married-Couple vs Single-Parent Households in North Canton
The poverty data for North Canton shows that 43 of the married-couple family households (1.3%) and 116 of the single-parent households (12.9%) are living below the poverty level. Within the married-couple family households, those with 3 or 4 children have the highest poverty rate, with 12 households (5.6%) falling below the poverty line. Among the single-parent households, those with 3 or 4 children have the highest poverty rate, with 13 household (35.1%) living below poverty.
| Children | Married-Couple Families | Single-Parent Households |
| No Children | 31 (1.3%) | 22 (8.3%) |
| 1 or 2 Children | 0 (0.0%) | 81 (13.9%) |
| 3 or 4 Children | 12 (5.6%) | 13 (35.1%) |
| 5 or more Children | 0 (0.0%) | 0 (0.0%) |
| Total | 43 (1.3%) | 116 (12.9%) |
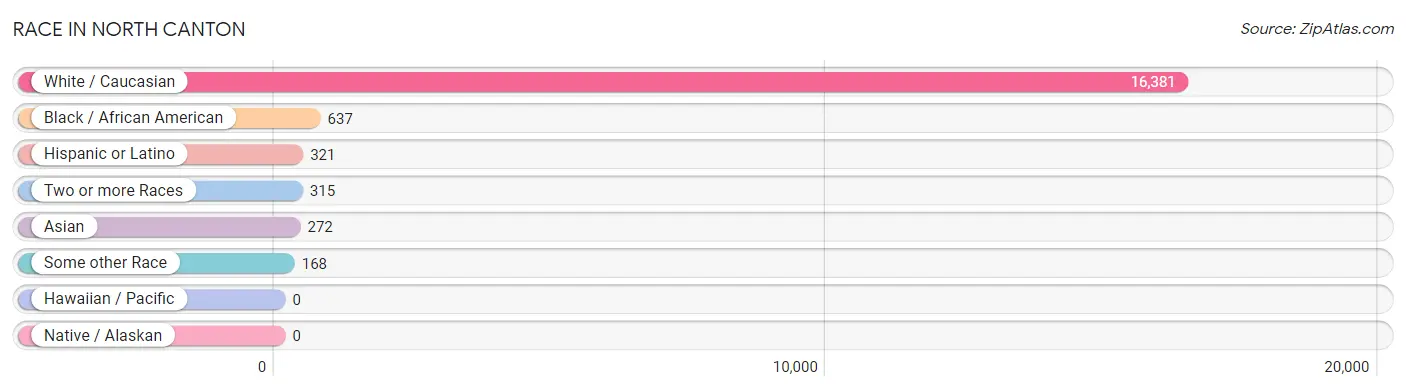
Race in North Canton
The most populous races in North Canton are White / Caucasian (16,381 | 92.2%), Black / African American (637 | 3.6%), and Hispanic or Latino (321 | 1.8%).
| Race | # Population | % Population |
| Asian | 272 | 1.5% |
| Black / African American | 637 | 3.6% |
| Hawaiian / Pacific | 0 | 0.0% |
| Hispanic or Latino | 321 | 1.8% |
| Native / Alaskan | 0 | 0.0% |
| White / Caucasian | 16,381 | 92.2% |
| Two or more Races | 315 | 1.8% |
| Some other Race | 168 | 0.9% |
| Total | 17,773 | 100.0% |
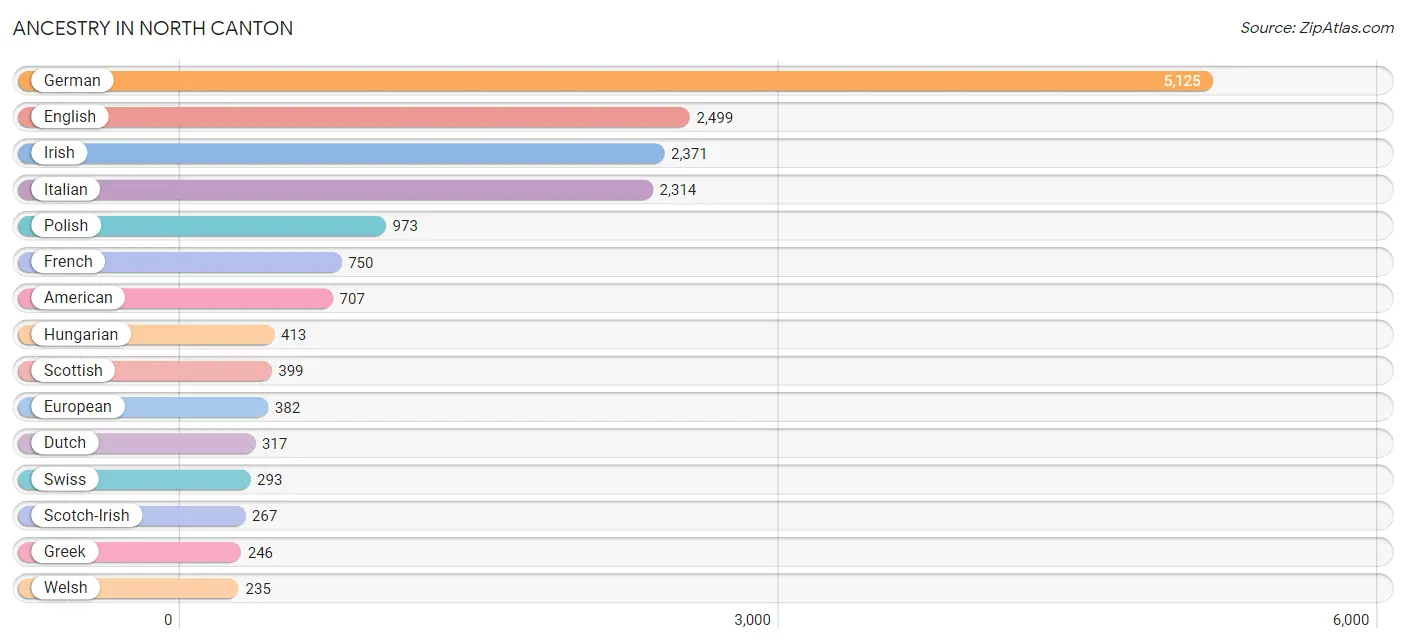
Ancestry in North Canton
The most populous ancestries reported in North Canton are German (5,125 | 28.8%), English (2,499 | 14.1%), Irish (2,371 | 13.3%), Italian (2,314 | 13.0%), and Polish (973 | 5.5%), together accounting for 74.7% of all North Canton residents.
| Ancestry | # Population | % Population |
| American | 707 | 4.0% |
| Arab | 150 | 0.8% |
| Armenian | 5 | 0.0% |
| Austrian | 43 | 0.2% |
| Bangladeshi | 69 | 0.4% |
| Belgian | 34 | 0.2% |
| Bhutanese | 50 | 0.3% |
| Brazilian | 12 | 0.1% |
| British | 90 | 0.5% |
| Burmese | 3 | 0.0% |
| Canadian | 11 | 0.1% |
| Central American | 34 | 0.2% |
| Cherokee | 8 | 0.1% |
| Colombian | 13 | 0.1% |
| Croatian | 130 | 0.7% |
| Cuban | 27 | 0.2% |
| Czech | 78 | 0.4% |
| Czechoslovakian | 48 | 0.3% |
| Danish | 17 | 0.1% |
| Dutch | 317 | 1.8% |
| Eastern European | 48 | 0.3% |
| English | 2,499 | 14.1% |
| European | 382 | 2.1% |
| Finnish | 12 | 0.1% |
| French | 750 | 4.2% |
| French Canadian | 149 | 0.8% |
| German | 5,125 | 28.8% |
| Greek | 246 | 1.4% |
| Guatemalan | 12 | 0.1% |
| Honduran | 13 | 0.1% |
| Hungarian | 413 | 2.3% |
| Indian (Asian) | 176 | 1.0% |
| Iraqi | 2 | 0.0% |
| Irish | 2,371 | 13.3% |
| Italian | 2,314 | 13.0% |
| Jordanian | 27 | 0.2% |
| Korean | 26 | 0.2% |
| Lebanese | 50 | 0.3% |
| Lithuanian | 13 | 0.1% |
| Macedonian | 47 | 0.3% |
| Malaysian | 36 | 0.2% |
| Mexican | 187 | 1.1% |
| Native Hawaiian | 47 | 0.3% |
| Nigerian | 9 | 0.1% |
| Northern European | 40 | 0.2% |
| Norwegian | 28 | 0.2% |
| Pakistani | 3 | 0.0% |
| Panamanian | 9 | 0.1% |
| Pennsylvania German | 44 | 0.3% |
| Polish | 973 | 5.5% |
| Puerto Rican | 24 | 0.1% |
| Romanian | 221 | 1.2% |
| Russian | 203 | 1.1% |
| Scandinavian | 50 | 0.3% |
| Scotch-Irish | 267 | 1.5% |
| Scottish | 399 | 2.2% |
| Serbian | 42 | 0.2% |
| Slavic | 30 | 0.2% |
| Slovak | 187 | 1.1% |
| Slovene | 8 | 0.1% |
| South American | 13 | 0.1% |
| Sri Lankan | 6 | 0.0% |
| Subsaharan African | 9 | 0.1% |
| Swedish | 50 | 0.3% |
| Swiss | 293 | 1.7% |
| Syrian | 71 | 0.4% |
| Thai | 28 | 0.2% |
| Ukrainian | 32 | 0.2% |
| Welsh | 235 | 1.3% |
| Yugoslavian | 16 | 0.1% | View All 70 Rows |
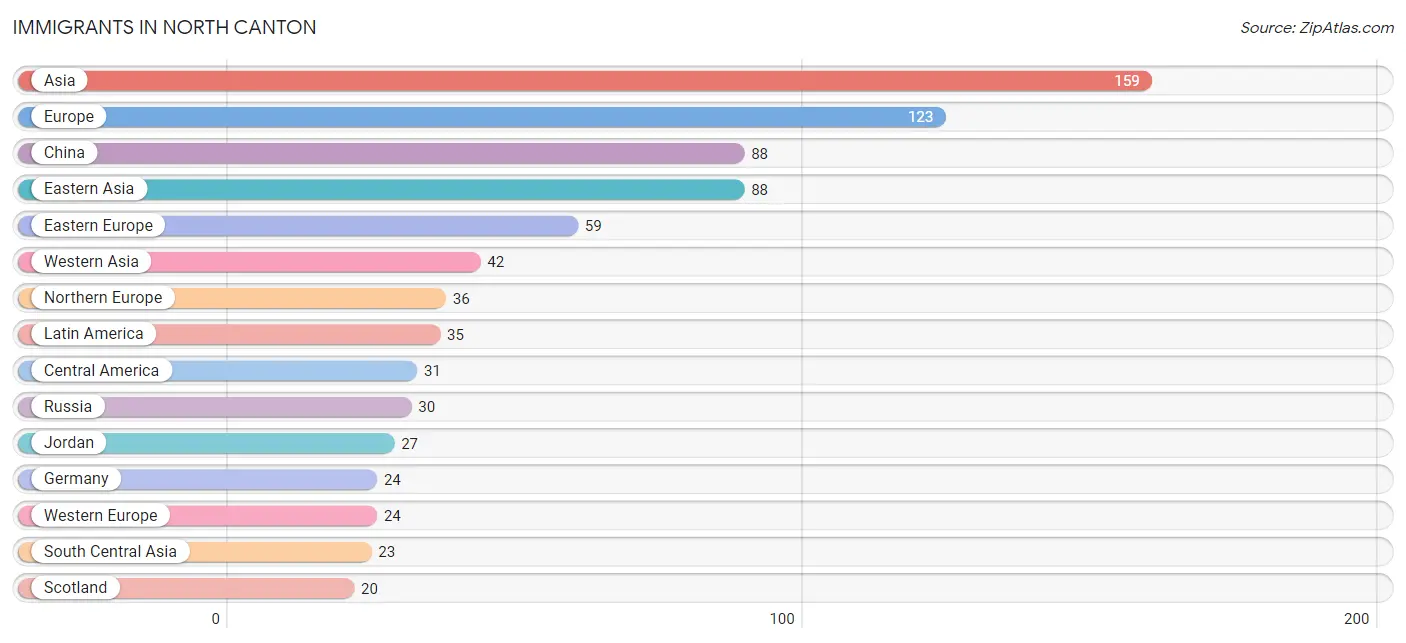
Immigrants in North Canton
The most numerous immigrant groups reported in North Canton came from Asia (159 | 0.9%), Europe (123 | 0.7%), China (88 | 0.5%), Eastern Asia (88 | 0.5%), and Eastern Europe (59 | 0.3%), together accounting for 2.9% of all North Canton residents.
| Immigration Origin | # Population | % Population |
| Africa | 9 | 0.1% |
| Argentina | 4 | 0.0% |
| Asia | 159 | 0.9% |
| Canada | 15 | 0.1% |
| Central America | 31 | 0.2% |
| China | 88 | 0.5% |
| Croatia | 12 | 0.1% |
| Eastern Asia | 88 | 0.5% |
| Eastern Europe | 59 | 0.3% |
| England | 14 | 0.1% |
| Europe | 123 | 0.7% |
| Germany | 24 | 0.1% |
| Greece | 4 | 0.0% |
| Guatemala | 12 | 0.1% |
| India | 8 | 0.1% |
| Jordan | 27 | 0.2% |
| Latin America | 35 | 0.2% |
| Mexico | 10 | 0.1% |
| Nigeria | 9 | 0.1% |
| Northern Europe | 36 | 0.2% |
| Norway | 2 | 0.0% |
| Pakistan | 15 | 0.1% |
| Panama | 9 | 0.1% |
| Poland | 12 | 0.1% |
| Romania | 5 | 0.0% |
| Russia | 30 | 0.2% |
| Scotland | 20 | 0.1% |
| South America | 4 | 0.0% |
| South Central Asia | 23 | 0.1% |
| South Eastern Asia | 6 | 0.0% |
| Southern Europe | 4 | 0.0% |
| Syria | 15 | 0.1% |
| Vietnam | 6 | 0.0% |
| Western Africa | 9 | 0.1% |
| Western Asia | 42 | 0.2% |
| Western Europe | 24 | 0.1% | View All 36 Rows |
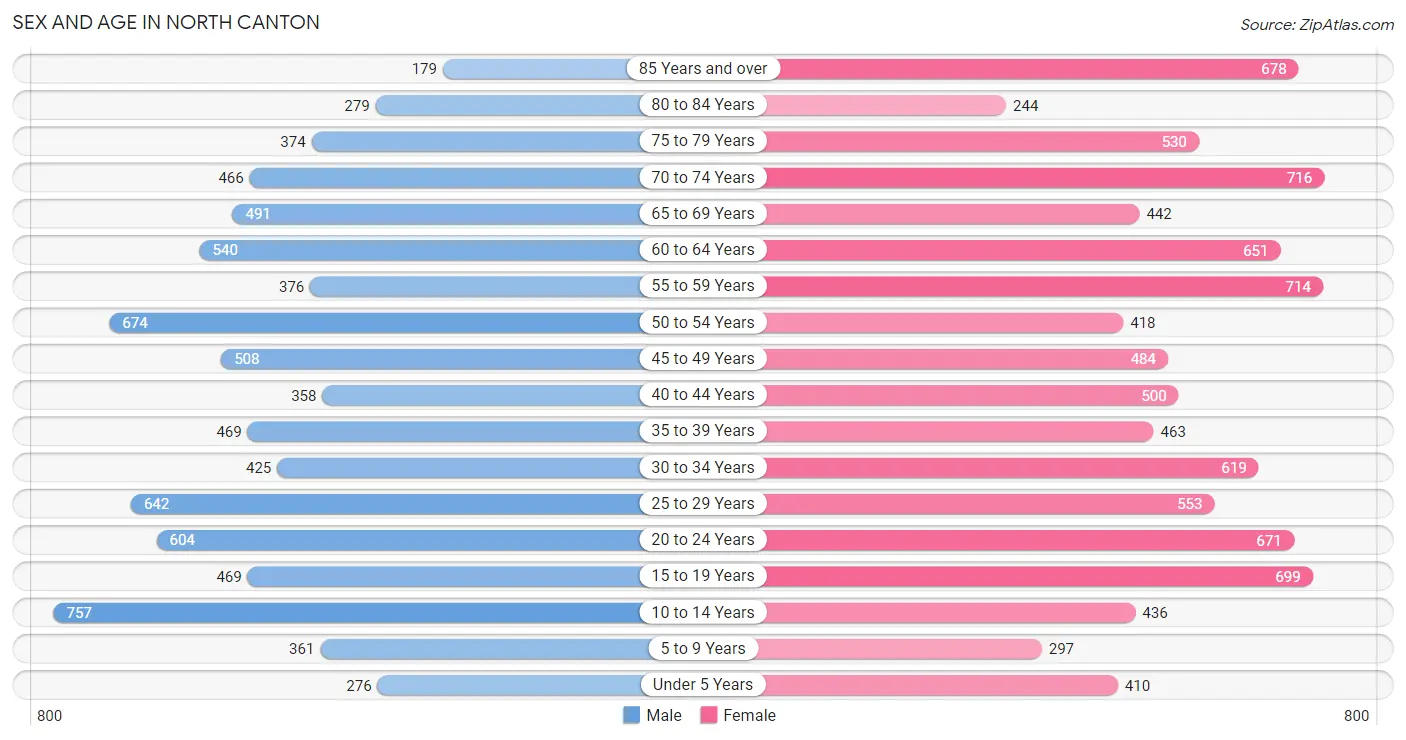
Sex and Age in North Canton
Sex and Age in North Canton
The most populous age groups in North Canton are 10 to 14 Years (757 | 9.2%) for men and 70 to 74 Years (716 | 7.5%) for women.
| Age Bracket | Male | Female |
| Under 5 Years | 276 (3.4%) | 410 (4.3%) |
| 5 to 9 Years | 361 (4.4%) | 297 (3.1%) |
| 10 to 14 Years | 757 (9.2%) | 436 (4.6%) |
| 15 to 19 Years | 469 (5.7%) | 699 (7.3%) |
| 20 to 24 Years | 604 (7.3%) | 671 (7.0%) |
| 25 to 29 Years | 642 (7.8%) | 553 (5.8%) |
| 30 to 34 Years | 425 (5.1%) | 619 (6.5%) |
| 35 to 39 Years | 469 (5.7%) | 463 (4.9%) |
| 40 to 44 Years | 358 (4.3%) | 500 (5.2%) |
| 45 to 49 Years | 508 (6.2%) | 484 (5.1%) |
| 50 to 54 Years | 674 (8.2%) | 418 (4.4%) |
| 55 to 59 Years | 376 (4.6%) | 714 (7.5%) |
| 60 to 64 Years | 540 (6.6%) | 651 (6.8%) |
| 65 to 69 Years | 491 (5.9%) | 442 (4.6%) |
| 70 to 74 Years | 466 (5.7%) | 716 (7.5%) |
| 75 to 79 Years | 374 (4.5%) | 530 (5.6%) |
| 80 to 84 Years | 279 (3.4%) | 244 (2.6%) |
| 85 Years and over | 179 (2.2%) | 678 (7.1%) |
| Total | 8,248 (100.0%) | 9,525 (100.0%) |
Families and Households in North Canton
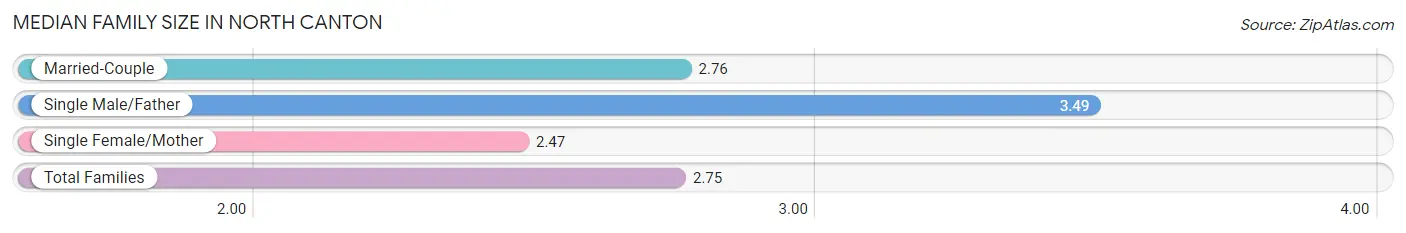
Median Family Size in North Canton
The median family size in North Canton is 2.75 persons per family, with single male/father families (196 | 4.6%) accounting for the largest median family size of 3.49 persons per family. On the other hand, single female/mother families (701 | 16.3%) represent the smallest median family size with 2.47 persons per family.
| Family Type | # Families | Family Size |
| Married-Couple | 3,397 (79.1%) | 2.76 |
| Single Male/Father | 196 (4.6%) | 3.49 |
| Single Female/Mother | 701 (16.3%) | 2.47 |
| Total Families | 4,294 (100.0%) | 2.75 |
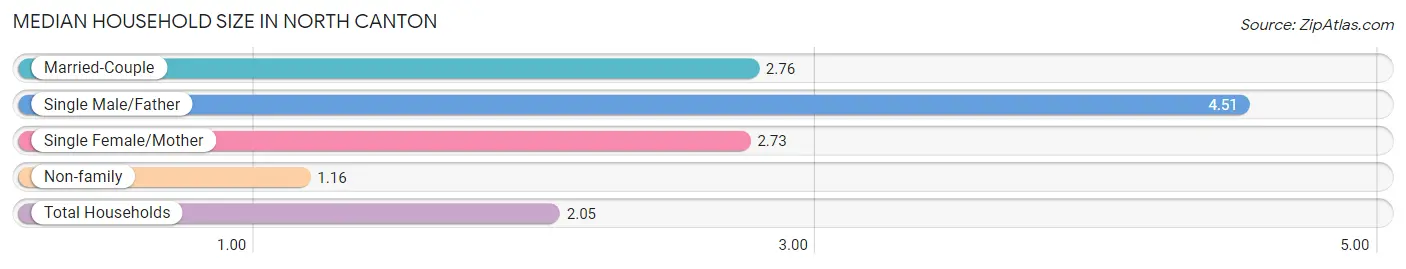
Median Household Size in North Canton
The median household size in North Canton is 2.05 persons per household, with single male/father households (196 | 2.4%) accounting for the largest median household size of 4.51 persons per household. non-family households (3,752 | 46.6%) represent the smallest median household size with 1.16 persons per household.
| Household Type | # Households | Household Size |
| Married-Couple | 3,397 (42.2%) | 2.76 |
| Single Male/Father | 196 (2.4%) | 4.51 |
| Single Female/Mother | 701 (8.7%) | 2.73 |
| Non-family | 3,752 (46.6%) | 1.16 |
| Total Households | 8,046 (100.0%) | 2.05 |
Household Size by Marriage Status in North Canton
Out of a total of 8,046 households in North Canton, 4,294 (53.4%) are family households, while 3,752 (46.6%) are nonfamily households. The most numerous type of family households are 2-person households, comprising 2,395, and the most common type of nonfamily households are 1-person households, comprising 3,185.
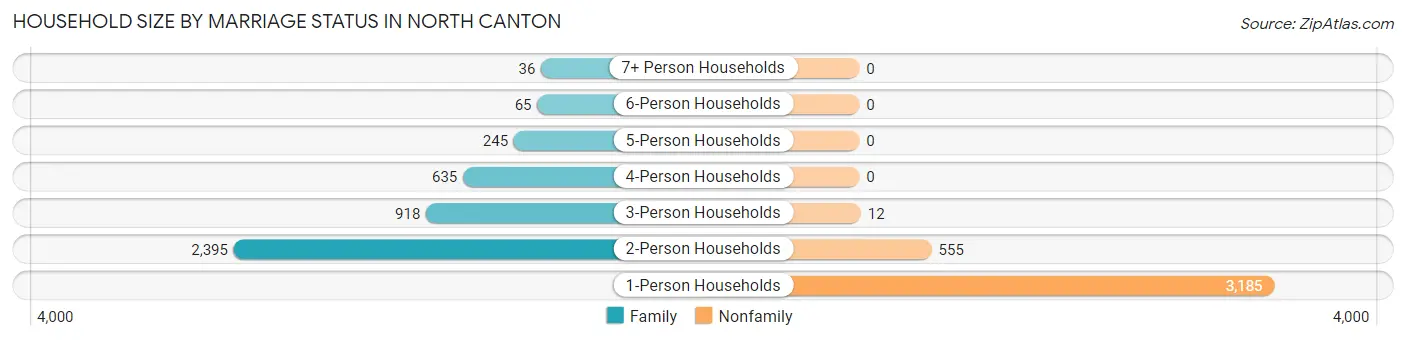
| Household Size | Family Households | Nonfamily Households |
| 1-Person Households | - | 3,185 (39.6%) |
| 2-Person Households | 2,395 (29.8%) | 555 (6.9%) |
| 3-Person Households | 918 (11.4%) | 12 (0.2%) |
| 4-Person Households | 635 (7.9%) | 0 (0.0%) |
| 5-Person Households | 245 (3.0%) | 0 (0.0%) |
| 6-Person Households | 65 (0.8%) | 0 (0.0%) |
| 7+ Person Households | 36 (0.4%) | 0 (0.0%) |
| Total | 4,294 (53.4%) | 3,752 (46.6%) |
Female Fertility in North Canton
Fertility by Age in North Canton
Average fertility rate in North Canton is 40.0 births per 1,000 women. Women in the age bracket of 20 to 34 years have the highest fertility rate with 83.0 births per 1,000 women. Women in the age bracket of 20 to 34 years acount for 93.3% of all women with births.
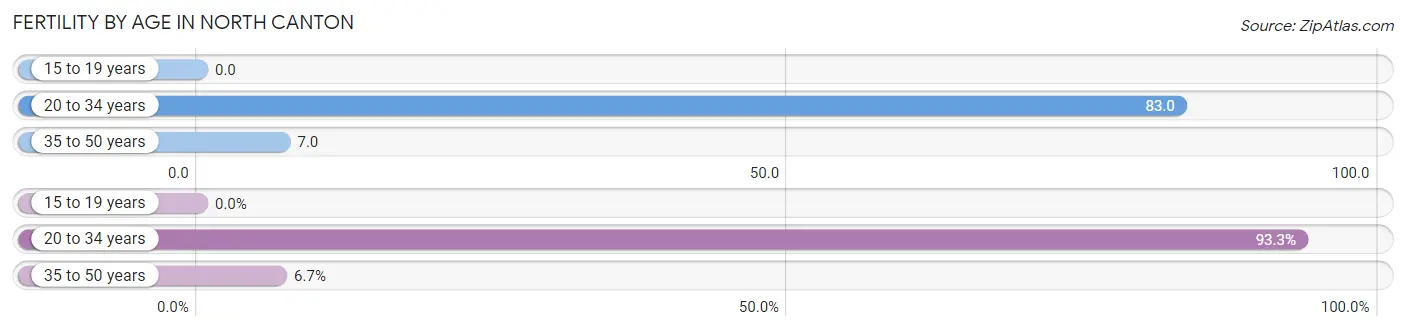
| Age Bracket | Women with Births | Births / 1,000 Women |
| 15 to 19 years | 0 (0.0%) | 0.0 |
| 20 to 34 years | 153 (93.3%) | 83.0 |
| 35 to 50 years | 11 (6.7%) | 7.0 |
| Total | 164 (100.0%) | 40.0 |
Fertility by Age by Marriage Status in North Canton
82.3% of women with births (164) in North Canton are married. The highest percentage of unmarried women with births falls into 20 to 34 years age bracket with 19.0% of them unmarried at the time of birth, while the lowest percentage of unmarried women with births belong to 35 to 50 years age bracket with 0.0% of them unmarried.
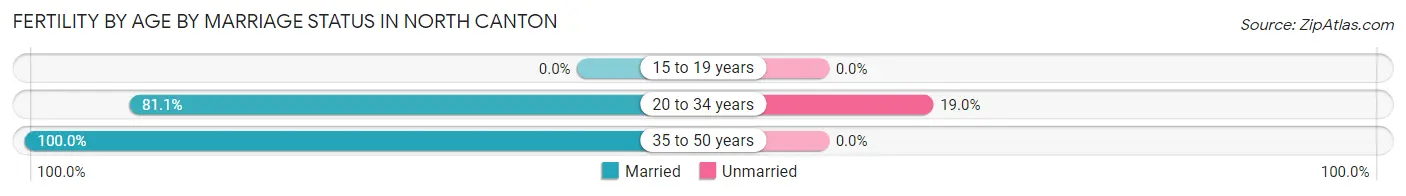
| Age Bracket | Married | Unmarried |
| 15 to 19 years | 0 (0.0%) | 0 (0.0%) |
| 20 to 34 years | 124 (81.0%) | 29 (19.0%) |
| 35 to 50 years | 11 (100.0%) | 0 (0.0%) |
| Total | 135 (82.3%) | 29 (17.7%) |
Fertility by Education in North Canton
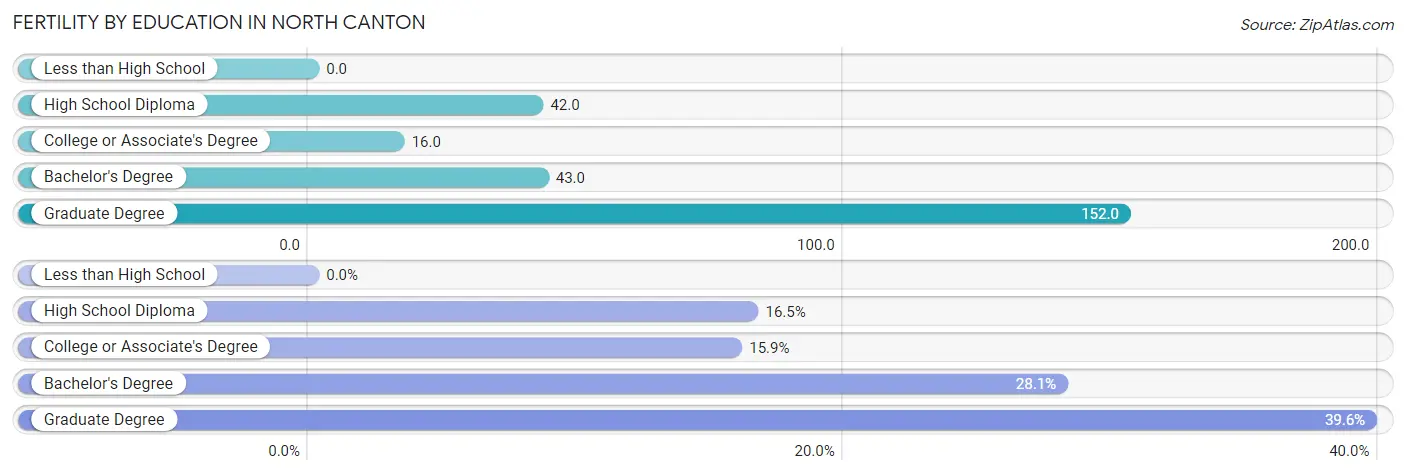
| Educational Attainment | Women with Births | Births / 1,000 Women |
| Less than High School | 0 (0.0%) | 0.0 |
| High School Diploma | 27 (16.5%) | 42.0 |
| College or Associate's Degree | 26 (15.9%) | 16.0 |
| Bachelor's Degree | 46 (28.1%) | 43.0 |
| Graduate Degree | 65 (39.6%) | 152.0 |
| Total | 164 (100.0%) | 40.0 |
Fertility by Education by Marriage Status in North Canton
17.7% of women with births in North Canton are unmarried. Women with the educational attainment of bachelor's degree are most likely to be married with 100.0% of them married at childbirth, while women with the educational attainment of college or associate's degree are least likely to be married with 69.2% of them unmarried at childbirth.
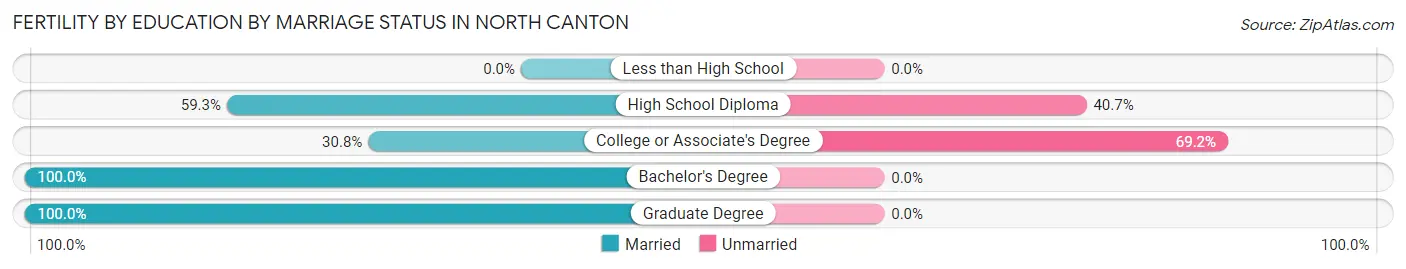
| Educational Attainment | Married | Unmarried |
| Less than High School | 0 (0.0%) | 0 (0.0%) |
| High School Diploma | 16 (59.3%) | 11 (40.7%) |
| College or Associate's Degree | 8 (30.8%) | 18 (69.2%) |
| Bachelor's Degree | 46 (100.0%) | 0 (0.0%) |
| Graduate Degree | 65 (100.0%) | 0 (0.0%) |
| Total | 135 (82.3%) | 29 (17.7%) |
Employment Characteristics in North Canton
Employment by Class of Employer in North Canton
Among the 9,222 employed individuals in North Canton, private company employees (6,106 | 66.2%), not-for-profit organizations (1,076 | 11.7%), and local government employees (859 | 9.3%) make up the most common classes of employment.
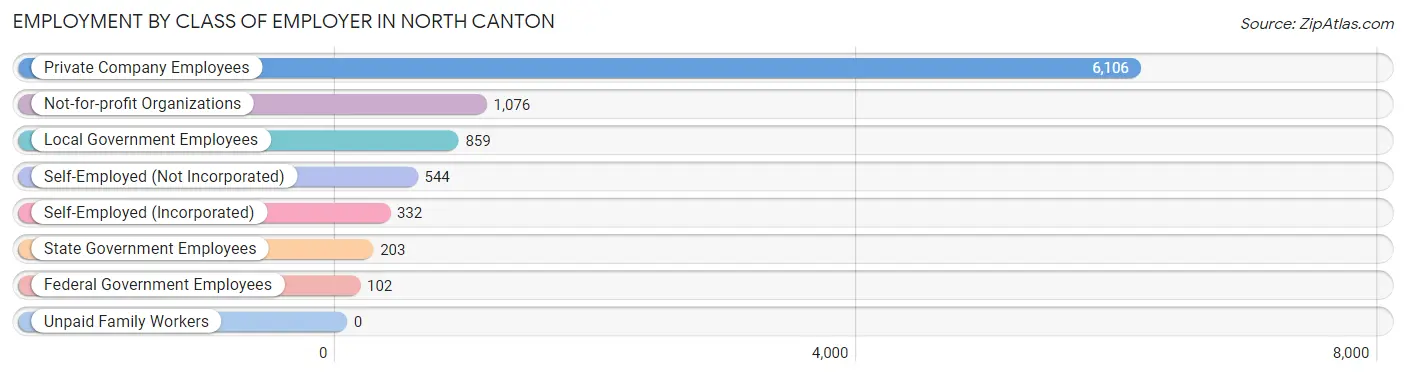
| Employer Class | # Employees | % Employees |
| Private Company Employees | 6,106 | 66.2% |
| Self-Employed (Incorporated) | 332 | 3.6% |
| Self-Employed (Not Incorporated) | 544 | 5.9% |
| Not-for-profit Organizations | 1,076 | 11.7% |
| Local Government Employees | 859 | 9.3% |
| State Government Employees | 203 | 2.2% |
| Federal Government Employees | 102 | 1.1% |
| Unpaid Family Workers | 0 | 0.0% |
| Total | 9,222 | 100.0% |
Employment Status by Age in North Canton
According to the labor force statistics for North Canton, out of the total population over 16 years of age (14,999), 63.8% or 9,569 individuals are in the labor force, with 2.5% or 239 of them unemployed. The age group with the highest labor force participation rate is 35 to 44 years, with 95.3% or 1,706 individuals in the labor force. Within the labor force, the 16 to 19 years age range has the highest percentage of unemployed individuals, with 15.3% or 45 of them being unemployed.
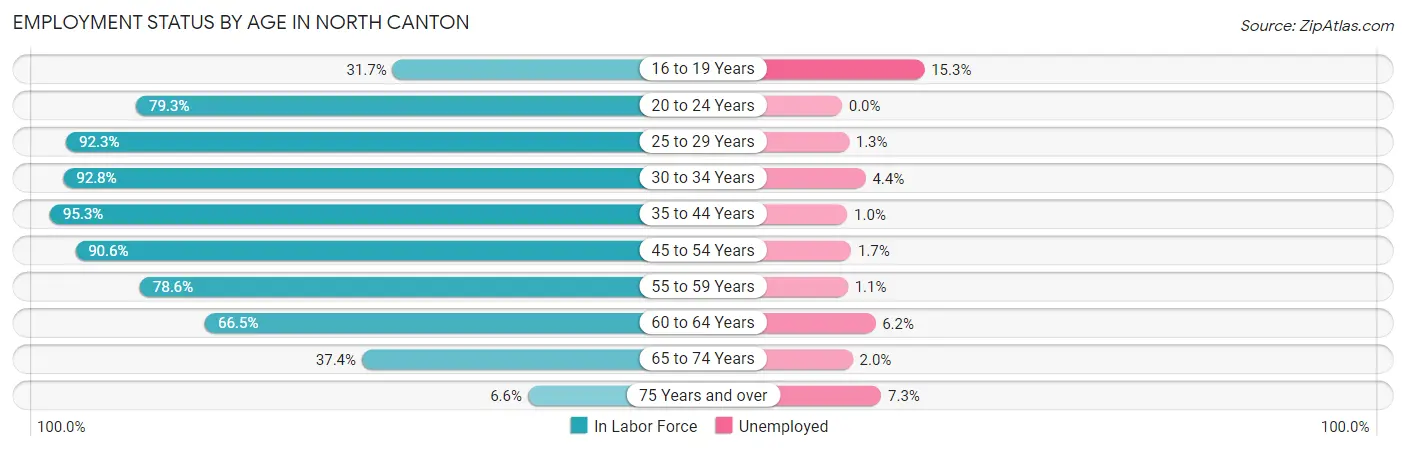
| Age Bracket | In Labor Force | Unemployed |
| 16 to 19 Years | 295 (31.7%) | 45 (15.3%) |
| 20 to 24 Years | 1,011 (79.3%) | 0 (0.0%) |
| 25 to 29 Years | 1,103 (92.3%) | 14 (1.3%) |
| 30 to 34 Years | 969 (92.8%) | 43 (4.4%) |
| 35 to 44 Years | 1,706 (95.3%) | 17 (1.0%) |
| 45 to 54 Years | 1,888 (90.6%) | 32 (1.7%) |
| 55 to 59 Years | 857 (78.6%) | 9 (1.1%) |
| 60 to 64 Years | 792 (66.5%) | 49 (6.2%) |
| 65 to 74 Years | 791 (37.4%) | 16 (2.0%) |
| 75 Years and over | 151 (6.6%) | 11 (7.3%) |
| Total | 9,569 (63.8%) | 239 (2.5%) |
Employment Status by Educational Attainment in North Canton
According to labor force statistics for North Canton, 87.1% of individuals (7,311) out of the total population between 25 and 64 years of age (8,394) are in the labor force, with 2.3% or 168 of them being unemployed. The group with the highest labor force participation rate are those with the educational attainment of college / associate degree, with 89.3% or 2,138 individuals in the labor force. Within the labor force, individuals with less than high school education have the highest percentage of unemployment, with 6.3% or 7 of them being unemployed.
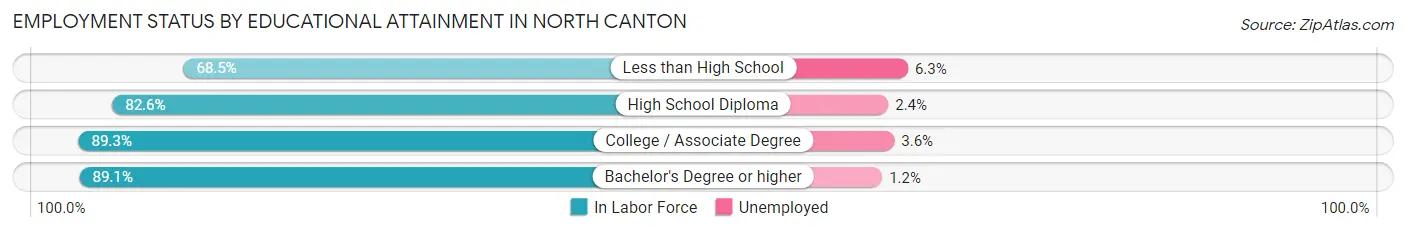
| Educational Attainment | In Labor Force | Unemployed |
| Less than High School | 111 (68.5%) | 10 (6.3%) |
| High School Diploma | 1,746 (82.6%) | 51 (2.4%) |
| College / Associate Degree | 2,138 (89.3%) | 86 (3.6%) |
| Bachelor's Degree or higher | 3,318 (89.1%) | 45 (1.2%) |
| Total | 7,311 (87.1%) | 193 (2.3%) |
Employment Occupations by Sex in North Canton
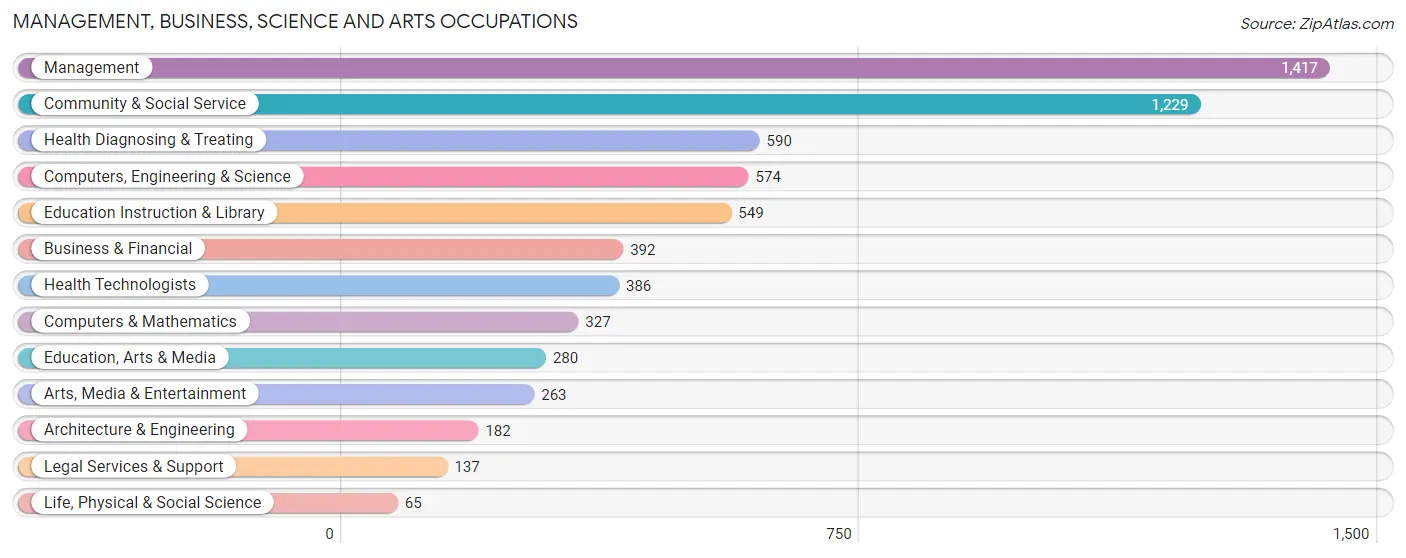
Management, Business, Science and Arts Occupations
The most common Management, Business, Science and Arts occupations in North Canton are Management (1,417 | 15.3%), Community & Social Service (1,229 | 13.3%), Health Diagnosing & Treating (590 | 6.4%), Computers, Engineering & Science (574 | 6.2%), and Education Instruction & Library (549 | 5.9%).
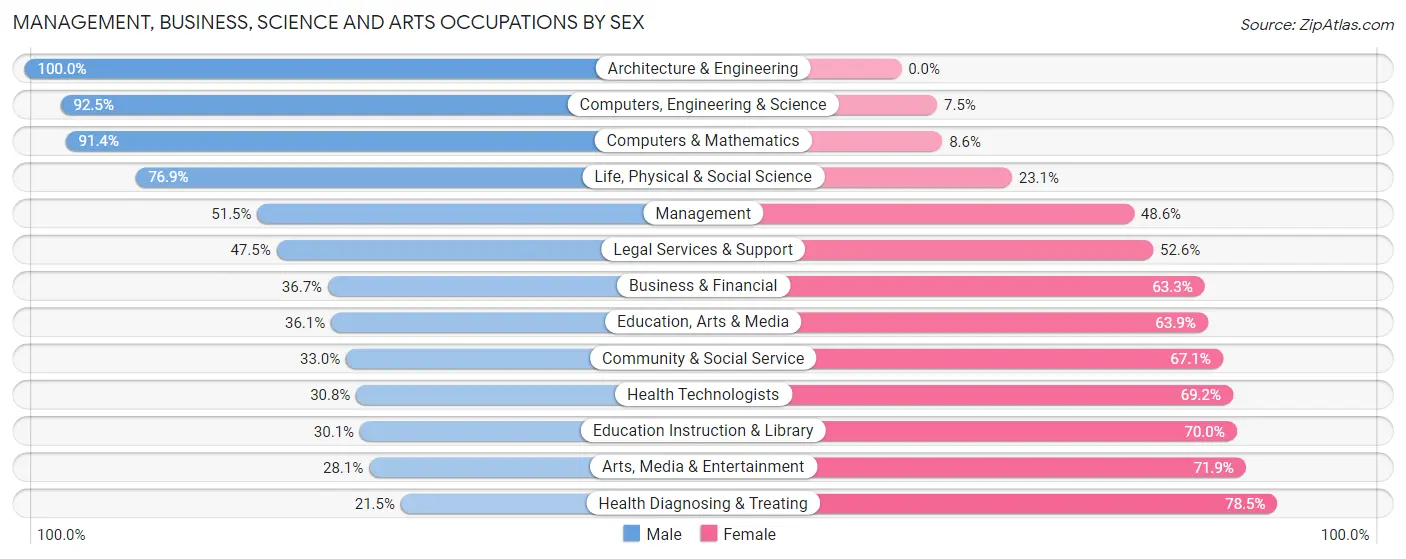
Management, Business, Science and Arts Occupations by Sex
Within the Management, Business, Science and Arts occupations in North Canton, the most male-oriented occupations are Architecture & Engineering (100.0%), Computers, Engineering & Science (92.5%), and Computers & Mathematics (91.4%), while the most female-oriented occupations are Health Diagnosing & Treating (78.5%), Arts, Media & Entertainment (71.9%), and Education Instruction & Library (70.0%).
| Occupation | Male | Female |
| Management | 729 (51.4%) | 688 (48.5%) |
| Business & Financial | 144 (36.7%) | 248 (63.3%) |
| Computers, Engineering & Science | 531 (92.5%) | 43 (7.5%) |
| Computers & Mathematics | 299 (91.4%) | 28 (8.6%) |
| Architecture & Engineering | 182 (100.0%) | 0 (0.0%) |
| Life, Physical & Social Science | 50 (76.9%) | 15 (23.1%) |
| Community & Social Service | 405 (33.0%) | 824 (67.0%) |
| Education, Arts & Media | 101 (36.1%) | 179 (63.9%) |
| Legal Services & Support | 65 (47.4%) | 72 (52.5%) |
| Education Instruction & Library | 165 (30.0%) | 384 (70.0%) |
| Arts, Media & Entertainment | 74 (28.1%) | 189 (71.9%) |
| Health Diagnosing & Treating | 127 (21.5%) | 463 (78.5%) |
| Health Technologists | 119 (30.8%) | 267 (69.2%) |
| Total (Category) | 1,936 (46.1%) | 2,266 (53.9%) |
| Total (Overall) | 4,579 (49.3%) | 4,699 (50.6%) |
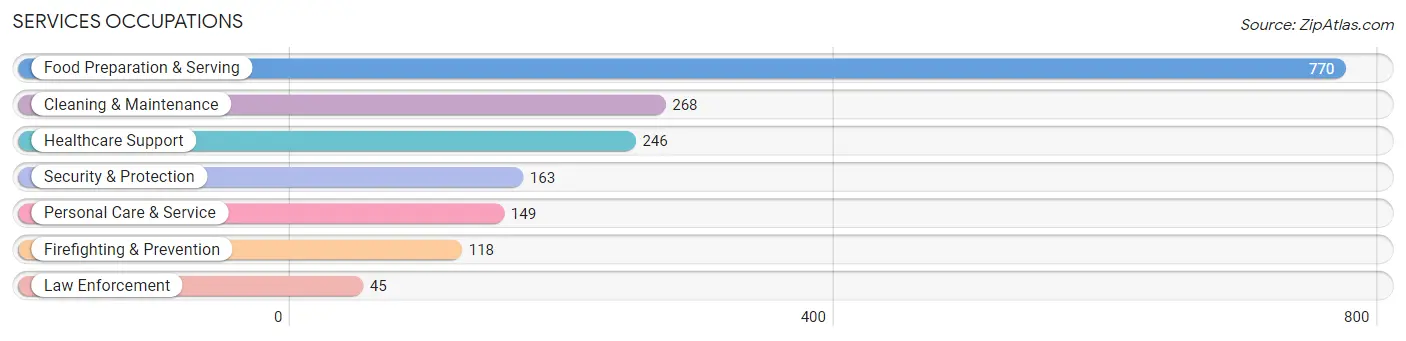
Services Occupations
The most common Services occupations in North Canton are Food Preparation & Serving (770 | 8.3%), Cleaning & Maintenance (268 | 2.9%), Healthcare Support (246 | 2.6%), Security & Protection (163 | 1.8%), and Personal Care & Service (149 | 1.6%).
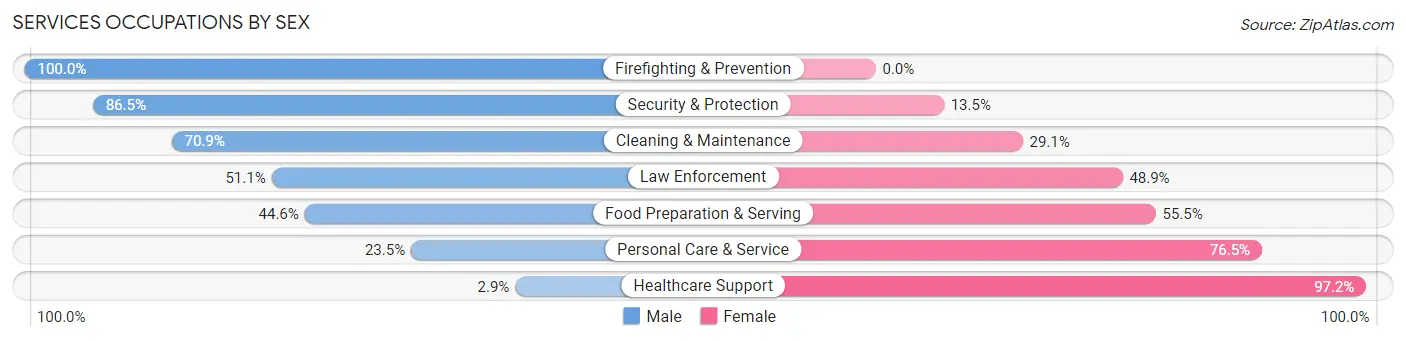
Services Occupations by Sex
Within the Services occupations in North Canton, the most male-oriented occupations are Firefighting & Prevention (100.0%), Security & Protection (86.5%), and Cleaning & Maintenance (70.9%), while the most female-oriented occupations are Healthcare Support (97.2%), Personal Care & Service (76.5%), and Food Preparation & Serving (55.4%).
| Occupation | Male | Female |
| Healthcare Support | 7 (2.9%) | 239 (97.2%) |
| Security & Protection | 141 (86.5%) | 22 (13.5%) |
| Firefighting & Prevention | 118 (100.0%) | 0 (0.0%) |
| Law Enforcement | 23 (51.1%) | 22 (48.9%) |
| Food Preparation & Serving | 343 (44.6%) | 427 (55.4%) |
| Cleaning & Maintenance | 190 (70.9%) | 78 (29.1%) |
| Personal Care & Service | 35 (23.5%) | 114 (76.5%) |
| Total (Category) | 716 (44.9%) | 880 (55.1%) |
| Total (Overall) | 4,579 (49.3%) | 4,699 (50.6%) |
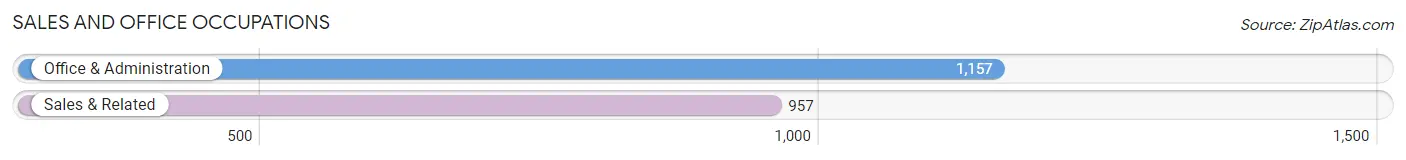
Sales and Office Occupations
The most common Sales and Office occupations in North Canton are Office & Administration (1,157 | 12.5%), and Sales & Related (957 | 10.3%).
Sales and Office Occupations by Sex
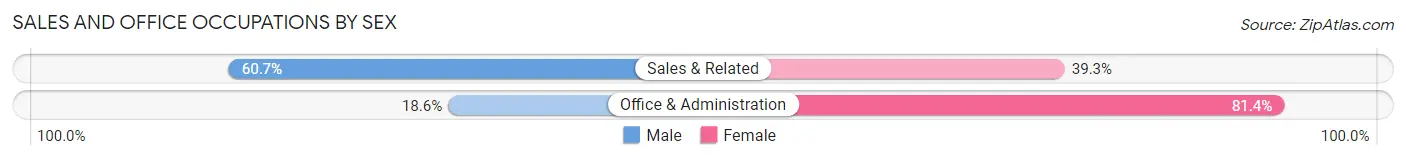
| Occupation | Male | Female |
| Sales & Related | 581 (60.7%) | 376 (39.3%) |
| Office & Administration | 215 (18.6%) | 942 (81.4%) |
| Total (Category) | 796 (37.7%) | 1,318 (62.4%) |
| Total (Overall) | 4,579 (49.3%) | 4,699 (50.6%) |
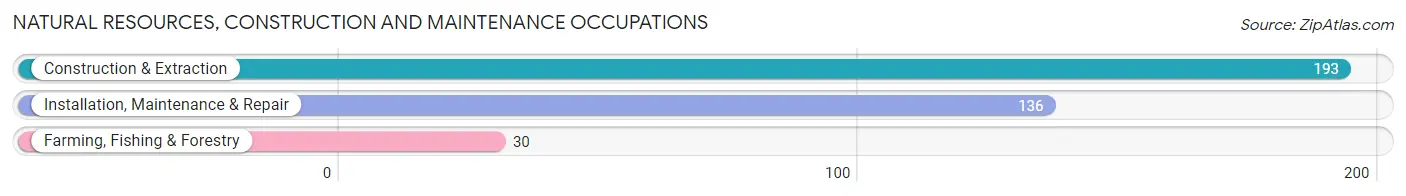
Natural Resources, Construction and Maintenance Occupations
The most common Natural Resources, Construction and Maintenance occupations in North Canton are Construction & Extraction (193 | 2.1%), Installation, Maintenance & Repair (136 | 1.5%), and Farming, Fishing & Forestry (30 | 0.3%).
Natural Resources, Construction and Maintenance Occupations by Sex
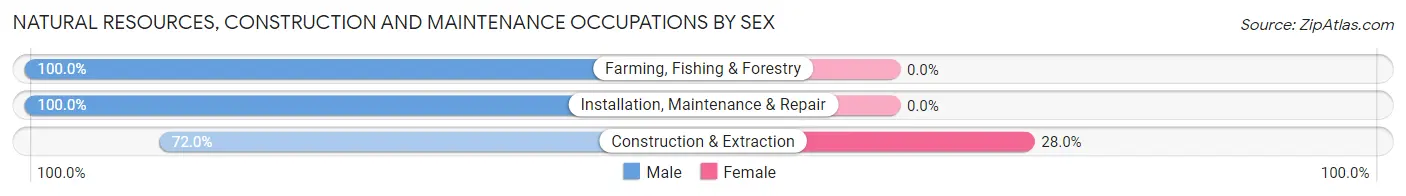
| Occupation | Male | Female |
| Farming, Fishing & Forestry | 30 (100.0%) | 0 (0.0%) |
| Construction & Extraction | 139 (72.0%) | 54 (28.0%) |
| Installation, Maintenance & Repair | 136 (100.0%) | 0 (0.0%) |
| Total (Category) | 305 (85.0%) | 54 (15.0%) |
| Total (Overall) | 4,579 (49.3%) | 4,699 (50.6%) |
Production, Transportation and Moving Occupations
The most common Production, Transportation and Moving occupations in North Canton are Production (582 | 6.3%), Transportation (281 | 3.0%), and Material Moving (144 | 1.5%).
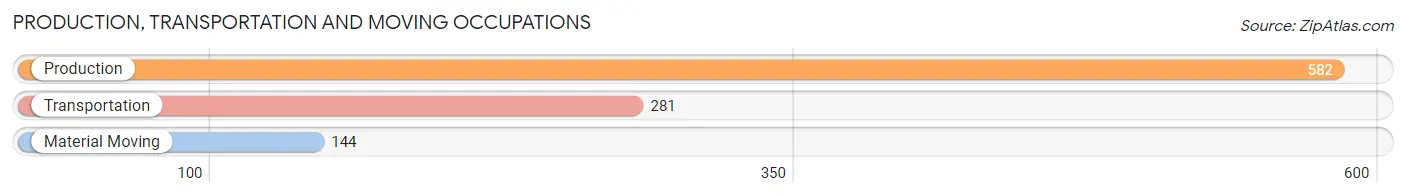
Production, Transportation and Moving Occupations by Sex
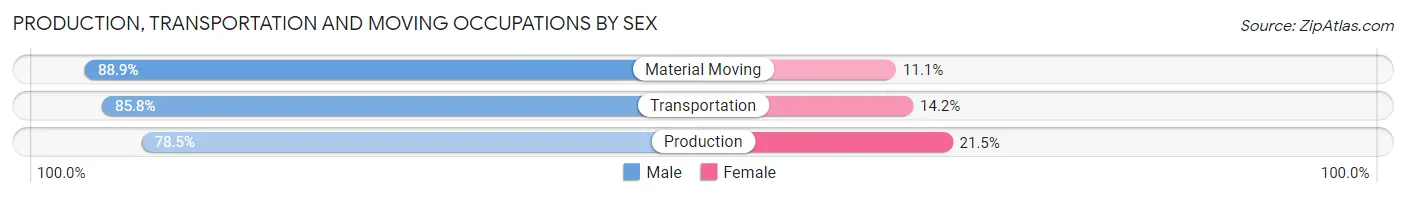
| Occupation | Male | Female |
| Production | 457 (78.5%) | 125 (21.5%) |
| Transportation | 241 (85.8%) | 40 (14.2%) |
| Material Moving | 128 (88.9%) | 16 (11.1%) |
| Total (Category) | 826 (82.0%) | 181 (18.0%) |
| Total (Overall) | 4,579 (49.3%) | 4,699 (50.6%) |
Employment Industries by Sex in North Canton
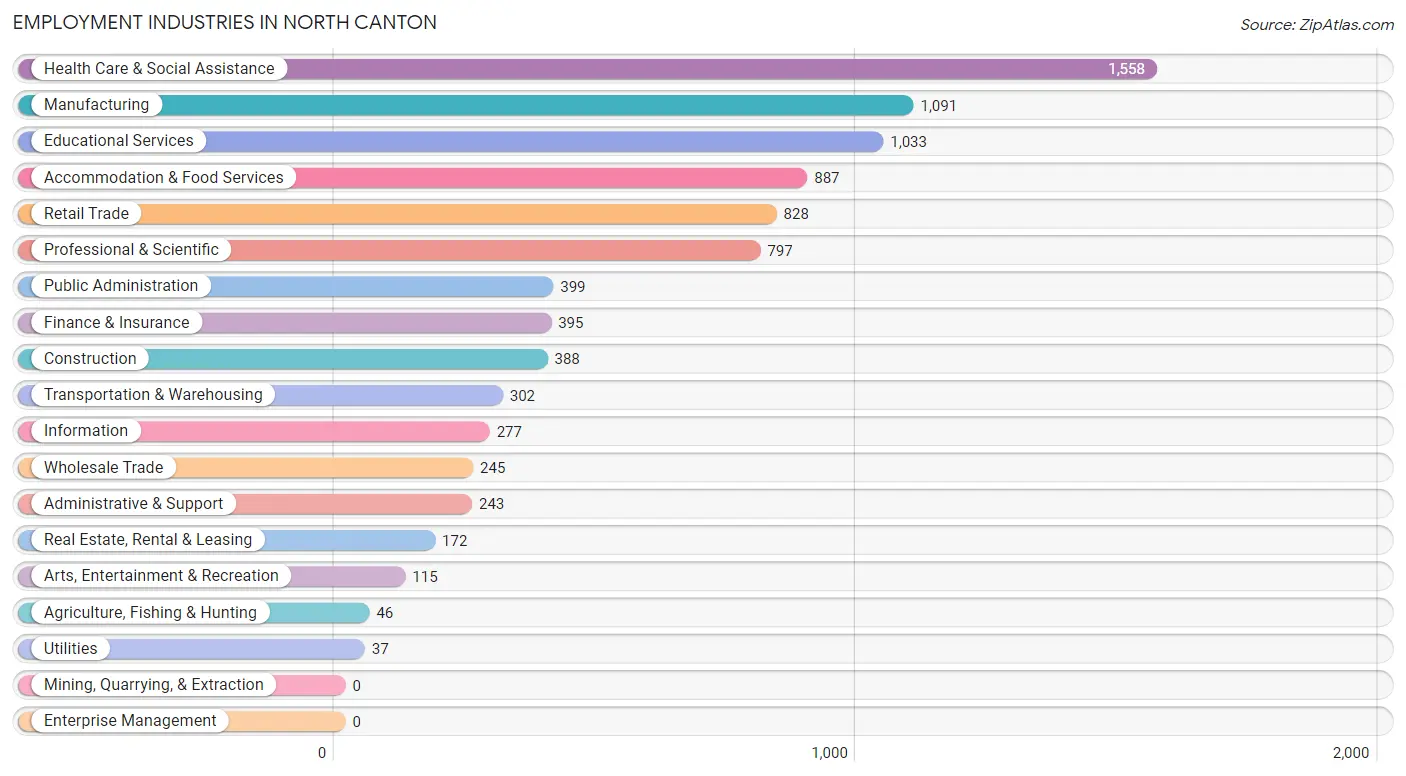
Employment Industries in North Canton
The major employment industries in North Canton include Health Care & Social Assistance (1,558 | 16.8%), Manufacturing (1,091 | 11.8%), Educational Services (1,033 | 11.1%), Accommodation & Food Services (887 | 9.6%), and Retail Trade (828 | 8.9%).
Employment Industries by Sex in North Canton
The North Canton industries that see more men than women are Transportation & Warehousing (77.1%), Real Estate, Rental & Leasing (70.9%), and Manufacturing (70.5%), whereas the industries that tend to have a higher number of women are Utilities (89.2%), Health Care & Social Assistance (77.7%), and Educational Services (67.4%).
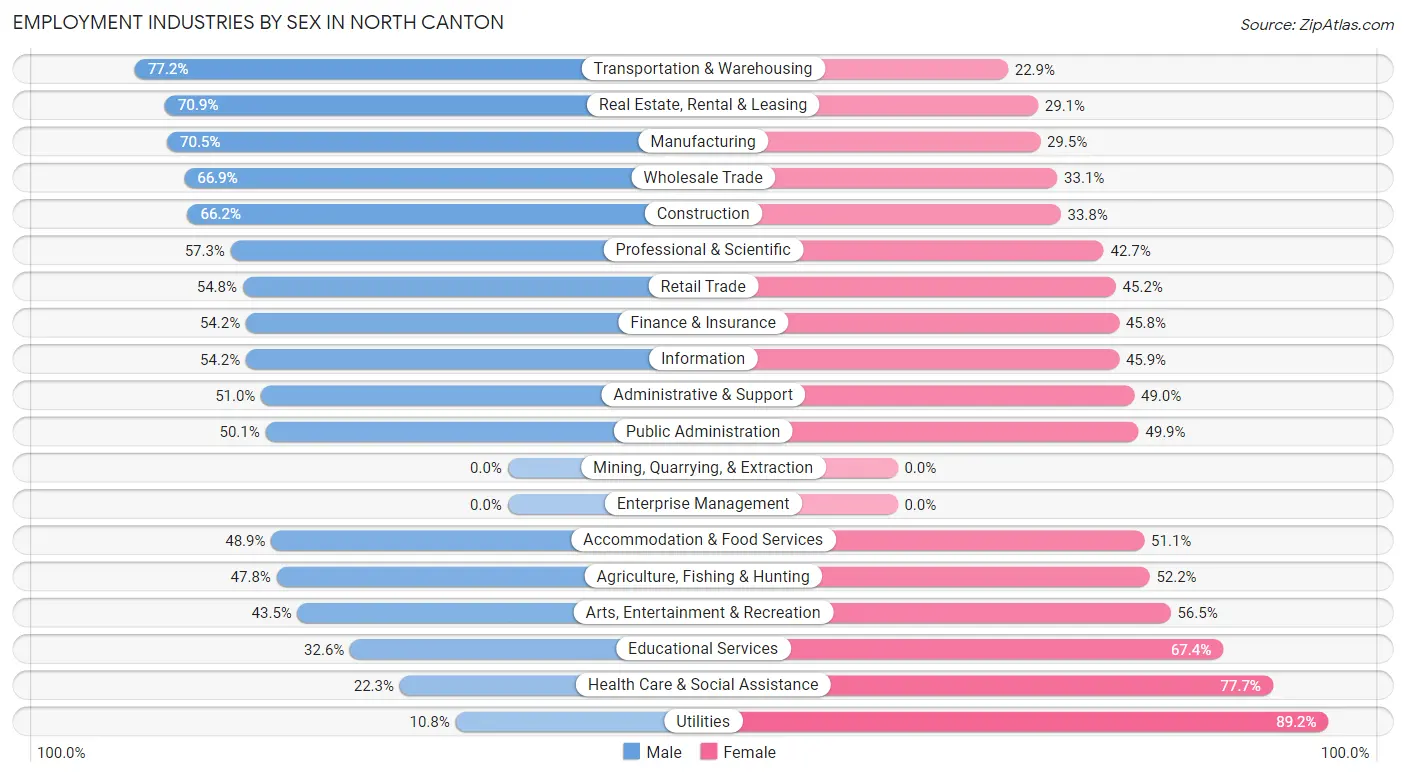
| Industry | Male | Female |
| Agriculture, Fishing & Hunting | 22 (47.8%) | 24 (52.2%) |
| Mining, Quarrying, & Extraction | 0 (0.0%) | 0 (0.0%) |
| Construction | 257 (66.2%) | 131 (33.8%) |
| Manufacturing | 769 (70.5%) | 322 (29.5%) |
| Wholesale Trade | 164 (66.9%) | 81 (33.1%) |
| Retail Trade | 454 (54.8%) | 374 (45.2%) |
| Transportation & Warehousing | 233 (77.1%) | 69 (22.9%) |
| Utilities | 4 (10.8%) | 33 (89.2%) |
| Information | 150 (54.1%) | 127 (45.9%) |
| Finance & Insurance | 214 (54.2%) | 181 (45.8%) |
| Real Estate, Rental & Leasing | 122 (70.9%) | 50 (29.1%) |
| Professional & Scientific | 457 (57.3%) | 340 (42.7%) |
| Enterprise Management | 0 (0.0%) | 0 (0.0%) |
| Administrative & Support | 124 (51.0%) | 119 (49.0%) |
| Educational Services | 337 (32.6%) | 696 (67.4%) |
| Health Care & Social Assistance | 348 (22.3%) | 1,210 (77.7%) |
| Arts, Entertainment & Recreation | 50 (43.5%) | 65 (56.5%) |
| Accommodation & Food Services | 434 (48.9%) | 453 (51.1%) |
| Public Administration | 200 (50.1%) | 199 (49.9%) |
| Total | 4,579 (49.3%) | 4,699 (50.6%) |
Education in North Canton
School Enrollment in North Canton
The most common levels of schooling among the 4,196 students in North Canton are college / undergraduate (1,460 | 34.8%), middle school (926 | 22.1%), and elementary school (675 | 16.1%).
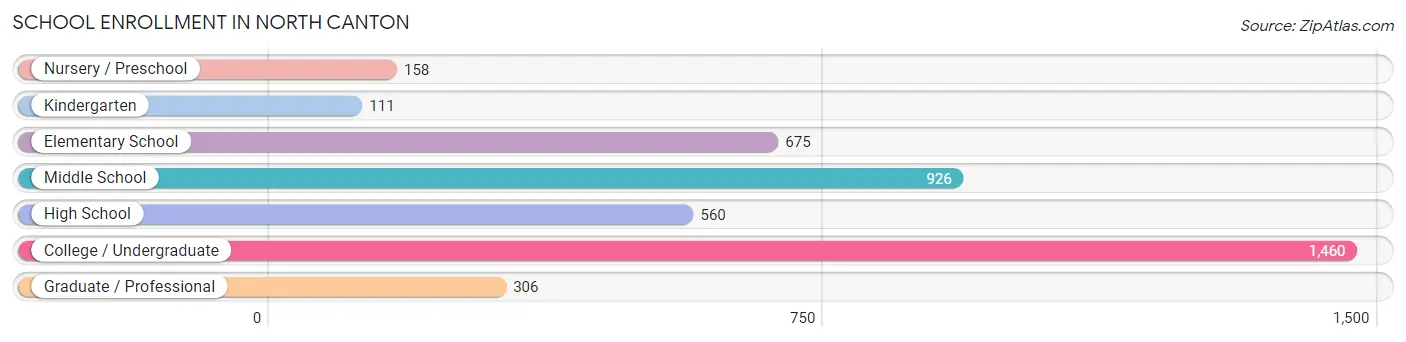
| School Level | # Students | % Students |
| Nursery / Preschool | 158 | 3.8% |
| Kindergarten | 111 | 2.6% |
| Elementary School | 675 | 16.1% |
| Middle School | 926 | 22.1% |
| High School | 560 | 13.4% |
| College / Undergraduate | 1,460 | 34.8% |
| Graduate / Professional | 306 | 7.3% |
| Total | 4,196 | 100.0% |
School Enrollment by Age by Funding Source in North Canton
Out of a total of 4,196 students who are enrolled in schools in North Canton, 1,519 (36.2%) attend a private institution, while the remaining 2,677 (63.8%) are enrolled in public schools. The age group of 18 to 19 year olds has the highest likelihood of being enrolled in private schools, with 604 (87.9% in the age bracket) enrolled. Conversely, the age group of 15 to 17 year olds has the lowest likelihood of being enrolled in a private school, with 443 (99.1% in the age bracket) attending a public institution.
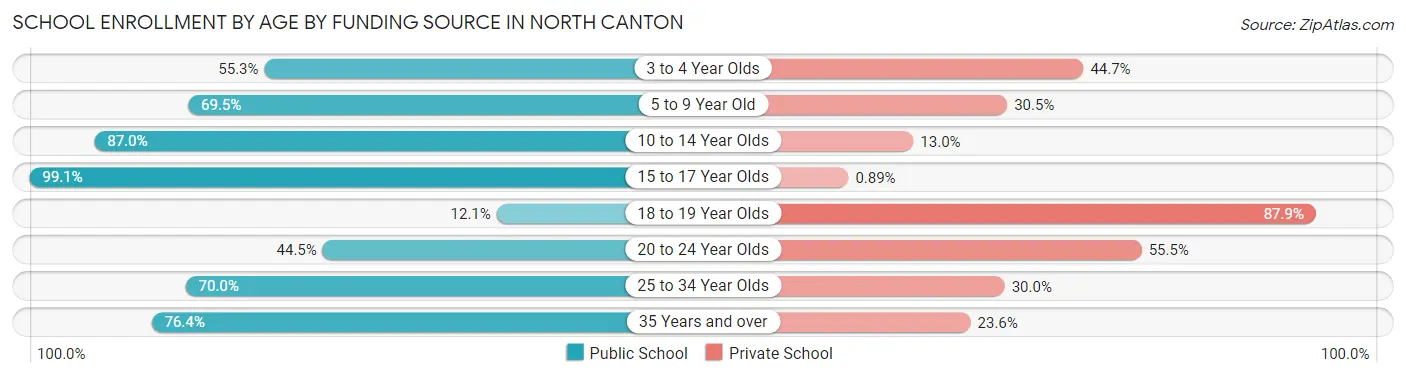
| Age Bracket | Public School | Private School |
| 3 to 4 Year Olds | 57 (55.3%) | 46 (44.7%) |
| 5 to 9 Year Old | 452 (69.5%) | 198 (30.5%) |
| 10 to 14 Year Olds | 1,038 (87.0%) | 155 (13.0%) |
| 15 to 17 Year Olds | 443 (99.1%) | 4 (0.9%) |
| 18 to 19 Year Olds | 83 (12.1%) | 604 (87.9%) |
| 20 to 24 Year Olds | 323 (44.5%) | 403 (55.5%) |
| 25 to 34 Year Olds | 196 (70.0%) | 84 (30.0%) |
| 35 Years and over | 84 (76.4%) | 26 (23.6%) |
| Total | 2,677 (63.8%) | 1,519 (36.2%) |
Educational Attainment by Field of Study in North Canton
Education (1,093 | 20.7%), business (1,038 | 19.6%), science & technology (567 | 10.7%), arts & humanities (389 | 7.4%), and physical & health sciences (315 | 6.0%) are the most common fields of study among 5,287 individuals in North Canton who have obtained a bachelor's degree or higher.
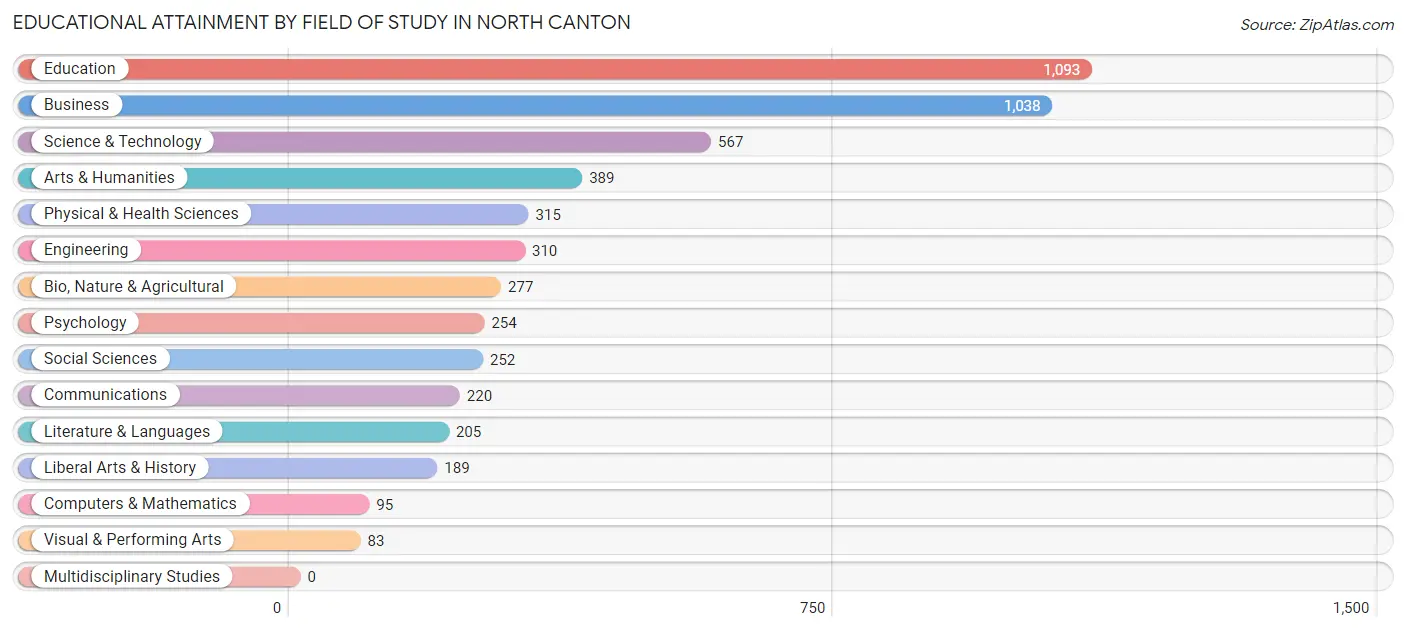
| Field of Study | # Graduates | % Graduates |
| Computers & Mathematics | 95 | 1.8% |
| Bio, Nature & Agricultural | 277 | 5.2% |
| Physical & Health Sciences | 315 | 6.0% |
| Psychology | 254 | 4.8% |
| Social Sciences | 252 | 4.8% |
| Engineering | 310 | 5.9% |
| Multidisciplinary Studies | 0 | 0.0% |
| Science & Technology | 567 | 10.7% |
| Business | 1,038 | 19.6% |
| Education | 1,093 | 20.7% |
| Literature & Languages | 205 | 3.9% |
| Liberal Arts & History | 189 | 3.6% |
| Visual & Performing Arts | 83 | 1.6% |
| Communications | 220 | 4.2% |
| Arts & Humanities | 389 | 7.4% |
| Total | 5,287 | 100.0% |
Transportation & Commute in North Canton
Vehicle Availability by Sex in North Canton
The most prevalent vehicle ownership categories in North Canton are males with 2 vehicles (2,683, accounting for 59.0%) and females with 2 vehicles (2,301, making up 60.9%).
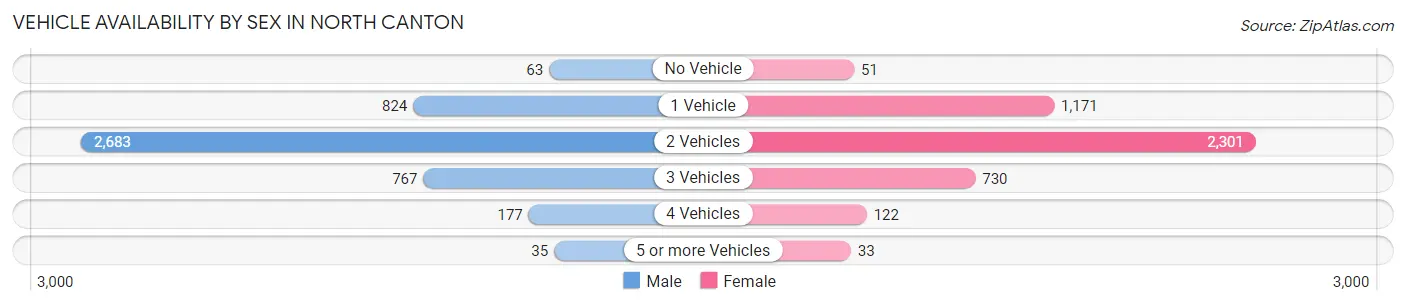
| Vehicles Available | Male | Female |
| No Vehicle | 63 (1.4%) | 51 (1.2%) |
| 1 Vehicle | 824 (18.1%) | 1,171 (26.6%) |
| 2 Vehicles | 2,683 (59.0%) | 2,301 (52.2%) |
| 3 Vehicles | 767 (16.9%) | 730 (16.6%) |
| 4 Vehicles | 177 (3.9%) | 122 (2.8%) |
| 5 or more Vehicles | 35 (0.8%) | 33 (0.7%) |
| Total | 4,549 (100.0%) | 4,408 (100.0%) |
Commute Time in North Canton
The most frequently occuring commute durations in North Canton are 5 to 9 minutes (1,484 commuters, 19.2%), 15 to 19 minutes (1,381 commuters, 17.9%), and 10 to 14 minutes (1,306 commuters, 16.9%).
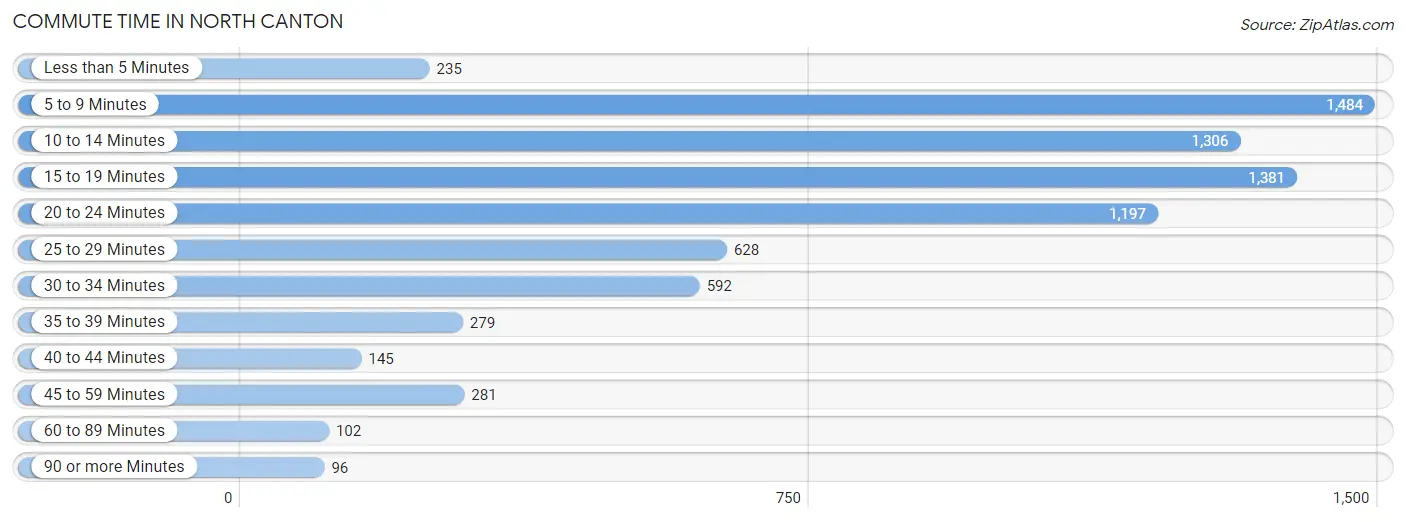
| Commute Time | # Commuters | % Commuters |
| Less than 5 Minutes | 235 | 3.0% |
| 5 to 9 Minutes | 1,484 | 19.2% |
| 10 to 14 Minutes | 1,306 | 16.9% |
| 15 to 19 Minutes | 1,381 | 17.9% |
| 20 to 24 Minutes | 1,197 | 15.5% |
| 25 to 29 Minutes | 628 | 8.1% |
| 30 to 34 Minutes | 592 | 7.7% |
| 35 to 39 Minutes | 279 | 3.6% |
| 40 to 44 Minutes | 145 | 1.9% |
| 45 to 59 Minutes | 281 | 3.6% |
| 60 to 89 Minutes | 102 | 1.3% |
| 90 or more Minutes | 96 | 1.2% |
Commute Time by Sex in North Canton
The most common commute times in North Canton are 20 to 24 minutes (777 commuters, 19.8%) for males and 10 to 14 minutes (807 commuters, 21.2%) for females.
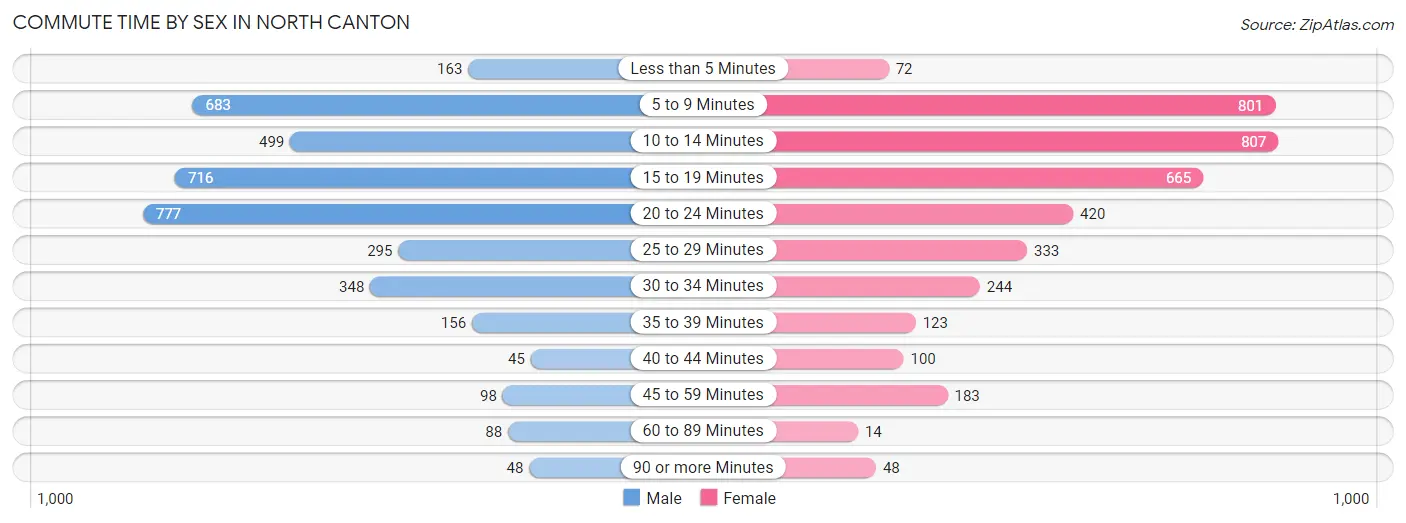
| Commute Time | Male | Female |
| Less than 5 Minutes | 163 (4.2%) | 72 (1.9%) |
| 5 to 9 Minutes | 683 (17.4%) | 801 (21.0%) |
| 10 to 14 Minutes | 499 (12.7%) | 807 (21.2%) |
| 15 to 19 Minutes | 716 (18.3%) | 665 (17.4%) |
| 20 to 24 Minutes | 777 (19.8%) | 420 (11.0%) |
| 25 to 29 Minutes | 295 (7.5%) | 333 (8.7%) |
| 30 to 34 Minutes | 348 (8.9%) | 244 (6.4%) |
| 35 to 39 Minutes | 156 (4.0%) | 123 (3.2%) |
| 40 to 44 Minutes | 45 (1.1%) | 100 (2.6%) |
| 45 to 59 Minutes | 98 (2.5%) | 183 (4.8%) |
| 60 to 89 Minutes | 88 (2.2%) | 14 (0.4%) |
| 90 or more Minutes | 48 (1.2%) | 48 (1.3%) |
Time of Departure to Work by Sex in North Canton
The most frequent times of departure to work in North Canton are 6:30 AM to 6:59 AM (673, 17.2%) for males and 7:30 AM to 7:59 AM (700, 18.4%) for females.
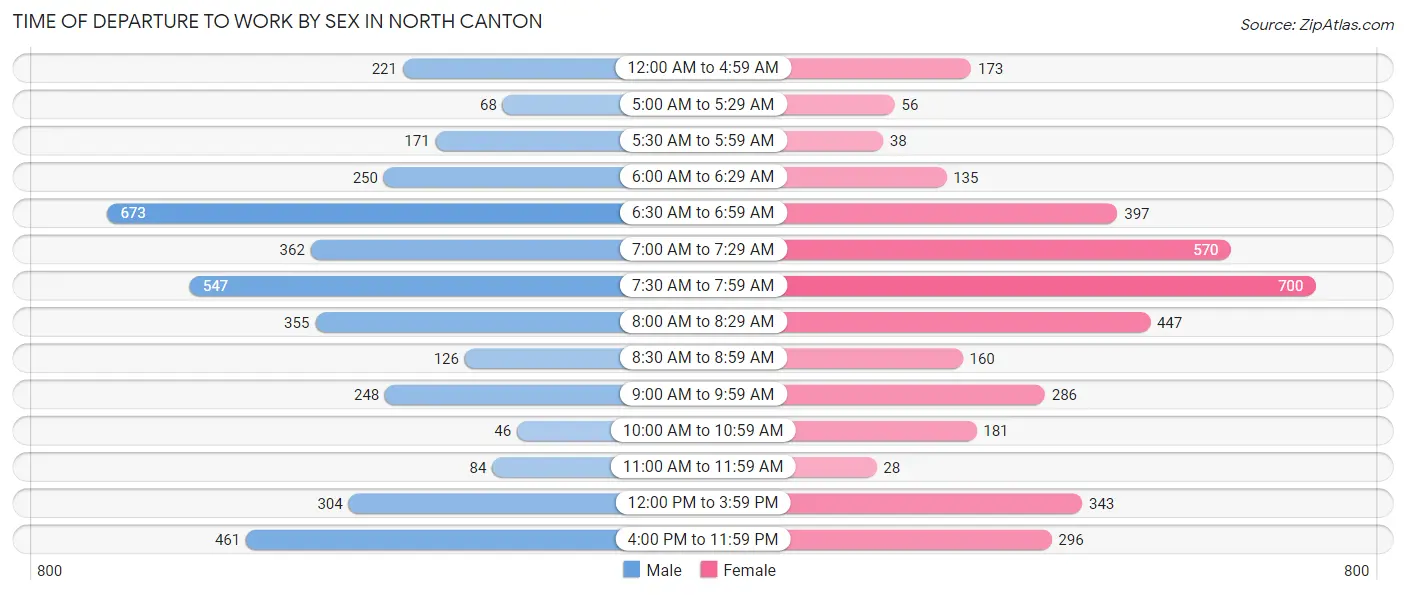
| Time of Departure | Male | Female |
| 12:00 AM to 4:59 AM | 221 (5.6%) | 173 (4.5%) |
| 5:00 AM to 5:29 AM | 68 (1.7%) | 56 (1.5%) |
| 5:30 AM to 5:59 AM | 171 (4.4%) | 38 (1.0%) |
| 6:00 AM to 6:29 AM | 250 (6.4%) | 135 (3.5%) |
| 6:30 AM to 6:59 AM | 673 (17.2%) | 397 (10.4%) |
| 7:00 AM to 7:29 AM | 362 (9.2%) | 570 (15.0%) |
| 7:30 AM to 7:59 AM | 547 (14.0%) | 700 (18.4%) |
| 8:00 AM to 8:29 AM | 355 (9.1%) | 447 (11.7%) |
| 8:30 AM to 8:59 AM | 126 (3.2%) | 160 (4.2%) |
| 9:00 AM to 9:59 AM | 248 (6.3%) | 286 (7.5%) |
| 10:00 AM to 10:59 AM | 46 (1.2%) | 181 (4.8%) |
| 11:00 AM to 11:59 AM | 84 (2.1%) | 28 (0.7%) |
| 12:00 PM to 3:59 PM | 304 (7.8%) | 343 (9.0%) |
| 4:00 PM to 11:59 PM | 461 (11.8%) | 296 (7.8%) |
| Total | 3,916 (100.0%) | 3,810 (100.0%) |
Housing Occupancy in North Canton
Occupancy by Ownership in North Canton
Of the total 8,046 dwellings in North Canton, owner-occupied units account for 5,470 (68.0%), while renter-occupied units make up 2,576 (32.0%).
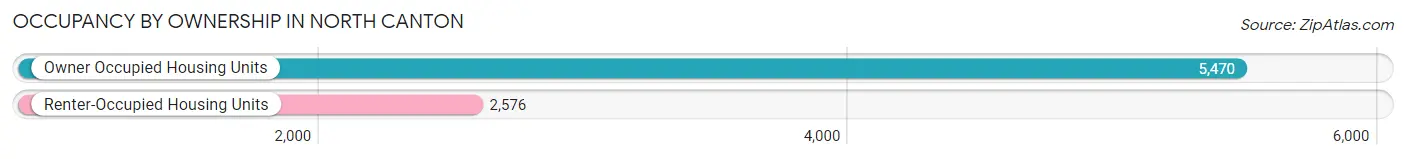
| Occupancy | # Housing Units | % Housing Units |
| Owner Occupied Housing Units | 5,470 | 68.0% |
| Renter-Occupied Housing Units | 2,576 | 32.0% |
| Total Occupied Housing Units | 8,046 | 100.0% |
Occupancy by Household Size in North Canton
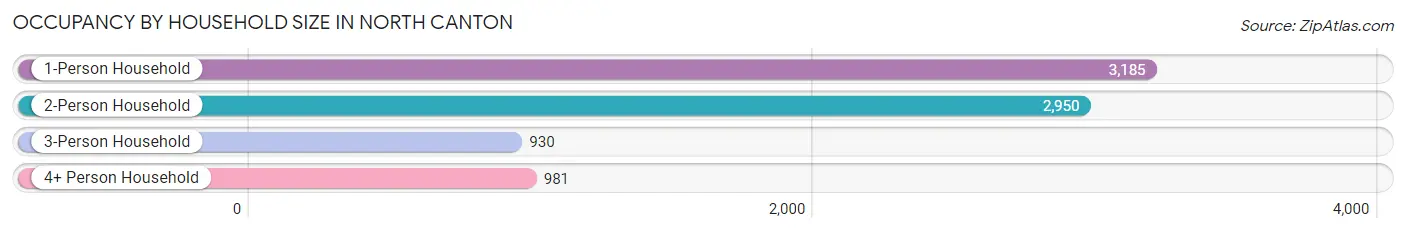
| Household Size | # Housing Units | % Housing Units |
| 1-Person Household | 3,185 | 39.6% |
| 2-Person Household | 2,950 | 36.7% |
| 3-Person Household | 930 | 11.6% |
| 4+ Person Household | 981 | 12.2% |
| Total Housing Units | 8,046 | 100.0% |
Occupancy by Ownership by Household Size in North Canton
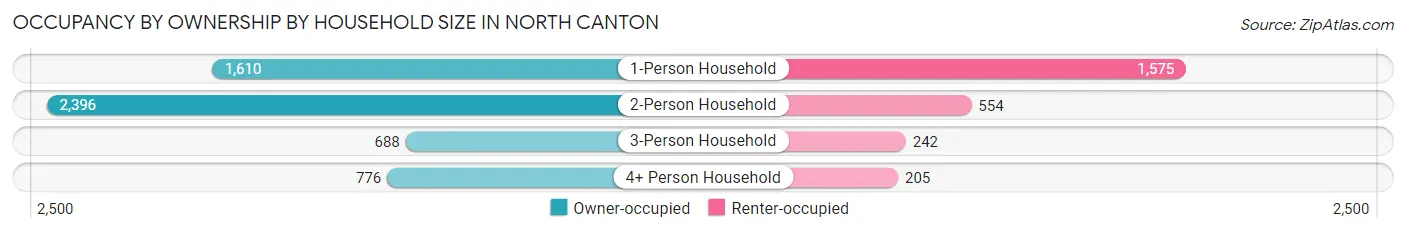
| Household Size | Owner-occupied | Renter-occupied |
| 1-Person Household | 1,610 (50.5%) | 1,575 (49.4%) |
| 2-Person Household | 2,396 (81.2%) | 554 (18.8%) |
| 3-Person Household | 688 (74.0%) | 242 (26.0%) |
| 4+ Person Household | 776 (79.1%) | 205 (20.9%) |
| Total Housing Units | 5,470 (68.0%) | 2,576 (32.0%) |
Occupancy by Educational Attainment in North Canton
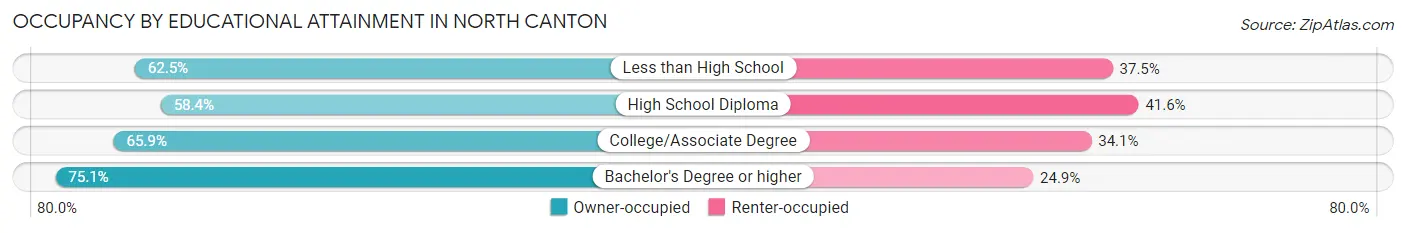
| Household Size | Owner-occupied | Renter-occupied |
| Less than High School | 110 (62.5%) | 66 (37.5%) |
| High School Diploma | 1,102 (58.4%) | 785 (41.6%) |
| College/Associate Degree | 1,684 (65.9%) | 872 (34.1%) |
| Bachelor's Degree or higher | 2,574 (75.1%) | 853 (24.9%) |
Occupancy by Age of Householder in North Canton
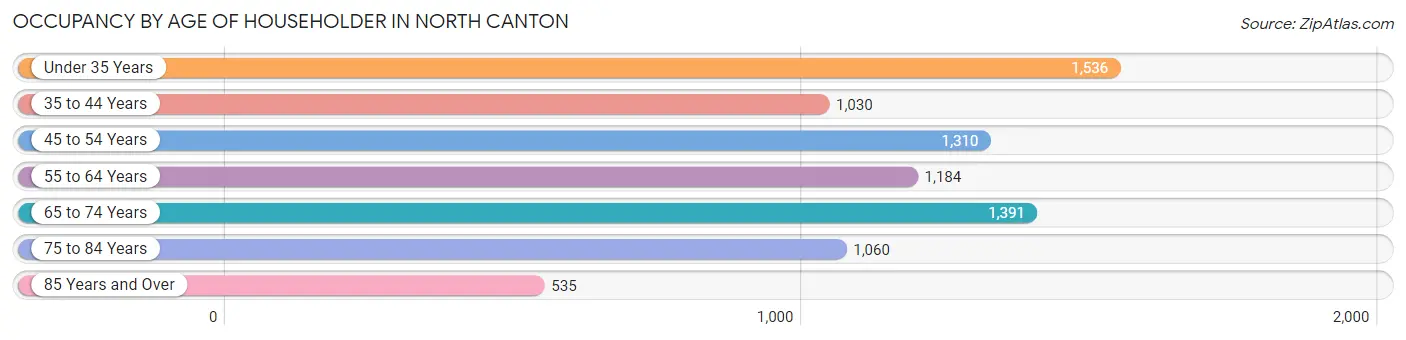
| Age Bracket | # Households | % Households |
| Under 35 Years | 1,536 | 19.1% |
| 35 to 44 Years | 1,030 | 12.8% |
| 45 to 54 Years | 1,310 | 16.3% |
| 55 to 64 Years | 1,184 | 14.7% |
| 65 to 74 Years | 1,391 | 17.3% |
| 75 to 84 Years | 1,060 | 13.2% |
| 85 Years and Over | 535 | 6.7% |
| Total | 8,046 | 100.0% |
Housing Finances in North Canton
Median Income by Occupancy in North Canton
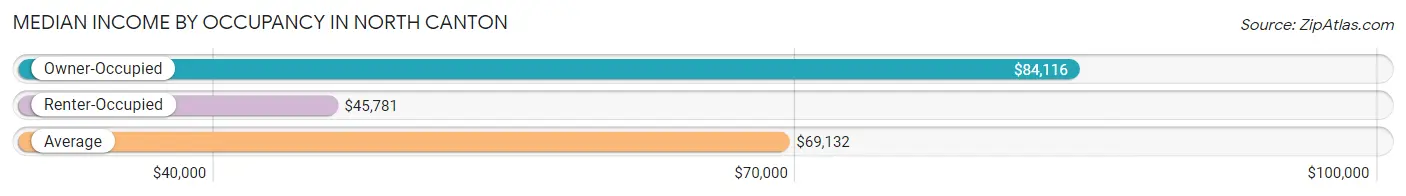
| Occupancy Type | # Households | Median Income |
| Owner-Occupied | 5,470 (68.0%) | $84,116 |
| Renter-Occupied | 2,576 (32.0%) | $45,781 |
| Average | 8,046 (100.0%) | $69,132 |
Occupancy by Householder Income Bracket in North Canton
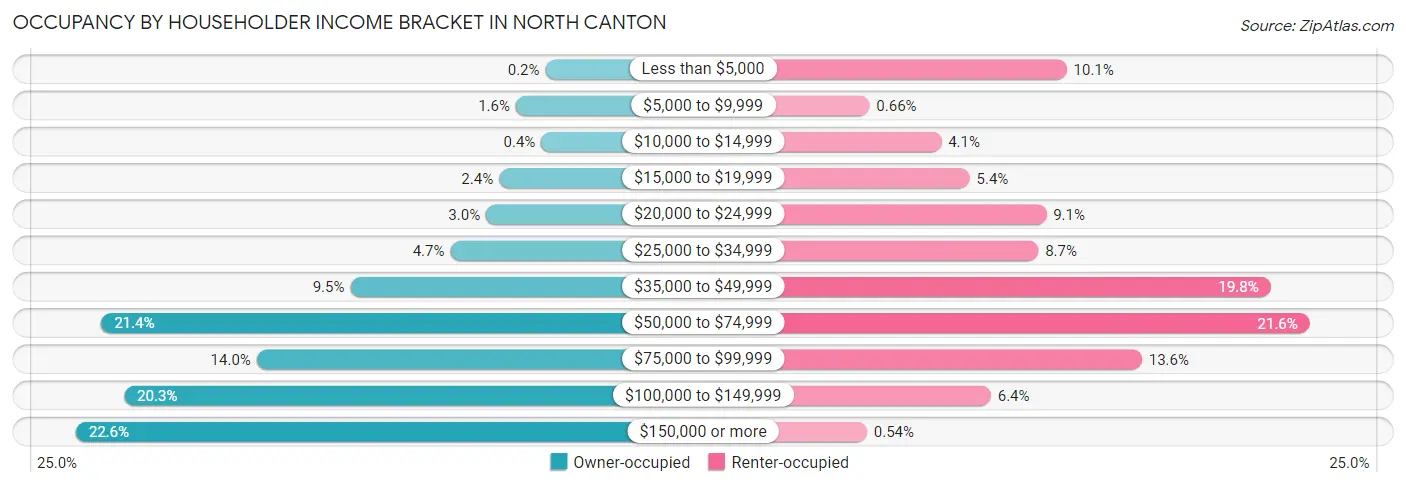
| Income Bracket | Owner-occupied | Renter-occupied |
| Less than $5,000 | 11 (0.2%) | 259 (10.1%) |
| $5,000 to $9,999 | 88 (1.6%) | 17 (0.7%) |
| $10,000 to $14,999 | 22 (0.4%) | 105 (4.1%) |
| $15,000 to $19,999 | 132 (2.4%) | 140 (5.4%) |
| $20,000 to $24,999 | 166 (3.0%) | 234 (9.1%) |
| $25,000 to $34,999 | 259 (4.7%) | 224 (8.7%) |
| $35,000 to $49,999 | 519 (9.5%) | 509 (19.8%) |
| $50,000 to $74,999 | 1,168 (21.3%) | 557 (21.6%) |
| $75,000 to $99,999 | 763 (14.0%) | 351 (13.6%) |
| $100,000 to $149,999 | 1,108 (20.3%) | 166 (6.4%) |
| $150,000 or more | 1,234 (22.6%) | 14 (0.5%) |
| Total | 5,470 (100.0%) | 2,576 (100.0%) |
Monthly Housing Cost Tiers in North Canton
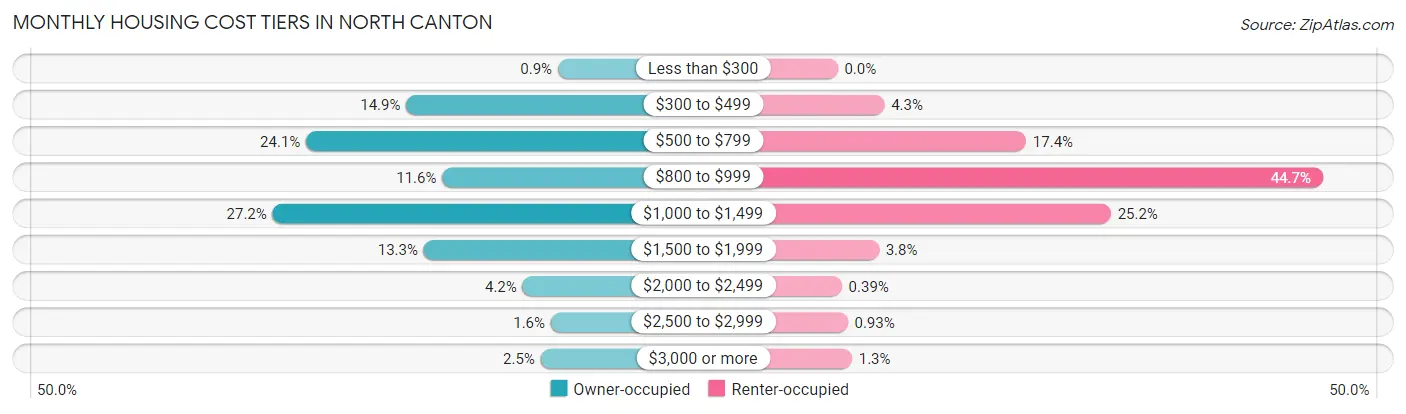
| Monthly Cost | Owner-occupied | Renter-occupied |
| Less than $300 | 49 (0.9%) | 0 (0.0%) |
| $300 to $499 | 813 (14.9%) | 111 (4.3%) |
| $500 to $799 | 1,317 (24.1%) | 447 (17.3%) |
| $800 to $999 | 632 (11.6%) | 1,151 (44.7%) |
| $1,000 to $1,499 | 1,486 (27.2%) | 648 (25.2%) |
| $1,500 to $1,999 | 725 (13.3%) | 98 (3.8%) |
| $2,000 to $2,499 | 227 (4.2%) | 10 (0.4%) |
| $2,500 to $2,999 | 85 (1.5%) | 24 (0.9%) |
| $3,000 or more | 136 (2.5%) | 34 (1.3%) |
| Total | 5,470 (100.0%) | 2,576 (100.0%) |
Physical Housing Characteristics in North Canton
Housing Structures in North Canton
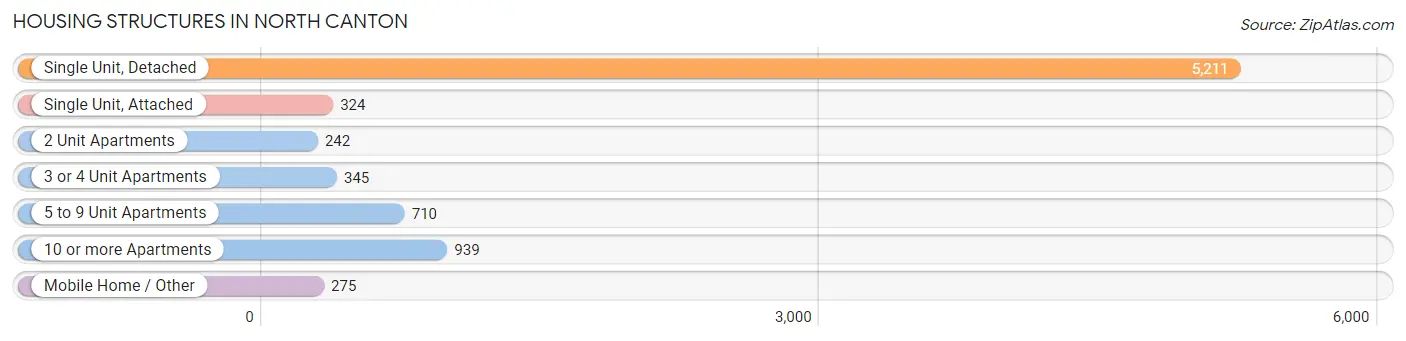
| Structure Type | # Housing Units | % Housing Units |
| Single Unit, Detached | 5,211 | 64.8% |
| Single Unit, Attached | 324 | 4.0% |
| 2 Unit Apartments | 242 | 3.0% |
| 3 or 4 Unit Apartments | 345 | 4.3% |
| 5 to 9 Unit Apartments | 710 | 8.8% |
| 10 or more Apartments | 939 | 11.7% |
| Mobile Home / Other | 275 | 3.4% |
| Total | 8,046 | 100.0% |
Housing Structures by Occupancy in North Canton
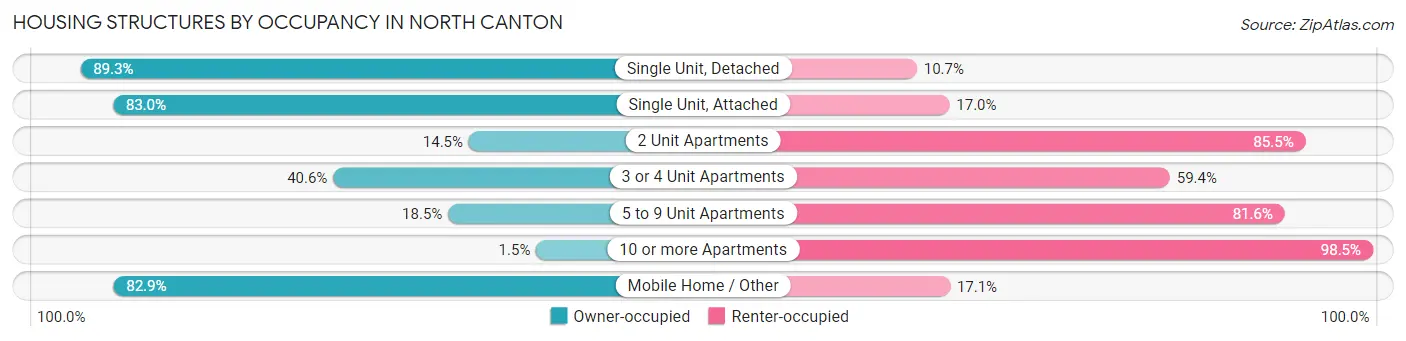
| Structure Type | Owner-occupied | Renter-occupied |
| Single Unit, Detached | 4,653 (89.3%) | 558 (10.7%) |
| Single Unit, Attached | 269 (83.0%) | 55 (17.0%) |
| 2 Unit Apartments | 35 (14.5%) | 207 (85.5%) |
| 3 or 4 Unit Apartments | 140 (40.6%) | 205 (59.4%) |
| 5 to 9 Unit Apartments | 131 (18.4%) | 579 (81.6%) |
| 10 or more Apartments | 14 (1.5%) | 925 (98.5%) |
| Mobile Home / Other | 228 (82.9%) | 47 (17.1%) |
| Total | 5,470 (68.0%) | 2,576 (32.0%) |
Housing Structures by Number of Rooms in North Canton
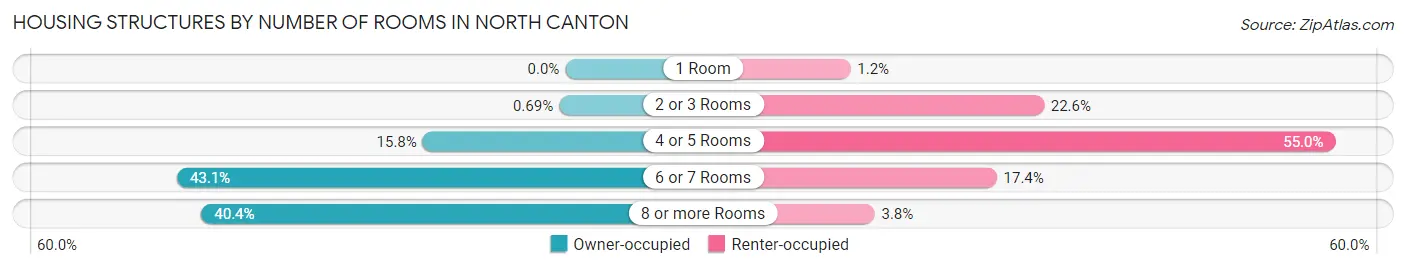
| Number of Rooms | Owner-occupied | Renter-occupied |
| 1 Room | 0 (0.0%) | 30 (1.2%) |
| 2 or 3 Rooms | 38 (0.7%) | 583 (22.6%) |
| 4 or 5 Rooms | 866 (15.8%) | 1,416 (55.0%) |
| 6 or 7 Rooms | 2,357 (43.1%) | 448 (17.4%) |
| 8 or more Rooms | 2,209 (40.4%) | 99 (3.8%) |
| Total | 5,470 (100.0%) | 2,576 (100.0%) |
Housing Structure by Heating Type in North Canton
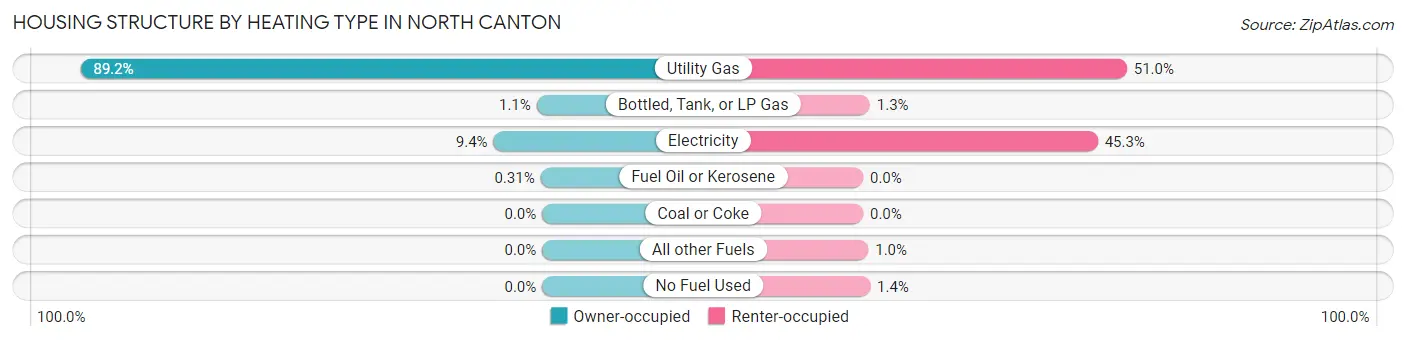
| Heating Type | Owner-occupied | Renter-occupied |
| Utility Gas | 4,881 (89.2%) | 1,313 (51.0%) |
| Bottled, Tank, or LP Gas | 58 (1.1%) | 34 (1.3%) |
| Electricity | 514 (9.4%) | 1,168 (45.3%) |
| Fuel Oil or Kerosene | 17 (0.3%) | 0 (0.0%) |
| Coal or Coke | 0 (0.0%) | 0 (0.0%) |
| All other Fuels | 0 (0.0%) | 26 (1.0%) |
| No Fuel Used | 0 (0.0%) | 35 (1.4%) |
| Total | 5,470 (100.0%) | 2,576 (100.0%) |
Household Vehicle Usage in North Canton
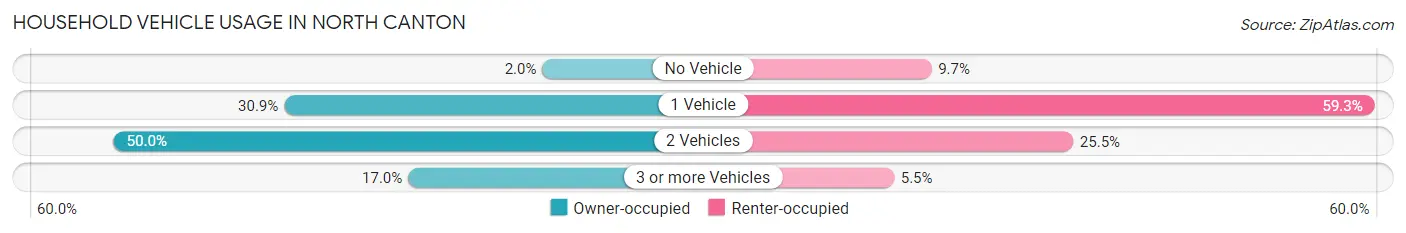
| Vehicles per Household | Owner-occupied | Renter-occupied |
| No Vehicle | 110 (2.0%) | 249 (9.7%) |
| 1 Vehicle | 1,692 (30.9%) | 1,528 (59.3%) |
| 2 Vehicles | 2,736 (50.0%) | 658 (25.5%) |
| 3 or more Vehicles | 932 (17.0%) | 141 (5.5%) |
| Total | 5,470 (100.0%) | 2,576 (100.0%) |
Real Estate & Mortgages in North Canton
Real Estate and Mortgage Overview in North Canton
| Characteristic | Without Mortgage | With Mortgage |
| Housing Units | 2,265 | 3,205 |
| Median Property Value | $180,500 | $190,200 |
| Median Household Income | $72,199 | $619 |
| Monthly Housing Costs | $550 | $125 |
| Real Estate Taxes | $2,560 | $92 |
Property Value by Mortgage Status in North Canton
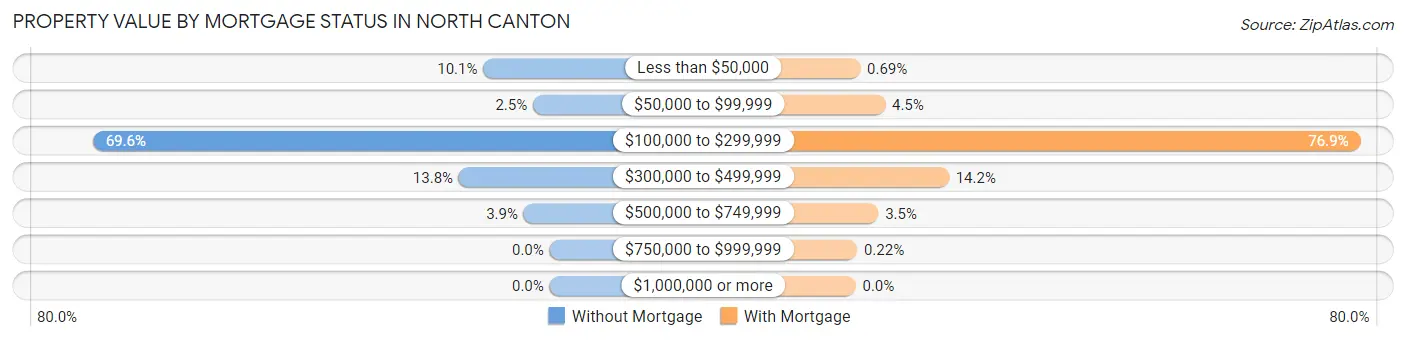
| Property Value | Without Mortgage | With Mortgage |
| Less than $50,000 | 229 (10.1%) | 22 (0.7%) |
| $50,000 to $99,999 | 57 (2.5%) | 144 (4.5%) |
| $100,000 to $299,999 | 1,577 (69.6%) | 2,466 (76.9%) |
| $300,000 to $499,999 | 313 (13.8%) | 455 (14.2%) |
| $500,000 to $749,999 | 89 (3.9%) | 111 (3.5%) |
| $750,000 to $999,999 | 0 (0.0%) | 7 (0.2%) |
| $1,000,000 or more | 0 (0.0%) | 0 (0.0%) |
| Total | 2,265 (100.0%) | 3,205 (100.0%) |
Household Income by Mortgage Status in North Canton
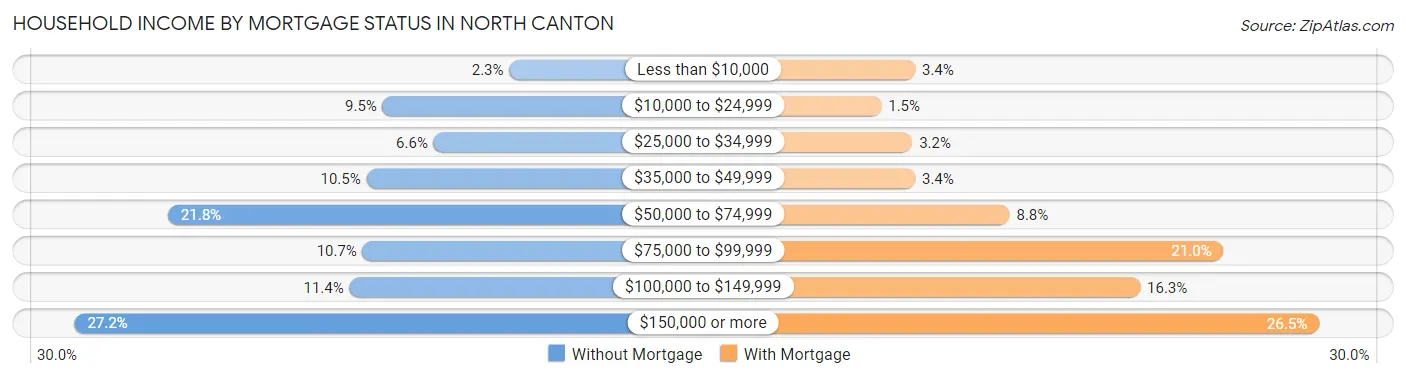
| Household Income | Without Mortgage | With Mortgage |
| Less than $10,000 | 52 (2.3%) | 109 (3.4%) |
| $10,000 to $24,999 | 216 (9.5%) | 47 (1.5%) |
| $25,000 to $34,999 | 150 (6.6%) | 104 (3.2%) |
| $35,000 to $49,999 | 237 (10.5%) | 109 (3.4%) |
| $50,000 to $74,999 | 494 (21.8%) | 282 (8.8%) |
| $75,000 to $99,999 | 242 (10.7%) | 674 (21.0%) |
| $100,000 to $149,999 | 259 (11.4%) | 521 (16.3%) |
| $150,000 or more | 615 (27.2%) | 849 (26.5%) |
| Total | 2,265 (100.0%) | 3,205 (100.0%) |
Property Value to Household Income Ratio in North Canton
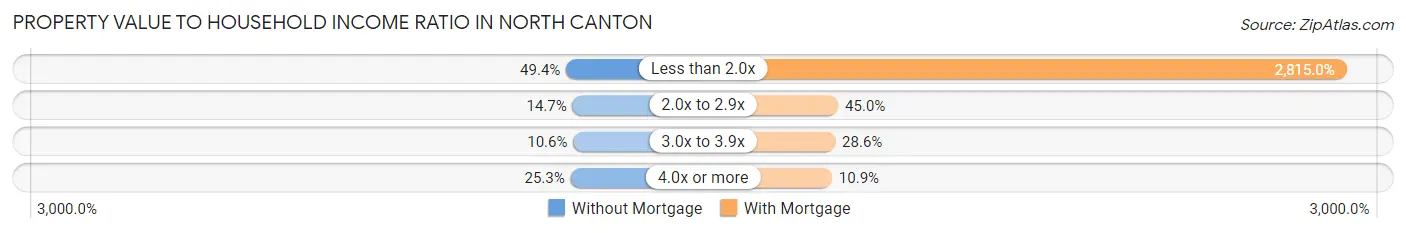
| Value-to-Income Ratio | Without Mortgage | With Mortgage |
| Less than 2.0x | 1,118 (49.4%) | 90,219 (2,814.9%) |
| 2.0x to 2.9x | 332 (14.7%) | 1,442 (45.0%) |
| 3.0x to 3.9x | 241 (10.6%) | 917 (28.6%) |
| 4.0x or more | 574 (25.3%) | 348 (10.9%) |
| Total | 2,265 (100.0%) | 3,205 (100.0%) |
Real Estate Taxes by Mortgage Status in North Canton
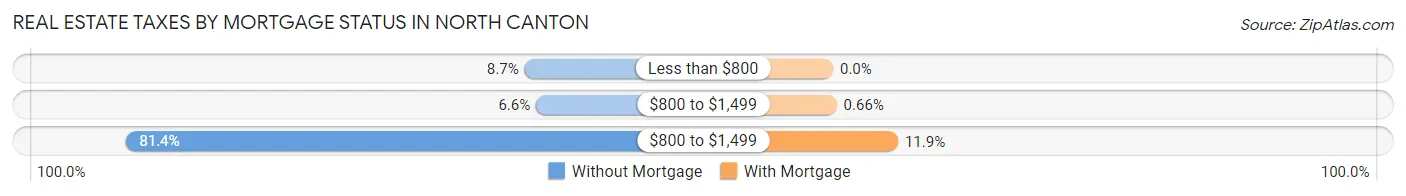
| Property Taxes | Without Mortgage | With Mortgage |
| Less than $800 | 197 (8.7%) | 0 (0.0%) |
| $800 to $1,499 | 149 (6.6%) | 21 (0.7%) |
| $800 to $1,499 | 1,844 (81.4%) | 380 (11.9%) |
| Total | 2,265 (100.0%) | 3,205 (100.0%) |
Health & Disability in North Canton
Health Insurance Coverage by Age in North Canton
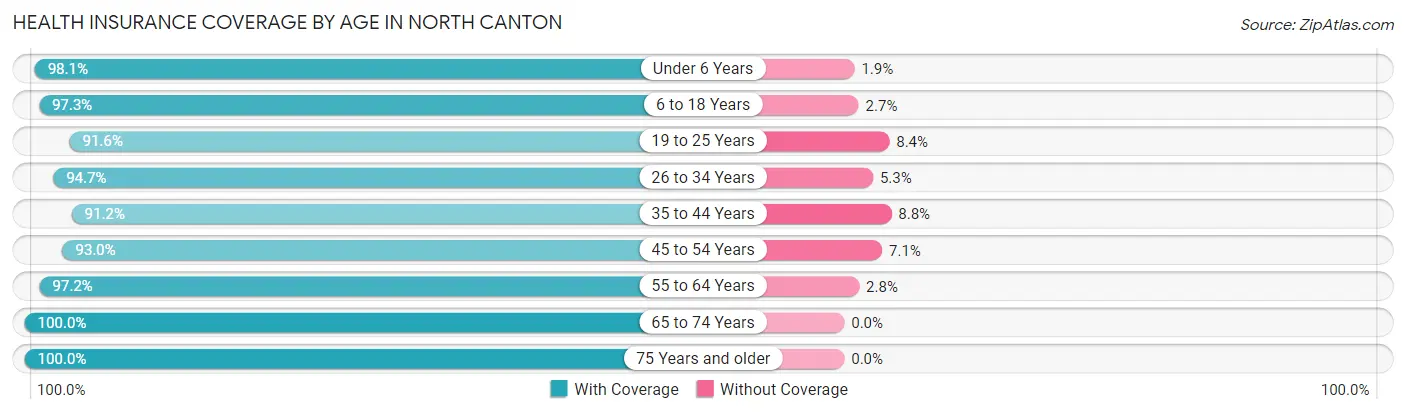
| Age Bracket | With Coverage | Without Coverage |
| Under 6 Years | 773 (98.1%) | 15 (1.9%) |
| 6 to 18 Years | 2,401 (97.3%) | 66 (2.7%) |
| 19 to 25 Years | 1,736 (91.6%) | 159 (8.4%) |
| 26 to 34 Years | 1,914 (94.7%) | 108 (5.3%) |
| 35 to 44 Years | 1,633 (91.2%) | 157 (8.8%) |
| 45 to 54 Years | 1,937 (92.9%) | 147 (7.0%) |
| 55 to 64 Years | 2,143 (97.2%) | 61 (2.8%) |
| 65 to 74 Years | 2,057 (100.0%) | 0 (0.0%) |
| 75 Years and older | 2,003 (100.0%) | 0 (0.0%) |
| Total | 16,597 (95.9%) | 713 (4.1%) |
Health Insurance Coverage by Citizenship Status in North Canton
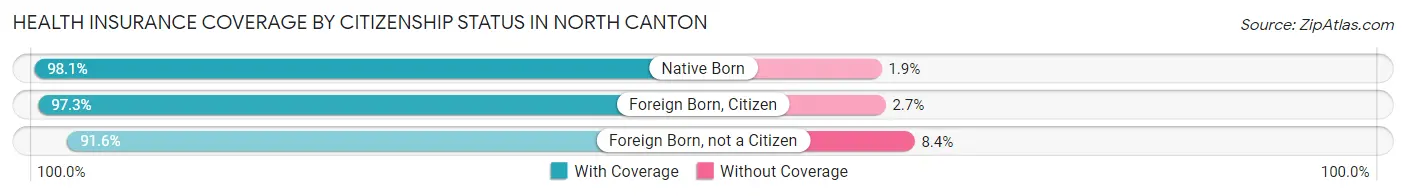
| Citizenship Status | With Coverage | Without Coverage |
| Native Born | 773 (98.1%) | 15 (1.9%) |
| Foreign Born, Citizen | 2,401 (97.3%) | 66 (2.7%) |
| Foreign Born, not a Citizen | 1,736 (91.6%) | 159 (8.4%) |
Health Insurance Coverage by Household Income in North Canton
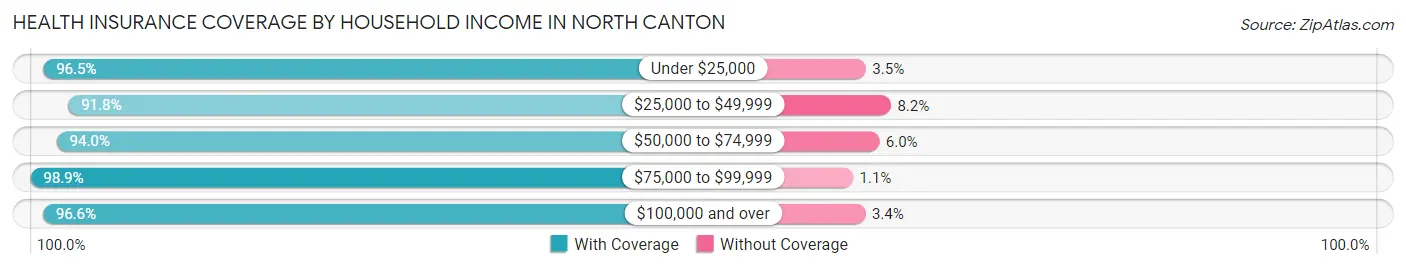
| Household Income | With Coverage | Without Coverage |
| Under $25,000 | 1,493 (96.5%) | 54 (3.5%) |
| $25,000 to $49,999 | 2,179 (91.8%) | 194 (8.2%) |
| $50,000 to $74,999 | 2,991 (94.0%) | 191 (6.0%) |
| $75,000 to $99,999 | 2,569 (98.9%) | 28 (1.1%) |
| $100,000 and over | 6,550 (96.6%) | 231 (3.4%) |
Public vs Private Health Insurance Coverage by Age in North Canton
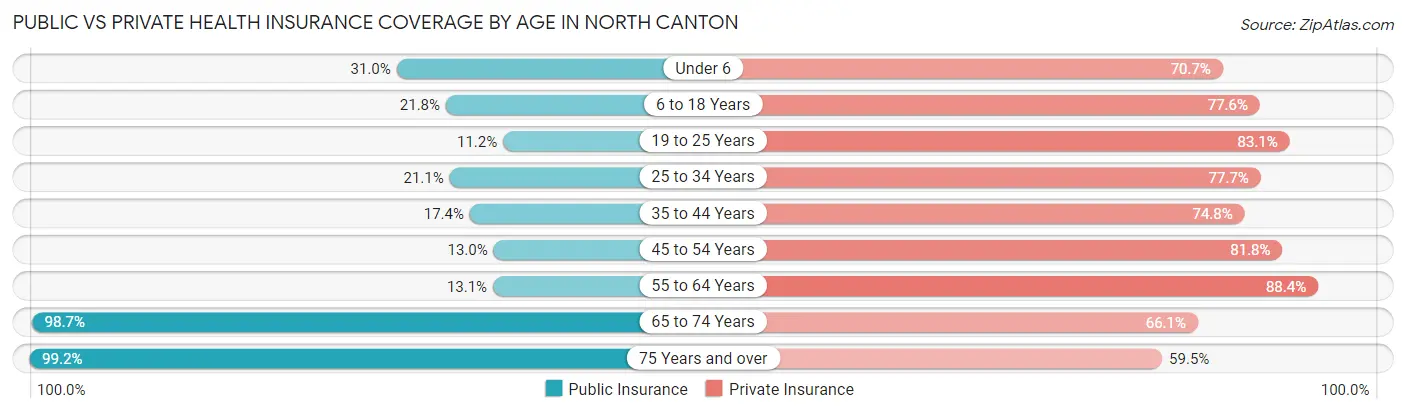
| Age Bracket | Public Insurance | Private Insurance |
| Under 6 | 244 (31.0%) | 557 (70.7%) |
| 6 to 18 Years | 538 (21.8%) | 1,914 (77.6%) |
| 19 to 25 Years | 212 (11.2%) | 1,575 (83.1%) |
| 25 to 34 Years | 427 (21.1%) | 1,572 (77.7%) |
| 35 to 44 Years | 311 (17.4%) | 1,338 (74.8%) |
| 45 to 54 Years | 270 (13.0%) | 1,704 (81.8%) |
| 55 to 64 Years | 288 (13.1%) | 1,948 (88.4%) |
| 65 to 74 Years | 2,030 (98.7%) | 1,359 (66.1%) |
| 75 Years and over | 1,986 (99.2%) | 1,191 (59.5%) |
| Total | 6,306 (36.4%) | 13,158 (76.0%) |
Disability Status by Sex by Age in North Canton
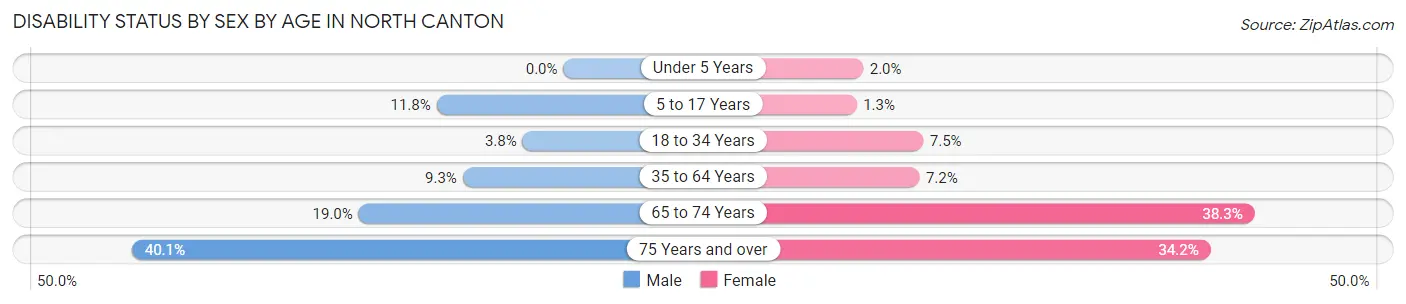
| Age Bracket | Male | Female |
| Under 5 Years | 0 (0.0%) | 8 (1.9%) |
| 5 to 17 Years | 148 (11.8%) | 14 (1.3%) |
| 18 to 34 Years | 74 (3.8%) | 168 (7.5%) |
| 35 to 64 Years | 269 (9.3%) | 229 (7.2%) |
| 65 to 74 Years | 178 (19.0%) | 429 (38.3%) |
| 75 Years and over | 306 (40.1%) | 424 (34.2%) |
Disability Class by Sex by Age in North Canton
Disability Class: Hearing Difficulty
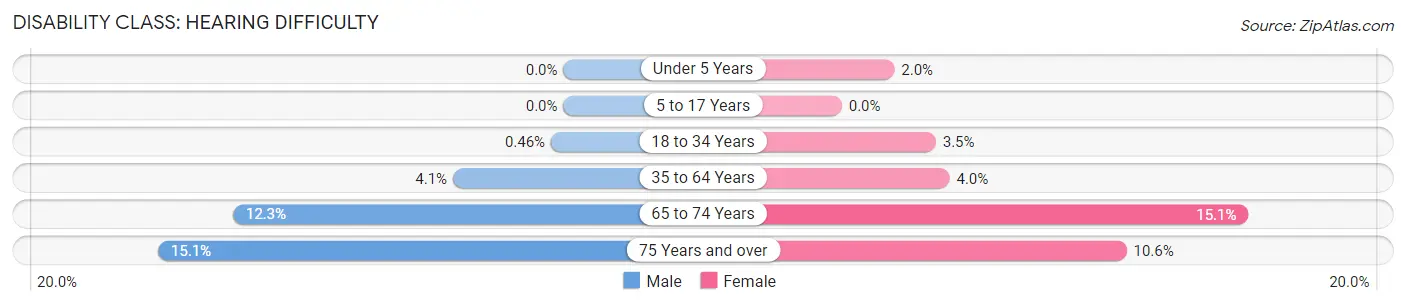
| Age Bracket | Male | Female |
| Under 5 Years | 0 (0.0%) | 8 (1.9%) |
| 5 to 17 Years | 0 (0.0%) | 0 (0.0%) |
| 18 to 34 Years | 9 (0.5%) | 78 (3.5%) |
| 35 to 64 Years | 118 (4.1%) | 128 (4.0%) |
| 65 to 74 Years | 115 (12.3%) | 169 (15.1%) |
| 75 Years and over | 115 (15.0%) | 131 (10.6%) |
Disability Class: Vision Difficulty
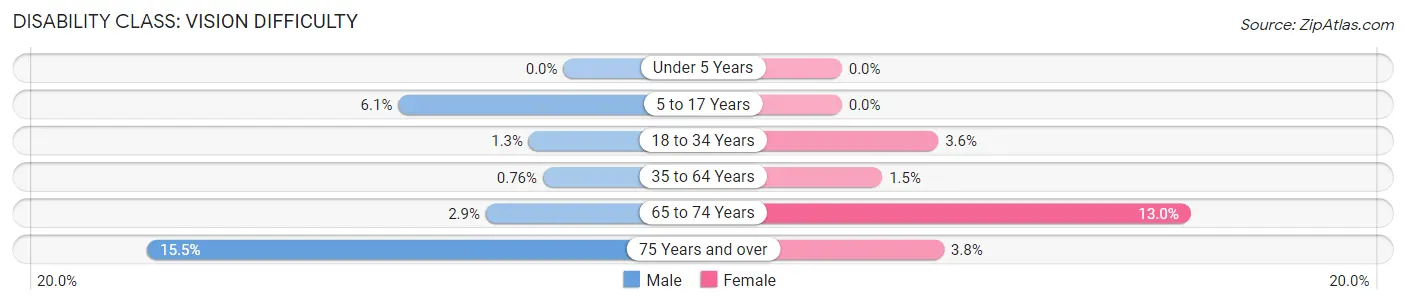
| Age Bracket | Male | Female |
| Under 5 Years | 0 (0.0%) | 0 (0.0%) |
| 5 to 17 Years | 77 (6.1%) | 0 (0.0%) |
| 18 to 34 Years | 25 (1.3%) | 80 (3.6%) |
| 35 to 64 Years | 22 (0.8%) | 48 (1.5%) |
| 65 to 74 Years | 27 (2.9%) | 145 (13.0%) |
| 75 Years and over | 118 (15.4%) | 47 (3.8%) |
Disability Class: Cognitive Difficulty
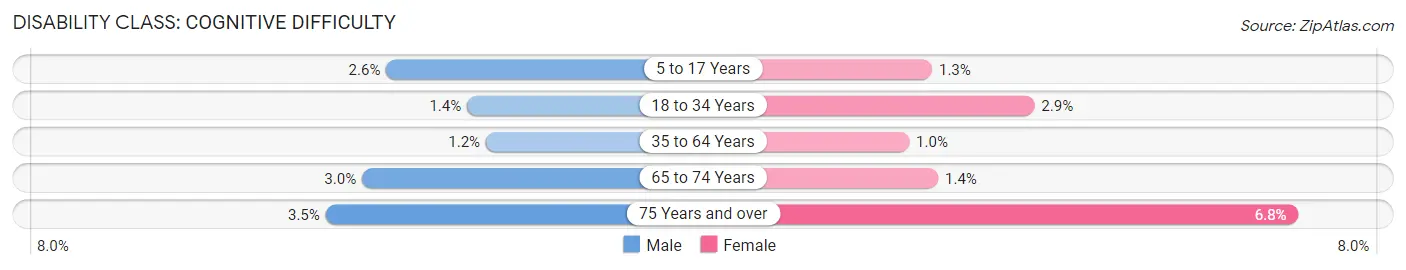
| Age Bracket | Male | Female |
| 5 to 17 Years | 33 (2.6%) | 14 (1.3%) |
| 18 to 34 Years | 28 (1.4%) | 64 (2.9%) |
| 35 to 64 Years | 33 (1.1%) | 32 (1.0%) |
| 65 to 74 Years | 28 (3.0%) | 16 (1.4%) |
| 75 Years and over | 27 (3.5%) | 84 (6.8%) |
Disability Class: Ambulatory Difficulty
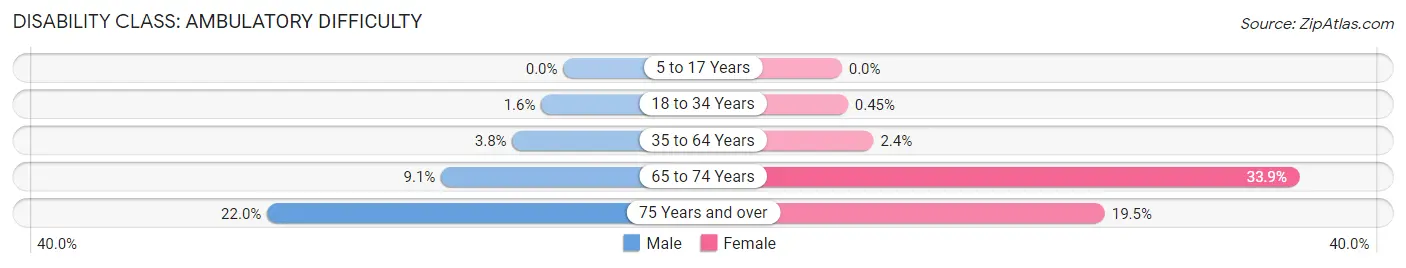
| Age Bracket | Male | Female |
| 5 to 17 Years | 0 (0.0%) | 0 (0.0%) |
| 18 to 34 Years | 32 (1.6%) | 10 (0.4%) |
| 35 to 64 Years | 109 (3.8%) | 75 (2.4%) |
| 65 to 74 Years | 85 (9.1%) | 380 (33.9%) |
| 75 Years and over | 168 (22.0%) | 242 (19.5%) |
Disability Class: Self-Care Difficulty
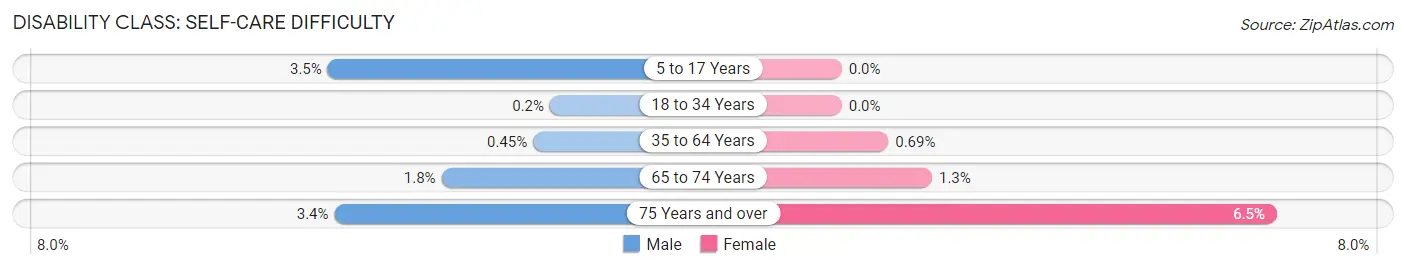
| Age Bracket | Male | Female |
| 5 to 17 Years | 44 (3.5%) | 0 (0.0%) |
| 18 to 34 Years | 4 (0.2%) | 0 (0.0%) |
| 35 to 64 Years | 13 (0.4%) | 22 (0.7%) |
| 65 to 74 Years | 17 (1.8%) | 15 (1.3%) |
| 75 Years and over | 26 (3.4%) | 80 (6.5%) |
Technology Access in North Canton
Computing Device Access in North Canton
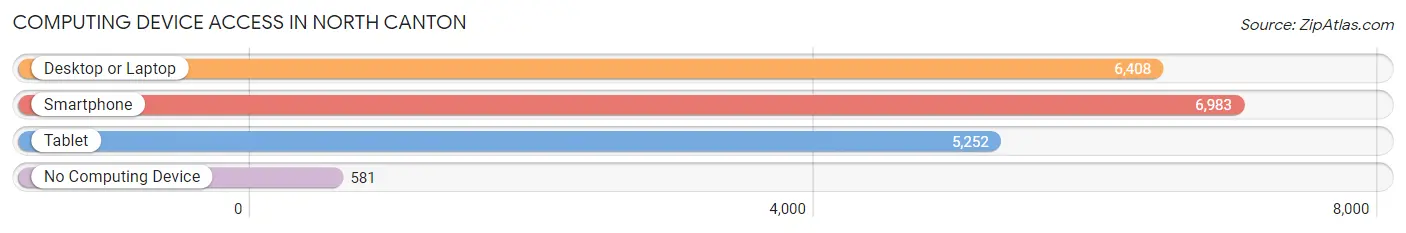
| Device Type | # Households | % Households |
| Desktop or Laptop | 6,408 | 79.6% |
| Smartphone | 6,983 | 86.8% |
| Tablet | 5,252 | 65.3% |
| No Computing Device | 581 | 7.2% |
| Total | 8,046 | 100.0% |
Internet Access in North Canton
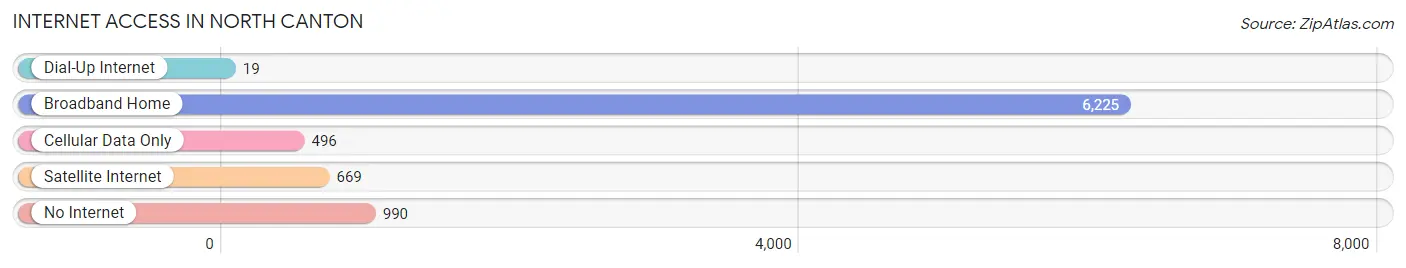
| Internet Type | # Households | % Households |
| Dial-Up Internet | 19 | 0.2% |
| Broadband Home | 6,225 | 77.4% |
| Cellular Data Only | 496 | 6.2% |
| Satellite Internet | 669 | 8.3% |
| No Internet | 990 | 12.3% |
| Total | 8,046 | 100.0% |
North Canton Summary
History
North Canton is a city located in Stark County, Ohio, United States. It is part of the Canton-Massillon Metropolitan Statistical Area. The city was founded in 1831 by John Saxton and was originally known as New Berlin. The city was renamed North Canton in 1891 when the village of Canton was incorporated.
North Canton was originally a farming community, but it began to grow in the late 19th century when the railroad was built through the area. The city was also home to the Hoover Company, which was founded in 1908 and became one of the largest vacuum cleaner manufacturers in the world. The company was later acquired by Maytag in 1989 and is now known as the Hoover Company.
Geography
North Canton is located in northeastern Ohio, approximately 25 miles south of Akron and 40 miles south of Cleveland. The city is situated in the western part of Stark County, near the Tuscarawas River. The city has a total area of 8.3 square miles, all of which is land.
The city is located in a hilly region of Ohio, with elevations ranging from 890 feet to 1,100 feet above sea level. The city is located in the humid continental climate zone, with hot summers and cold winters. The average annual temperature is 50 degrees Fahrenheit, with an average high of 73 degrees in the summer and an average low of 27 degrees in the winter.
Economy
North Canton is home to a variety of businesses and industries. The city is home to the headquarters of the Hoover Company, which is one of the largest vacuum cleaner manufacturers in the world. The city is also home to several other manufacturing companies, including Diebold, Inc., which is a global leader in security and financial self-service solutions.
The city is also home to several retail stores, restaurants, and other businesses. The city is home to the North Canton Medical Center, which is a full-service hospital. The city is also home to Walsh University, which is a private, Catholic university.
Demographics
As of the 2010 census, the city had a population of 17,488. The racial makeup of the city was 94.2% White, 1.7% African American, 0.3% Native American, 1.2% Asian, 0.1% Pacific Islander, 0.7% from other races, and 1.9% from two or more races. Hispanic or Latino of any race were 2.2% of the population.
The median household income in the city was $50,945, and the median family income was $62,917. The per capita income for the city was $25,945. About 5.2% of families and 7.2% of the population were below the poverty line, including 9.2% of those under age 18 and 5.2% of those age 65 or over.
Common Questions
What is Per Capita Income in North Canton?
Per Capita income in North Canton is $45,655.
What is the Median Family Income in North Canton?
Median Family Income in North Canton is $95,000.
What is the Median Household income in North Canton?
Median Household Income in North Canton is $69,132.
What is Income or Wage Gap in North Canton?
Income or Wage Gap in North Canton is 32.3%.
Women in North Canton earn 67.7 cents for every dollar earned by a man.
What is Family Income Deficit in North Canton?
Family Income Deficit in North Canton is $10,918.
Families that are below poverty line in North Canton earn $10,918 less on average than the poverty threshold level.
What is Inequality or Gini Index in North Canton?
Inequality or Gini Index in North Canton is 0.47.
What is the Total Population of North Canton?
Total Population of North Canton is 17,773.
What is the Total Male Population of North Canton?
Total Male Population of North Canton is 8,248.
What is the Total Female Population of North Canton?
Total Female Population of North Canton is 9,525.
What is the Ratio of Males per 100 Females in North Canton?
There are 86.59 Males per 100 Females in North Canton.
What is the Ratio of Females per 100 Males in North Canton?
There are 115.48 Females per 100 Males in North Canton.
What is the Median Population Age in North Canton?
Median Population Age in North Canton is 44.4 Years.
What is the Average Family Size in North Canton
Average Family Size in North Canton is 2.8 People.
What is the Average Household Size in North Canton
Average Household Size in North Canton is 2.0 People.
How Large is the Labor Force in North Canton?
There are 9,569 People in the Labor Forcein in North Canton.
What is the Percentage of People in the Labor Force in North Canton?
63.8% of People are in the Labor Force in North Canton.
What is the Unemployment Rate in North Canton?
Unemployment Rate in North Canton is 2.5%.