New Philadelphia, OH Map & Demographics
New Philadelphia Map
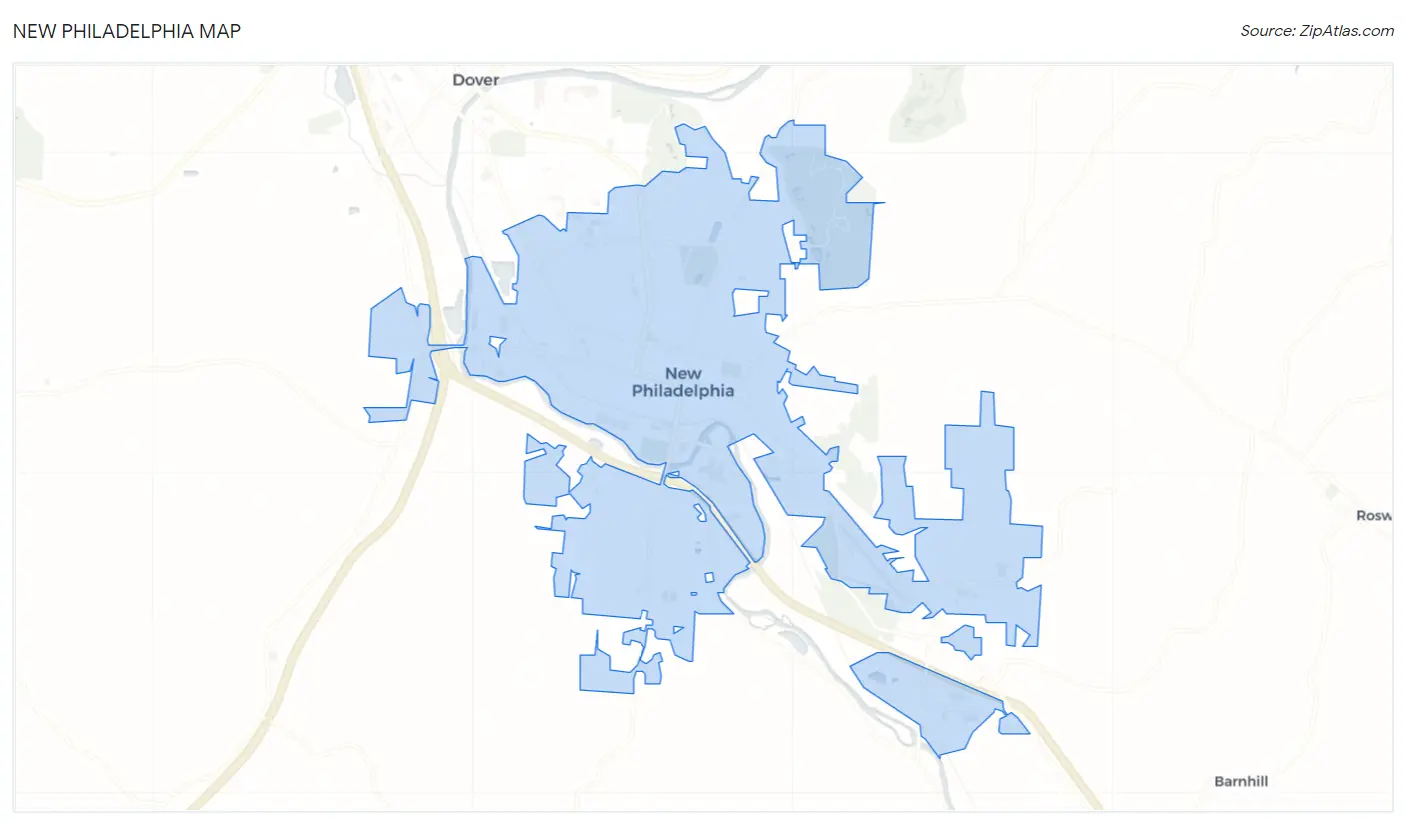
New Philadelphia Overview
$32,665
PER CAPITA INCOME
$67,051
AVG FAMILY INCOME
$55,590
AVG HOUSEHOLD INCOME
25.7%
WAGE / INCOME GAP [ % ]
74.3¢/ $1
WAGE / INCOME GAP [ $ ]
$13,722
FAMILY INCOME DEFICIT
0.43
INEQUALITY / GINI INDEX
17,602
TOTAL POPULATION
9,384
MALE POPULATION
8,218
FEMALE POPULATION
114.19
MALES / 100 FEMALES
87.57
FEMALES / 100 MALES
42.8
MEDIAN AGE
2.6
AVG FAMILY SIZE
2.1
AVG HOUSEHOLD SIZE
9,038
LABOR FORCE [ PEOPLE ]
62.3%
PERCENT IN LABOR FORCE
3.1%
UNEMPLOYMENT RATE
New Philadelphia Zip Codes
Income in New Philadelphia
Income Overview in New Philadelphia
Per Capita Income in New Philadelphia is $32,665, while median incomes of families and households are $67,051 and $55,590 respectively.
| Characteristic | Number | Measure |
| Per Capita Income | 17,602 | $32,665 |
| Median Family Income | 4,922 | $67,051 |
| Mean Family Income | 4,922 | $82,445 |
| Median Household Income | 8,111 | $55,590 |
| Mean Household Income | 8,111 | $69,486 |
| Income Deficit | 4,922 | $13,722 |
| Wage / Income Gap (%) | 17,602 | 25.69% |
| Wage / Income Gap ($) | 17,602 | 74.31¢ per $1 |
| Gini / Inequality Index | 17,602 | 0.43 |
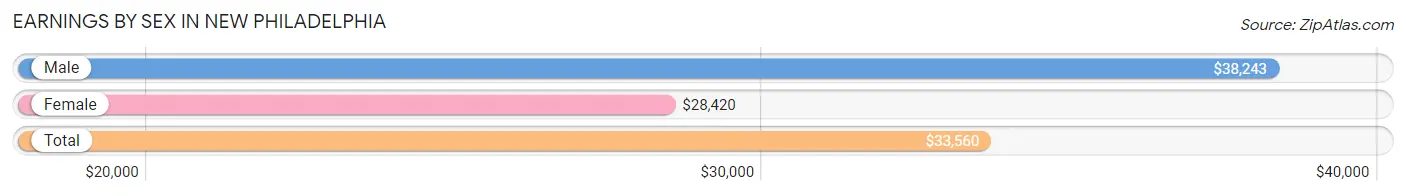
Earnings by Sex in New Philadelphia
Average Earnings in New Philadelphia are $33,560, $38,243 for men and $28,420 for women, a difference of 25.7%.
| Sex | Number | Average Earnings |
| Male | 5,612 (58.8%) | $38,243 |
| Female | 3,928 (41.2%) | $28,420 |
| Total | 9,540 (100.0%) | $33,560 |
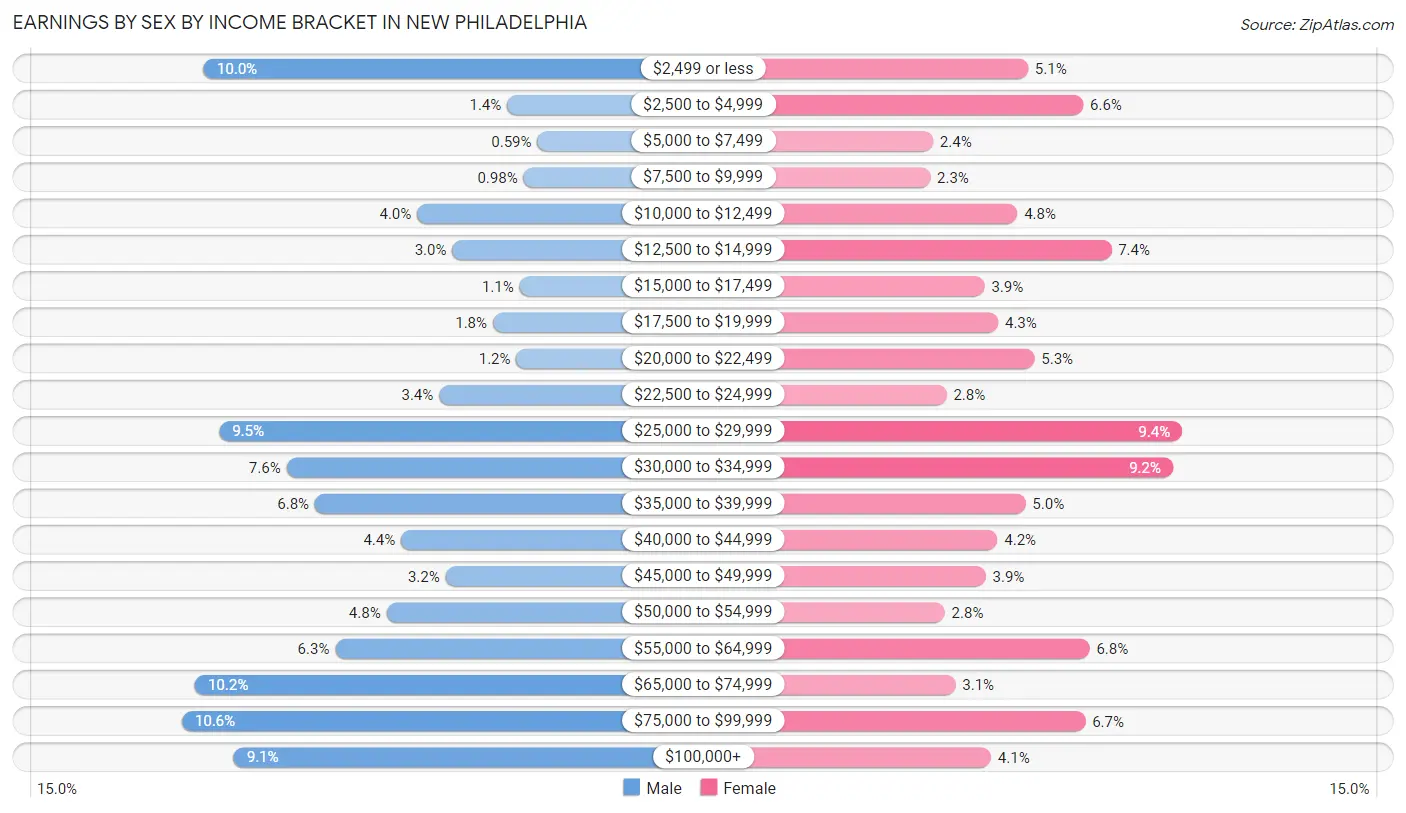
Earnings by Sex by Income Bracket in New Philadelphia
The most common earnings brackets in New Philadelphia are $75,000 to $99,999 for men (594 | 10.6%) and $25,000 to $29,999 for women (370 | 9.4%).
| Income | Male | Female |
| $2,499 or less | 559 (10.0%) | 200 (5.1%) |
| $2,500 to $4,999 | 81 (1.4%) | 261 (6.6%) |
| $5,000 to $7,499 | 33 (0.6%) | 95 (2.4%) |
| $7,500 to $9,999 | 55 (1.0%) | 92 (2.3%) |
| $10,000 to $12,499 | 223 (4.0%) | 188 (4.8%) |
| $12,500 to $14,999 | 167 (3.0%) | 292 (7.4%) |
| $15,000 to $17,499 | 61 (1.1%) | 152 (3.9%) |
| $17,500 to $19,999 | 103 (1.8%) | 167 (4.3%) |
| $20,000 to $22,499 | 66 (1.2%) | 207 (5.3%) |
| $22,500 to $24,999 | 188 (3.4%) | 110 (2.8%) |
| $25,000 to $29,999 | 535 (9.5%) | 370 (9.4%) |
| $30,000 to $34,999 | 429 (7.6%) | 360 (9.2%) |
| $35,000 to $39,999 | 384 (6.8%) | 197 (5.0%) |
| $40,000 to $44,999 | 248 (4.4%) | 166 (4.2%) |
| $45,000 to $49,999 | 178 (3.2%) | 153 (3.9%) |
| $50,000 to $54,999 | 271 (4.8%) | 108 (2.8%) |
| $55,000 to $64,999 | 352 (6.3%) | 268 (6.8%) |
| $65,000 to $74,999 | 573 (10.2%) | 120 (3.0%) |
| $75,000 to $99,999 | 594 (10.6%) | 263 (6.7%) |
| $100,000+ | 512 (9.1%) | 159 (4.1%) |
| Total | 5,612 (100.0%) | 3,928 (100.0%) |
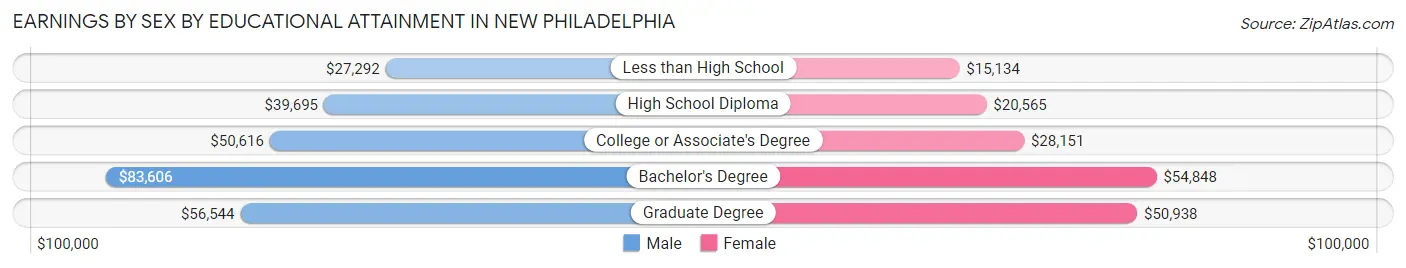
Earnings by Sex by Educational Attainment in New Philadelphia
Average earnings in New Philadelphia are $47,931 for men and $31,612 for women, a difference of 34.1%. Men with an educational attainment of bachelor's degree enjoy the highest average annual earnings of $83,606, while those with less than high school education earn the least with $27,292. Women with an educational attainment of bachelor's degree earn the most with the average annual earnings of $54,848, while those with less than high school education have the smallest earnings of $15,134.
| Educational Attainment | Male Income | Female Income |
| Less than High School | $27,292 | $15,134 |
| High School Diploma | $39,695 | $20,565 |
| College or Associate's Degree | $50,616 | $28,151 |
| Bachelor's Degree | $83,606 | $54,848 |
| Graduate Degree | $56,544 | $50,938 |
| Total | $47,931 | $31,612 |
Family Income in New Philadelphia
Family Income Brackets in New Philadelphia
According to the New Philadelphia family income data, there are 1,186 families falling into the $50,000 to $74,999 income range, which is the most common income bracket and makes up 24.1% of all families. Conversely, the $15,000 to $24,999 income bracket is the least frequent group with only 153 families (3.1%) belonging to this category.
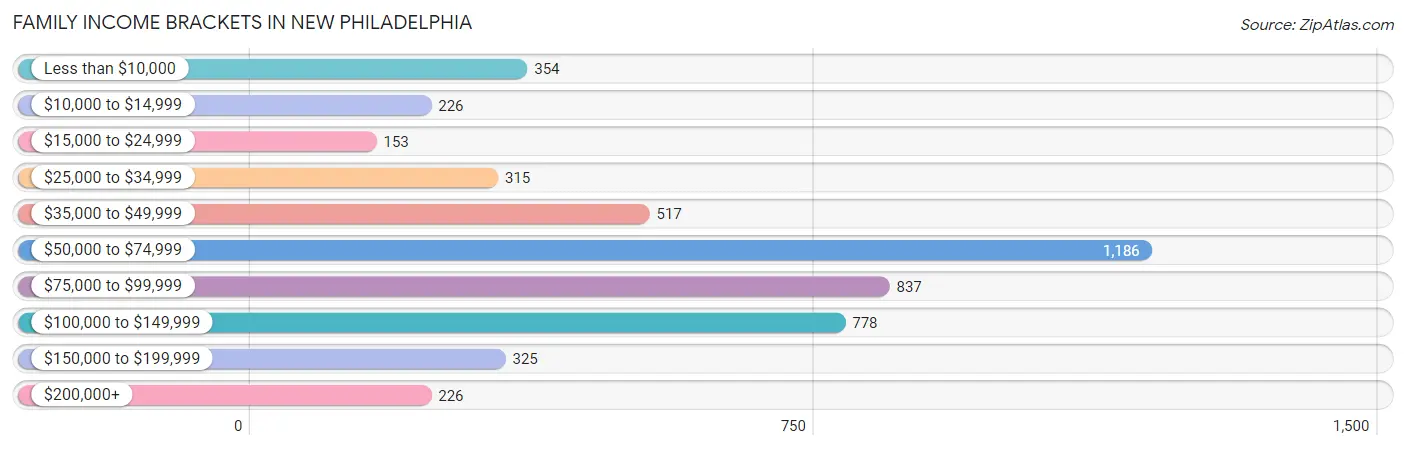
| Income Bracket | # Families | % Families |
| Less than $10,000 | 354 | 7.2% |
| $10,000 to $14,999 | 226 | 4.6% |
| $15,000 to $24,999 | 153 | 3.1% |
| $25,000 to $34,999 | 315 | 6.4% |
| $35,000 to $49,999 | 517 | 10.5% |
| $50,000 to $74,999 | 1,186 | 24.1% |
| $75,000 to $99,999 | 837 | 17.0% |
| $100,000 to $149,999 | 778 | 15.8% |
| $150,000 to $199,999 | 325 | 6.6% |
| $200,000+ | 226 | 4.6% |
Family Income by Famaliy Size in New Philadelphia
5-person families (204 | 4.1%) account for the highest median family income in New Philadelphia with $103,500 per family, while 2-person families (3,195 | 64.9%) have the highest median income of $31,696 per family member.
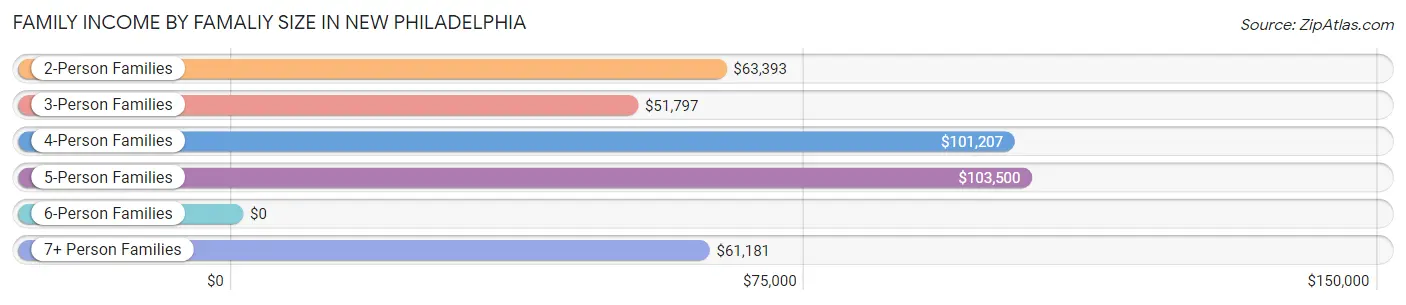
| Income Bracket | # Families | Median Income |
| 2-Person Families | 3,195 (64.9%) | $63,393 |
| 3-Person Families | 893 (18.1%) | $51,797 |
| 4-Person Families | 584 (11.9%) | $101,207 |
| 5-Person Families | 204 (4.1%) | $103,500 |
| 6-Person Families | 9 (0.2%) | $0 |
| 7+ Person Families | 37 (0.7%) | $61,181 |
| Total | 4,922 (100.0%) | $67,051 |
Family Income by Number of Earners in New Philadelphia
The median family income in New Philadelphia is $67,051, with families comprising 3+ earners (357) having the highest median family income of $115,096, while families with no earners (913) have the lowest median family income of $49,680, accounting for 7.2% and 18.5% of families, respectively.
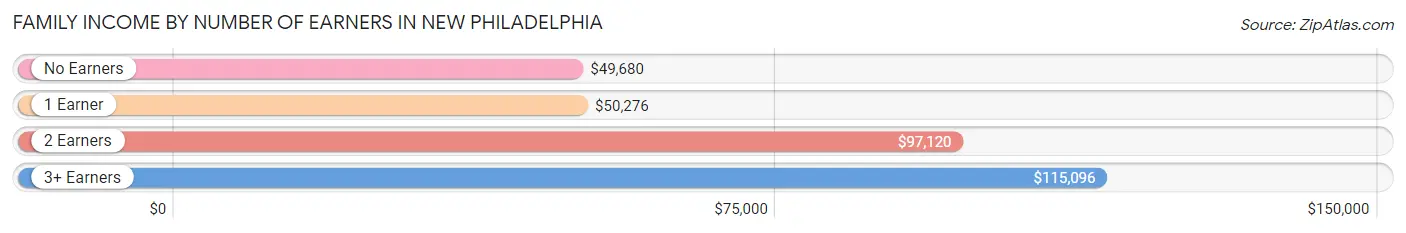
| Number of Earners | # Families | Median Income |
| No Earners | 913 (18.5%) | $49,680 |
| 1 Earner | 2,055 (41.7%) | $50,276 |
| 2 Earners | 1,597 (32.5%) | $97,120 |
| 3+ Earners | 357 (7.2%) | $115,096 |
| Total | 4,922 (100.0%) | $67,051 |
Household Income in New Philadelphia
Household Income Brackets in New Philadelphia
With 1,638 households falling in the category, the $50,000 to $74,999 income range is the most frequent in New Philadelphia, accounting for 20.2% of all households. In contrast, only 251 households (3.1%) fall into the $200,000+ income bracket, making it the least populous group.
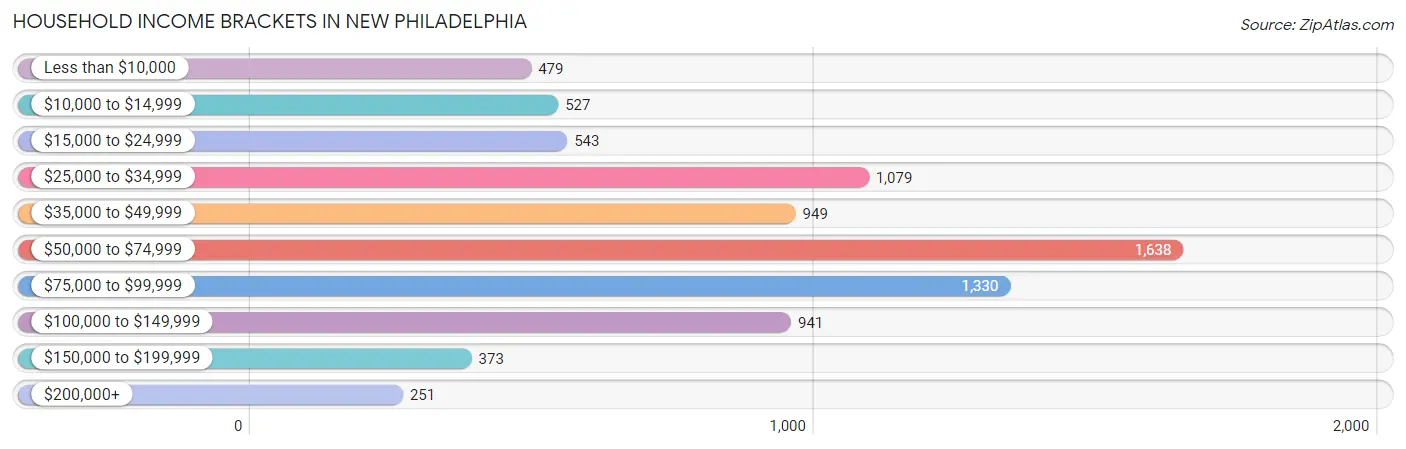
| Income Bracket | # Households | % Households |
| Less than $10,000 | 479 | 5.9% |
| $10,000 to $14,999 | 527 | 6.5% |
| $15,000 to $24,999 | 543 | 6.7% |
| $25,000 to $34,999 | 1,079 | 13.3% |
| $35,000 to $49,999 | 949 | 11.7% |
| $50,000 to $74,999 | 1,638 | 20.2% |
| $75,000 to $99,999 | 1,330 | 16.4% |
| $100,000 to $149,999 | 941 | 11.6% |
| $150,000 to $199,999 | 373 | 4.6% |
| $200,000+ | 251 | 3.1% |
Household Income by Householder Age in New Philadelphia
The median household income in New Philadelphia is $55,590, with the highest median household income of $66,531 found in the 25 to 44 years age bracket for the primary householder. A total of 2,455 households (30.3%) fall into this category. Meanwhile, the 15 to 24 years age bracket for the primary householder has the lowest median household income of $29,622, with 438 households (5.4%) in this group.
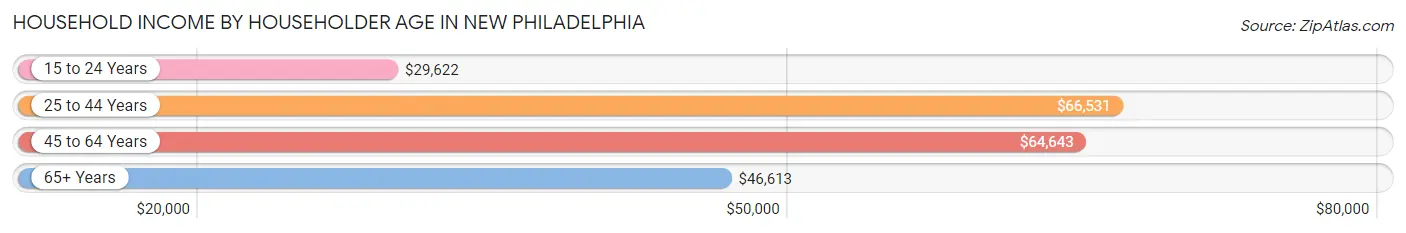
| Income Bracket | # Households | Median Income |
| 15 to 24 Years | 438 (5.4%) | $29,622 |
| 25 to 44 Years | 2,455 (30.3%) | $66,531 |
| 45 to 64 Years | 2,946 (36.3%) | $64,643 |
| 65+ Years | 2,272 (28.0%) | $46,613 |
| Total | 8,111 (100.0%) | $55,590 |
Poverty in New Philadelphia
Income Below Poverty by Sex and Age in New Philadelphia
With 13.5% poverty level for males and 16.9% for females among the residents of New Philadelphia, under 5 year old males and under 5 year old females are the most vulnerable to poverty, with 267 males (47.4%) and 187 females (47.0%) in their respective age groups living below the poverty level.
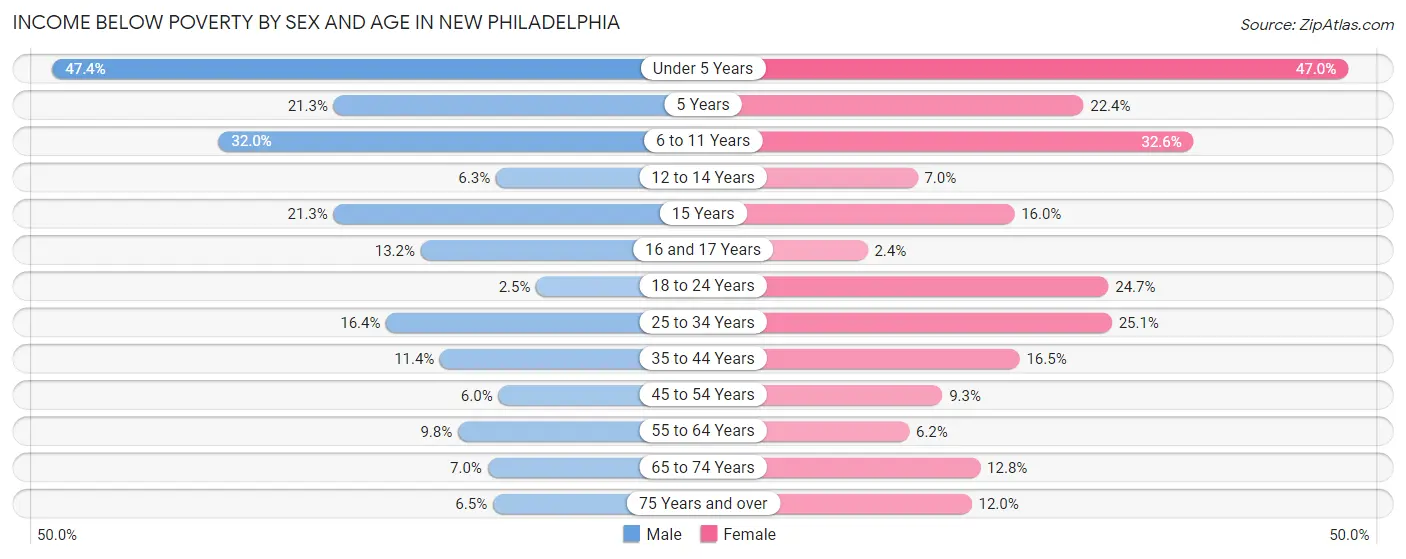
| Age Bracket | Male | Female |
| Under 5 Years | 267 (47.4%) | 187 (47.0%) |
| 5 Years | 26 (21.3%) | 13 (22.4%) |
| 6 to 11 Years | 217 (32.0%) | 172 (32.6%) |
| 12 to 14 Years | 10 (6.2%) | 24 (7.0%) |
| 15 Years | 29 (21.3%) | 4 (16.0%) |
| 16 and 17 Years | 34 (13.2%) | 2 (2.4%) |
| 18 to 24 Years | 22 (2.5%) | 138 (24.7%) |
| 25 to 34 Years | 176 (16.4%) | 265 (25.1%) |
| 35 to 44 Years | 152 (11.4%) | 157 (16.5%) |
| 45 to 54 Years | 63 (6.0%) | 106 (9.3%) |
| 55 to 64 Years | 138 (9.8%) | 68 (6.2%) |
| 65 to 74 Years | 64 (7.0%) | 124 (12.8%) |
| 75 Years and over | 41 (6.5%) | 107 (12.0%) |
| Total | 1,239 (13.5%) | 1,367 (16.9%) |
Income Above Poverty by Sex and Age in New Philadelphia
According to the poverty statistics in New Philadelphia, males aged 18 to 24 years and females aged 16 and 17 years are the age groups that are most secure financially, with 97.5% of males and 97.6% of females in these age groups living above the poverty line.
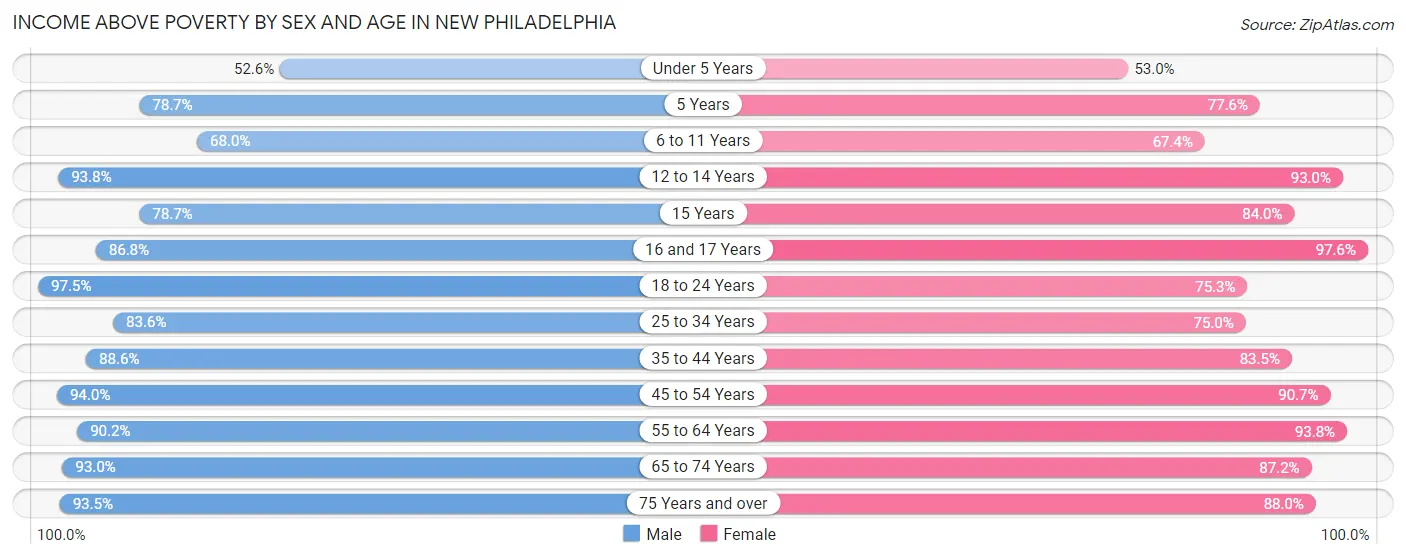
| Age Bracket | Male | Female |
| Under 5 Years | 296 (52.6%) | 211 (53.0%) |
| 5 Years | 96 (78.7%) | 45 (77.6%) |
| 6 to 11 Years | 461 (68.0%) | 355 (67.4%) |
| 12 to 14 Years | 150 (93.8%) | 318 (93.0%) |
| 15 Years | 107 (78.7%) | 21 (84.0%) |
| 16 and 17 Years | 223 (86.8%) | 82 (97.6%) |
| 18 to 24 Years | 853 (97.5%) | 420 (75.3%) |
| 25 to 34 Years | 895 (83.6%) | 793 (75.0%) |
| 35 to 44 Years | 1,178 (88.6%) | 795 (83.5%) |
| 45 to 54 Years | 983 (94.0%) | 1,031 (90.7%) |
| 55 to 64 Years | 1,274 (90.2%) | 1,022 (93.8%) |
| 65 to 74 Years | 848 (93.0%) | 842 (87.2%) |
| 75 Years and over | 587 (93.5%) | 782 (88.0%) |
| Total | 7,951 (86.5%) | 6,717 (83.1%) |
Income Below Poverty Among Married-Couple Families in New Philadelphia
The poverty statistics for married-couple families in New Philadelphia show that 3.5% or 118 of the total 3,323 families live below the poverty line. Families with no children have the highest poverty rate of 4.8%, comprising of 118 families. On the other hand, families with 1 or 2 children have the lowest poverty rate of 0.0%, which includes 0 families.
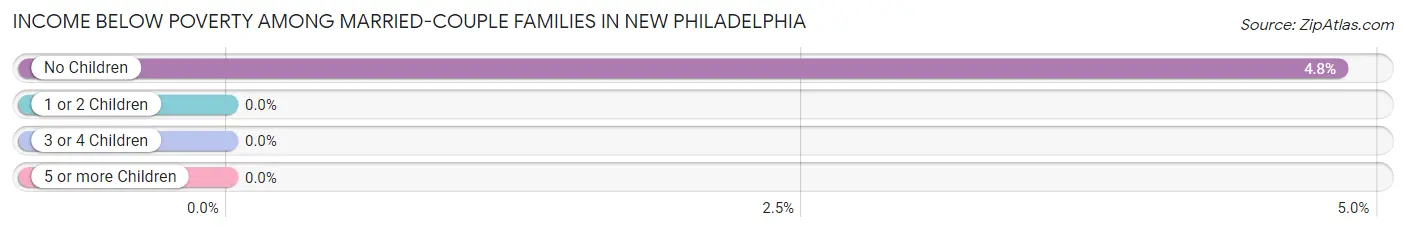
| Children | Above Poverty | Below Poverty |
| No Children | 2,325 (95.2%) | 118 (4.8%) |
| 1 or 2 Children | 761 (100.0%) | 0 (0.0%) |
| 3 or 4 Children | 91 (100.0%) | 0 (0.0%) |
| 5 or more Children | 28 (100.0%) | 0 (0.0%) |
| Total | 3,205 (96.5%) | 118 (3.5%) |
Income Below Poverty Among Single-Parent Households in New Philadelphia
According to the poverty data in New Philadelphia, 29.5% or 240 single-father households and 32.6% or 256 single-mother households are living below the poverty line. Among single-father households, those with 1 or 2 children have the highest poverty rate, with 225 households (54.1%) experiencing poverty. Likewise, among single-mother households, those with 3 or 4 children have the highest poverty rate, with 50 households (100.0%) falling below the poverty line.
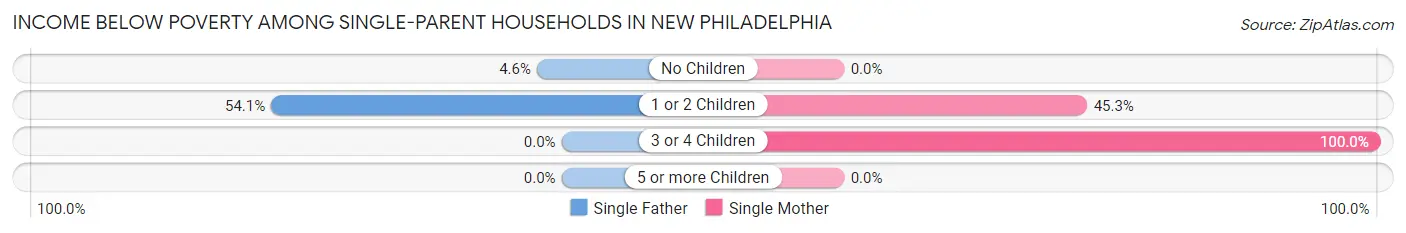
| Children | Single Father | Single Mother |
| No Children | 15 (4.6%) | 0 (0.0%) |
| 1 or 2 Children | 225 (54.1%) | 206 (45.3%) |
| 3 or 4 Children | 0 (0.0%) | 50 (100.0%) |
| 5 or more Children | 0 (0.0%) | 0 (0.0%) |
| Total | 240 (29.5%) | 256 (32.6%) |
Income Below Poverty Among Married-Couple vs Single-Parent Households in New Philadelphia
The poverty data for New Philadelphia shows that 118 of the married-couple family households (3.5%) and 496 of the single-parent households (31.0%) are living below the poverty level. Within the married-couple family households, those with no children have the highest poverty rate, with 118 households (4.8%) falling below the poverty line. Among the single-parent households, those with 1 or 2 children have the highest poverty rate, with 431 household (49.5%) living below poverty.
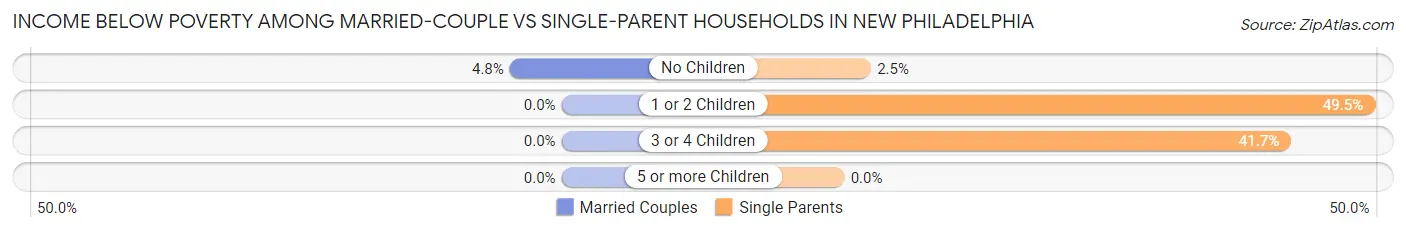
| Children | Married-Couple Families | Single-Parent Households |
| No Children | 118 (4.8%) | 15 (2.5%) |
| 1 or 2 Children | 0 (0.0%) | 431 (49.5%) |
| 3 or 4 Children | 0 (0.0%) | 50 (41.7%) |
| 5 or more Children | 0 (0.0%) | 0 (0.0%) |
| Total | 118 (3.5%) | 496 (31.0%) |
Race in New Philadelphia
The most populous races in New Philadelphia are White / Caucasian (16,566 | 94.1%), Hispanic or Latino (1,448 | 8.2%), and Two or more Races (409 | 2.3%).
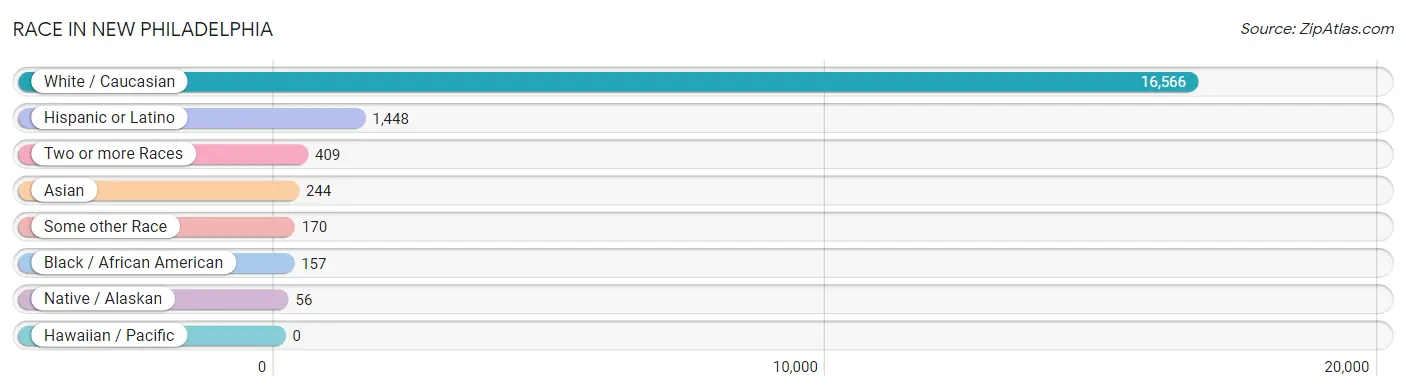
| Race | # Population | % Population |
| Asian | 244 | 1.4% |
| Black / African American | 157 | 0.9% |
| Hawaiian / Pacific | 0 | 0.0% |
| Hispanic or Latino | 1,448 | 8.2% |
| Native / Alaskan | 56 | 0.3% |
| White / Caucasian | 16,566 | 94.1% |
| Two or more Races | 409 | 2.3% |
| Some other Race | 170 | 1.0% |
| Total | 17,602 | 100.0% |
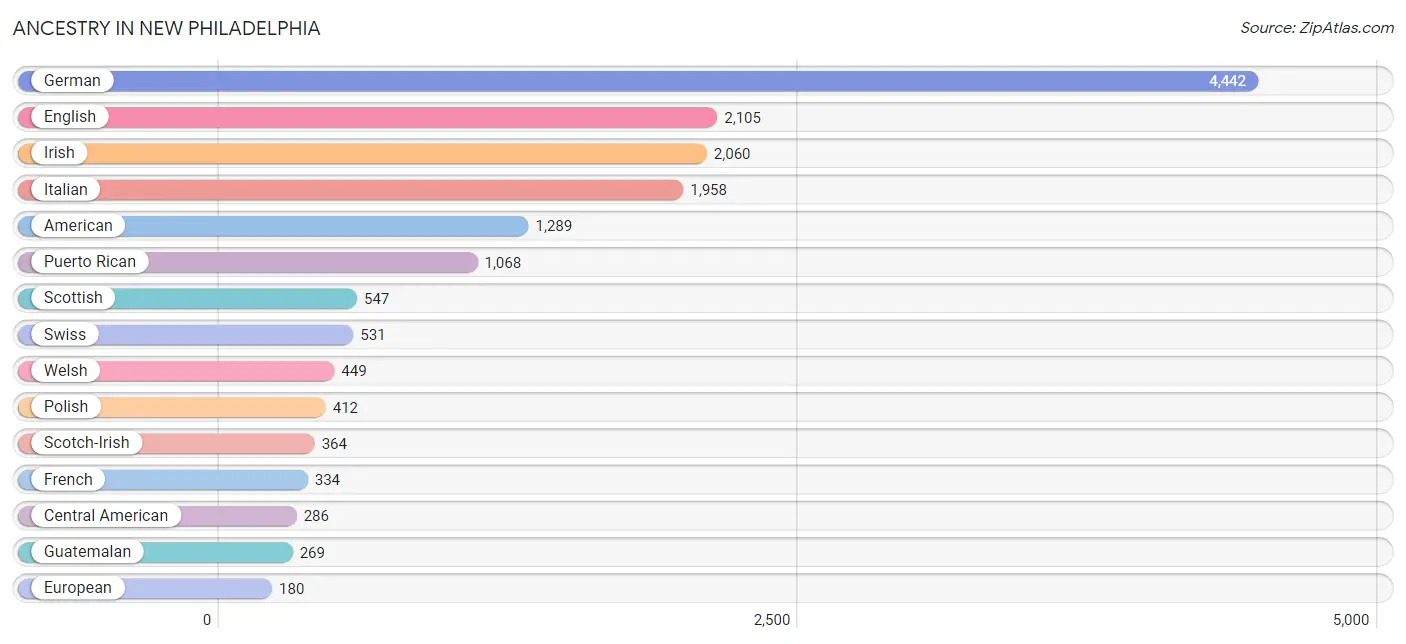
Ancestry in New Philadelphia
The most populous ancestries reported in New Philadelphia are German (4,442 | 25.2%), English (2,105 | 12.0%), Irish (2,060 | 11.7%), Italian (1,958 | 11.1%), and American (1,289 | 7.3%), together accounting for 67.3% of all New Philadelphia residents.
| Ancestry | # Population | % Population |
| American | 1,289 | 7.3% |
| Arab | 99 | 0.6% |
| Austrian | 91 | 0.5% |
| Blackfeet | 30 | 0.2% |
| British | 55 | 0.3% |
| Central American | 286 | 1.6% |
| Cherokee | 49 | 0.3% |
| Croatian | 22 | 0.1% |
| Czech | 115 | 0.6% |
| Czechoslovakian | 11 | 0.1% |
| Dutch | 108 | 0.6% |
| Eastern European | 12 | 0.1% |
| English | 2,105 | 12.0% |
| European | 180 | 1.0% |
| French | 334 | 1.9% |
| German | 4,442 | 25.2% |
| Greek | 35 | 0.2% |
| Guatemalan | 269 | 1.5% |
| Hungarian | 67 | 0.4% |
| Indian (Asian) | 57 | 0.3% |
| Irish | 2,060 | 11.7% |
| Italian | 1,958 | 11.1% |
| Korean | 71 | 0.4% |
| Mexican | 54 | 0.3% |
| Moroccan | 99 | 0.6% |
| Native Hawaiian | 17 | 0.1% |
| Panamanian | 17 | 0.1% |
| Pennsylvania German | 14 | 0.1% |
| Polish | 412 | 2.3% |
| Portuguese | 39 | 0.2% |
| Puerto Rican | 1,068 | 6.1% |
| Romanian | 39 | 0.2% |
| Russian | 165 | 0.9% |
| Scandinavian | 1 | 0.0% |
| Scotch-Irish | 364 | 2.1% |
| Scottish | 547 | 3.1% |
| Serbian | 45 | 0.3% |
| Sierra Leonean | 14 | 0.1% |
| Slavic | 15 | 0.1% |
| Slovak | 86 | 0.5% |
| Slovene | 4 | 0.0% |
| Spanish | 4 | 0.0% |
| Sri Lankan | 13 | 0.1% |
| Subsaharan African | 14 | 0.1% |
| Swedish | 41 | 0.2% |
| Swiss | 531 | 3.0% |
| Thai | 130 | 0.7% |
| Ukrainian | 135 | 0.8% |
| Welsh | 449 | 2.5% |
| Yugoslavian | 9 | 0.1% | View All 50 Rows |
Immigrants in New Philadelphia
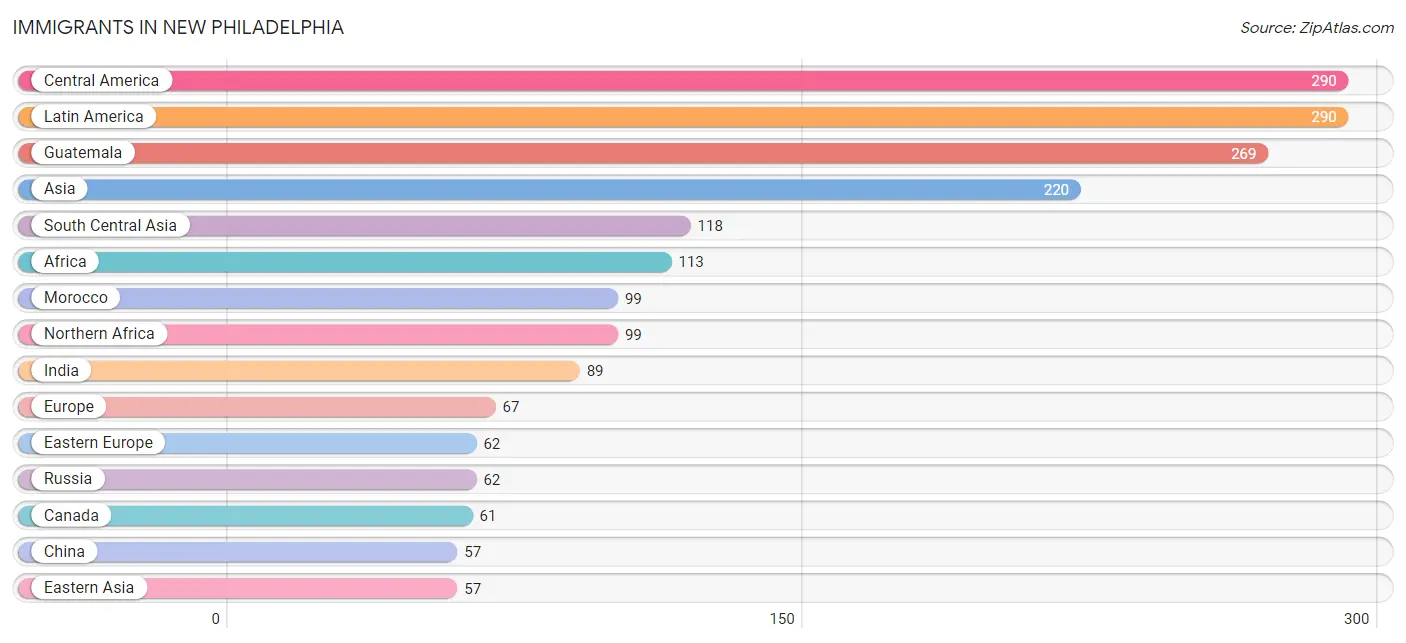
The most numerous immigrant groups reported in New Philadelphia came from Central America (290 | 1.7%), Latin America (290 | 1.7%), Guatemala (269 | 1.5%), Asia (220 | 1.3%), and South Central Asia (118 | 0.7%), together accounting for 6.8% of all New Philadelphia residents.
| Immigration Origin | # Population | % Population |
| Africa | 113 | 0.6% |
| Asia | 220 | 1.3% |
| Canada | 61 | 0.4% |
| Central America | 290 | 1.7% |
| China | 57 | 0.3% |
| Eastern Asia | 57 | 0.3% |
| Eastern Europe | 62 | 0.4% |
| Europe | 67 | 0.4% |
| Germany | 5 | 0.0% |
| Guatemala | 269 | 1.5% |
| India | 89 | 0.5% |
| Latin America | 290 | 1.7% |
| Mexico | 4 | 0.0% |
| Morocco | 99 | 0.6% |
| Nepal | 29 | 0.2% |
| Northern Africa | 99 | 0.6% |
| Panama | 17 | 0.1% |
| Philippines | 45 | 0.3% |
| Russia | 62 | 0.4% |
| Sierra Leone | 14 | 0.1% |
| South Central Asia | 118 | 0.7% |
| South Eastern Asia | 45 | 0.3% |
| Western Africa | 14 | 0.1% |
| Western Europe | 5 | 0.0% | View All 24 Rows |
Sex and Age in New Philadelphia
Sex and Age in New Philadelphia
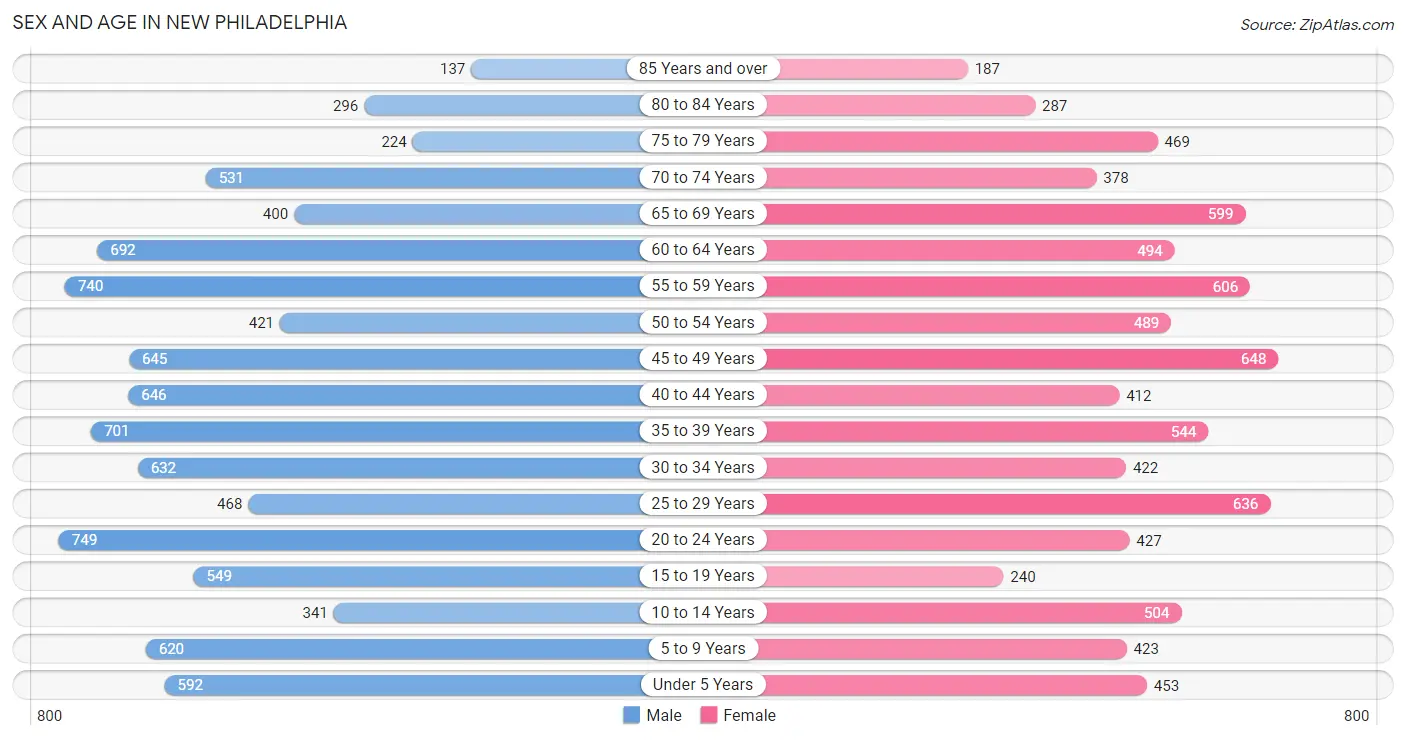
The most populous age groups in New Philadelphia are 20 to 24 Years (749 | 8.0%) for men and 45 to 49 Years (648 | 7.9%) for women.
| Age Bracket | Male | Female |
| Under 5 Years | 592 (6.3%) | 453 (5.5%) |
| 5 to 9 Years | 620 (6.6%) | 423 (5.1%) |
| 10 to 14 Years | 341 (3.6%) | 504 (6.1%) |
| 15 to 19 Years | 549 (5.9%) | 240 (2.9%) |
| 20 to 24 Years | 749 (8.0%) | 427 (5.2%) |
| 25 to 29 Years | 468 (5.0%) | 636 (7.7%) |
| 30 to 34 Years | 632 (6.7%) | 422 (5.1%) |
| 35 to 39 Years | 701 (7.5%) | 544 (6.6%) |
| 40 to 44 Years | 646 (6.9%) | 412 (5.0%) |
| 45 to 49 Years | 645 (6.9%) | 648 (7.9%) |
| 50 to 54 Years | 421 (4.5%) | 489 (5.9%) |
| 55 to 59 Years | 740 (7.9%) | 606 (7.4%) |
| 60 to 64 Years | 692 (7.4%) | 494 (6.0%) |
| 65 to 69 Years | 400 (4.3%) | 599 (7.3%) |
| 70 to 74 Years | 531 (5.7%) | 378 (4.6%) |
| 75 to 79 Years | 224 (2.4%) | 469 (5.7%) |
| 80 to 84 Years | 296 (3.2%) | 287 (3.5%) |
| 85 Years and over | 137 (1.5%) | 187 (2.3%) |
| Total | 9,384 (100.0%) | 8,218 (100.0%) |
Families and Households in New Philadelphia
Median Family Size in New Philadelphia
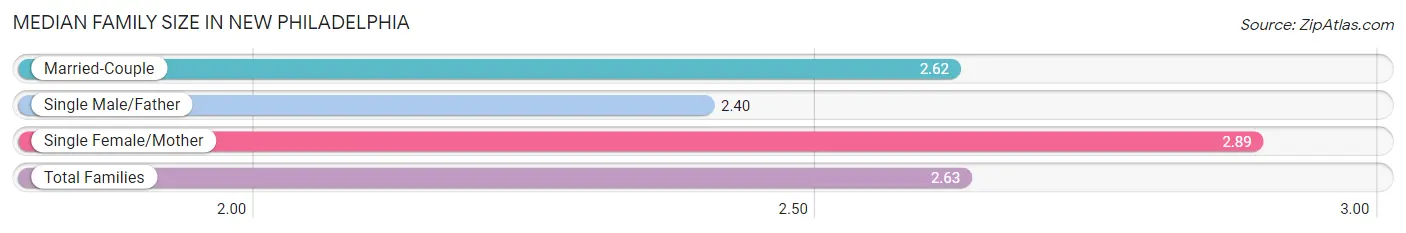
The median family size in New Philadelphia is 2.63 persons per family, with single female/mother families (786 | 16.0%) accounting for the largest median family size of 2.89 persons per family. On the other hand, single male/father families (813 | 16.5%) represent the smallest median family size with 2.40 persons per family.
| Family Type | # Families | Family Size |
| Married-Couple | 3,323 (67.5%) | 2.62 |
| Single Male/Father | 813 (16.5%) | 2.40 |
| Single Female/Mother | 786 (16.0%) | 2.89 |
| Total Families | 4,922 (100.0%) | 2.63 |
Median Household Size in New Philadelphia
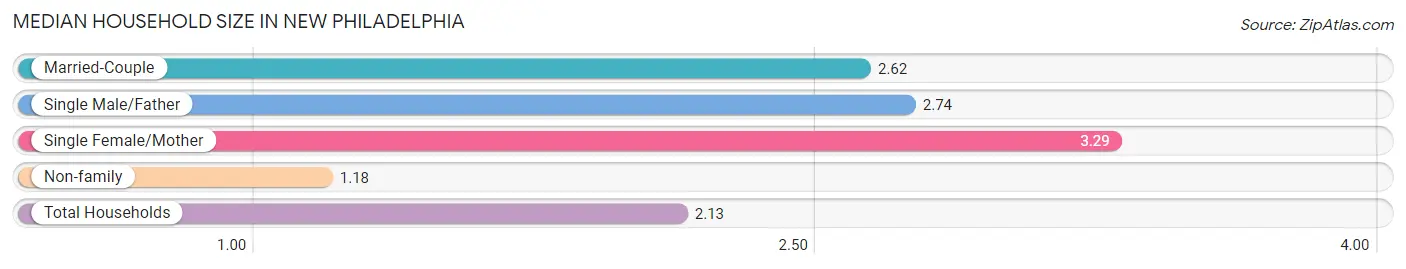
The median household size in New Philadelphia is 2.13 persons per household, with single female/mother households (786 | 9.7%) accounting for the largest median household size of 3.29 persons per household. non-family households (3,189 | 39.3%) represent the smallest median household size with 1.18 persons per household.
| Household Type | # Households | Household Size |
| Married-Couple | 3,323 (41.0%) | 2.62 |
| Single Male/Father | 813 (10.0%) | 2.74 |
| Single Female/Mother | 786 (9.7%) | 3.29 |
| Non-family | 3,189 (39.3%) | 1.18 |
| Total Households | 8,111 (100.0%) | 2.13 |
Household Size by Marriage Status in New Philadelphia
Out of a total of 8,111 households in New Philadelphia, 4,922 (60.7%) are family households, while 3,189 (39.3%) are nonfamily households. The most numerous type of family households are 2-person households, comprising 2,986, and the most common type of nonfamily households are 1-person households, comprising 2,766.
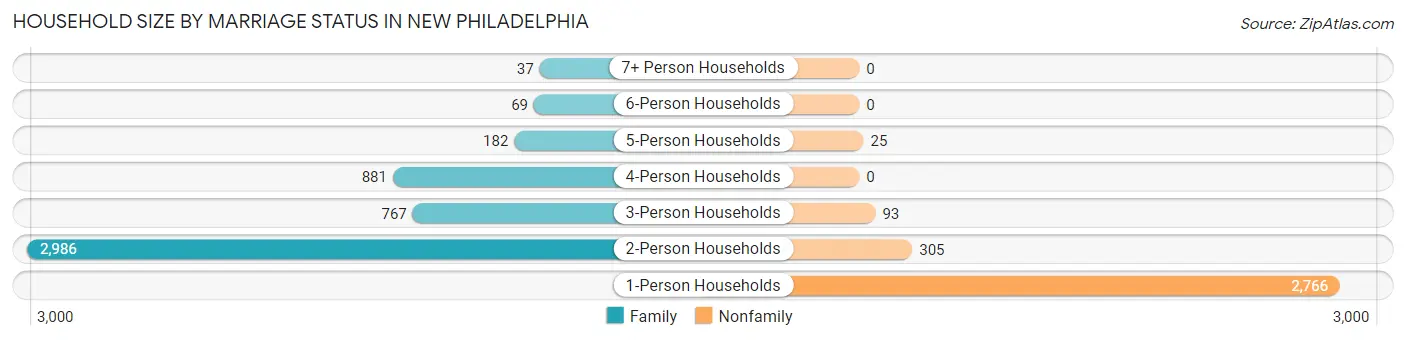
| Household Size | Family Households | Nonfamily Households |
| 1-Person Households | - | 2,766 (34.1%) |
| 2-Person Households | 2,986 (36.8%) | 305 (3.8%) |
| 3-Person Households | 767 (9.5%) | 93 (1.1%) |
| 4-Person Households | 881 (10.9%) | 0 (0.0%) |
| 5-Person Households | 182 (2.2%) | 25 (0.3%) |
| 6-Person Households | 69 (0.9%) | 0 (0.0%) |
| 7+ Person Households | 37 (0.5%) | 0 (0.0%) |
| Total | 4,922 (60.7%) | 3,189 (39.3%) |
Female Fertility in New Philadelphia
Fertility by Age in New Philadelphia
Average fertility rate in New Philadelphia is 67.0 births per 1,000 women. Women in the age bracket of 20 to 34 years have the highest fertility rate with 152.0 births per 1,000 women. Women in the age bracket of 20 to 34 years acount for 100.0% of all women with births.
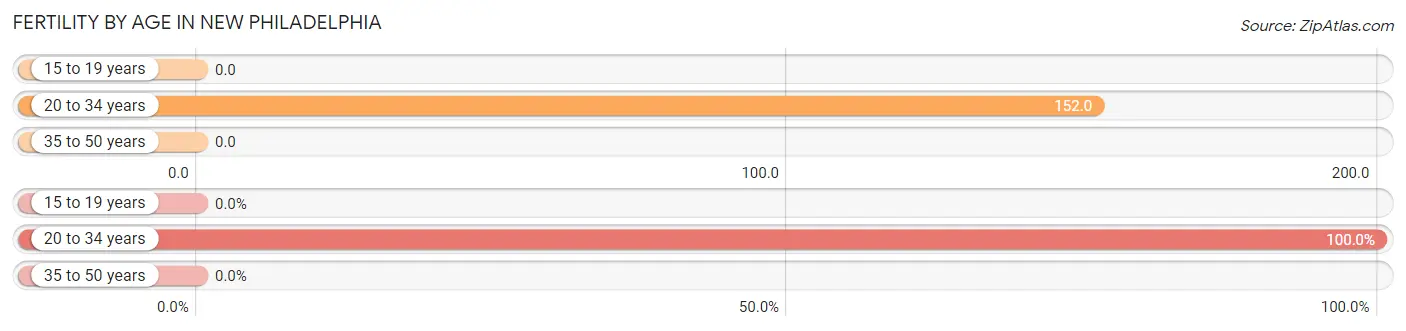
| Age Bracket | Women with Births | Births / 1,000 Women |
| 15 to 19 years | 0 (0.0%) | 0.0 |
| 20 to 34 years | 225 (100.0%) | 152.0 |
| 35 to 50 years | 0 (0.0%) | 0.0 |
| Total | 225 (100.0%) | 67.0 |
Fertility by Age by Marriage Status in New Philadelphia
38.2% of women with births (225) in New Philadelphia are married. The highest percentage of unmarried women with births falls into 20 to 34 years age bracket with 61.8% of them unmarried at the time of birth, while the lowest percentage of unmarried women with births belong to 20 to 34 years age bracket with 61.8% of them unmarried.
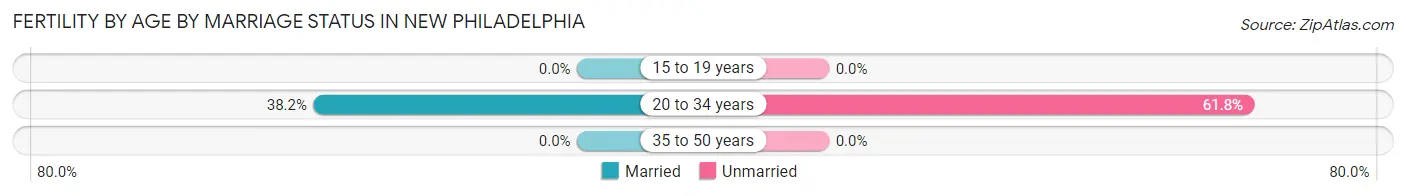
| Age Bracket | Married | Unmarried |
| 15 to 19 years | 0 (0.0%) | 0 (0.0%) |
| 20 to 34 years | 86 (38.2%) | 139 (61.8%) |
| 35 to 50 years | 0 (0.0%) | 0 (0.0%) |
| Total | 86 (38.2%) | 139 (61.8%) |
Fertility by Education in New Philadelphia
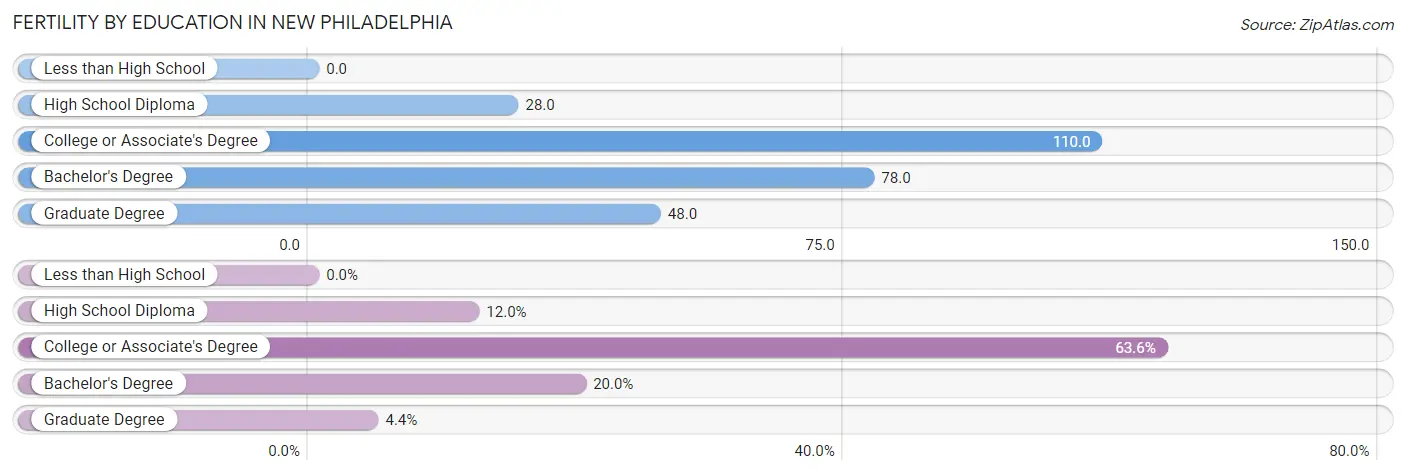
| Educational Attainment | Women with Births | Births / 1,000 Women |
| Less than High School | 0 (0.0%) | 0.0 |
| High School Diploma | 27 (12.0%) | 28.0 |
| College or Associate's Degree | 143 (63.6%) | 110.0 |
| Bachelor's Degree | 45 (20.0%) | 78.0 |
| Graduate Degree | 10 (4.4%) | 48.0 |
| Total | 225 (100.0%) | 67.0 |
Fertility by Education by Marriage Status in New Philadelphia
61.8% of women with births in New Philadelphia are unmarried. Women with the educational attainment of high school diploma are most likely to be married with 100.0% of them married at childbirth, while women with the educational attainment of bachelor's degree are least likely to be married with 100.0% of them unmarried at childbirth.
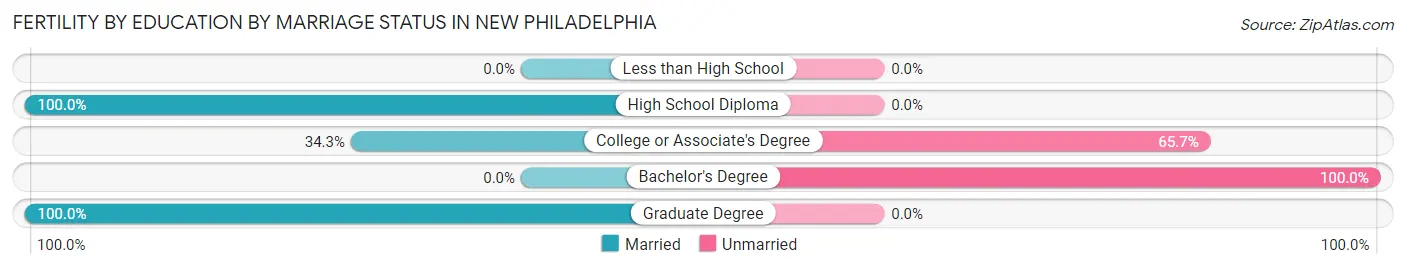
| Educational Attainment | Married | Unmarried |
| Less than High School | 0 (0.0%) | 0 (0.0%) |
| High School Diploma | 27 (100.0%) | 0 (0.0%) |
| College or Associate's Degree | 49 (34.3%) | 94 (65.7%) |
| Bachelor's Degree | 0 (0.0%) | 45 (100.0%) |
| Graduate Degree | 10 (100.0%) | 0 (0.0%) |
| Total | 86 (38.2%) | 139 (61.8%) |
Employment Characteristics in New Philadelphia
Employment by Class of Employer in New Philadelphia
Among the 8,616 employed individuals in New Philadelphia, private company employees (6,585 | 76.4%), local government employees (792 | 9.2%), and not-for-profit organizations (516 | 6.0%) make up the most common classes of employment.
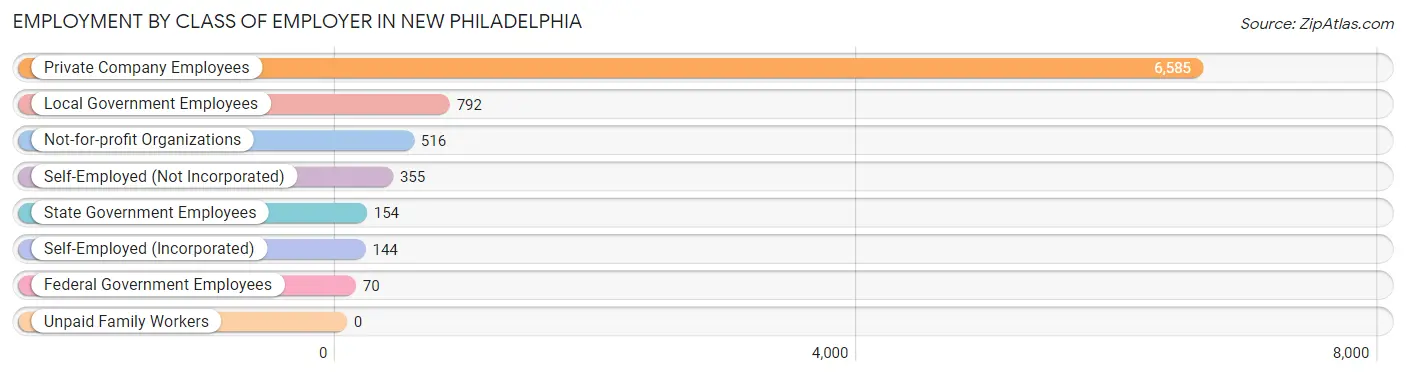
| Employer Class | # Employees | % Employees |
| Private Company Employees | 6,585 | 76.4% |
| Self-Employed (Incorporated) | 144 | 1.7% |
| Self-Employed (Not Incorporated) | 355 | 4.1% |
| Not-for-profit Organizations | 516 | 6.0% |
| Local Government Employees | 792 | 9.2% |
| State Government Employees | 154 | 1.8% |
| Federal Government Employees | 70 | 0.8% |
| Unpaid Family Workers | 0 | 0.0% |
| Total | 8,616 | 100.0% |
Employment Status by Age in New Philadelphia
According to the labor force statistics for New Philadelphia, out of the total population over 16 years of age (14,507), 62.3% or 9,038 individuals are in the labor force, with 3.1% or 280 of them unemployed. The age group with the highest labor force participation rate is 30 to 34 years, with 88.7% or 935 individuals in the labor force. Within the labor force, the 25 to 29 years age range has the highest percentage of unemployed individuals, with 10.6% or 97 of them being unemployed.
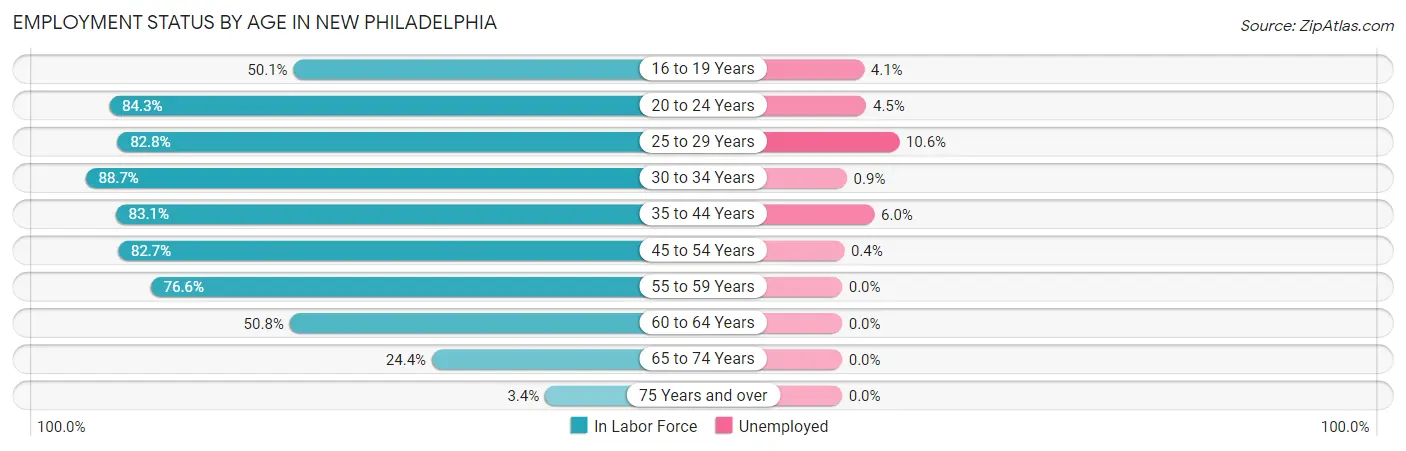
| Age Bracket | In Labor Force | Unemployed |
| 16 to 19 Years | 314 (50.1%) | 13 (4.1%) |
| 20 to 24 Years | 991 (84.3%) | 45 (4.5%) |
| 25 to 29 Years | 914 (82.8%) | 97 (10.6%) |
| 30 to 34 Years | 935 (88.7%) | 8 (0.9%) |
| 35 to 44 Years | 1,914 (83.1%) | 115 (6.0%) |
| 45 to 54 Years | 1,822 (82.7%) | 7 (0.4%) |
| 55 to 59 Years | 1,031 (76.6%) | 0 (0.0%) |
| 60 to 64 Years | 602 (50.8%) | 0 (0.0%) |
| 65 to 74 Years | 466 (24.4%) | 0 (0.0%) |
| 75 Years and over | 54 (3.4%) | 0 (0.0%) |
| Total | 9,038 (62.3%) | 280 (3.1%) |
Employment Status by Educational Attainment in New Philadelphia
According to labor force statistics for New Philadelphia, 78.5% of individuals (7,219) out of the total population between 25 and 64 years of age (9,196) are in the labor force, with 3.1% or 224 of them being unemployed. The group with the highest labor force participation rate are those with the educational attainment of bachelor's degree or higher, with 86.9% or 2,213 individuals in the labor force. Within the labor force, individuals with college / associate degree education have the highest percentage of unemployment, with 6.6% or 142 of them being unemployed.
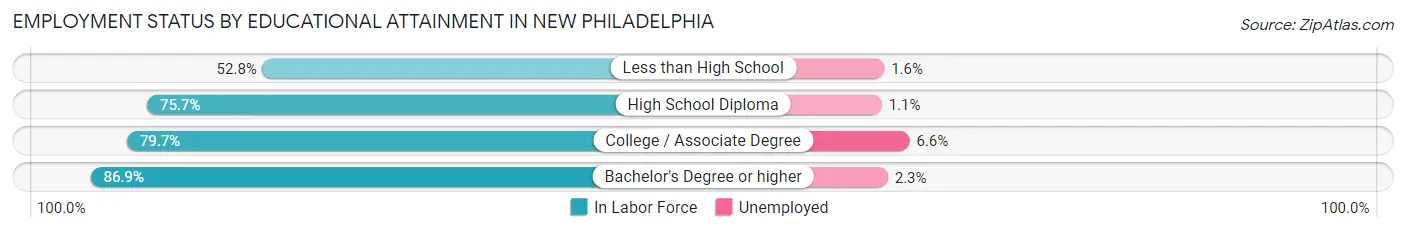
| Educational Attainment | In Labor Force | Unemployed |
| Less than High School | 315 (52.8%) | 10 (1.6%) |
| High School Diploma | 2,539 (75.7%) | 37 (1.1%) |
| College / Associate Degree | 2,150 (79.7%) | 178 (6.6%) |
| Bachelor's Degree or higher | 2,213 (86.9%) | 59 (2.3%) |
| Total | 7,219 (78.5%) | 285 (3.1%) |
Employment Occupations by Sex in New Philadelphia
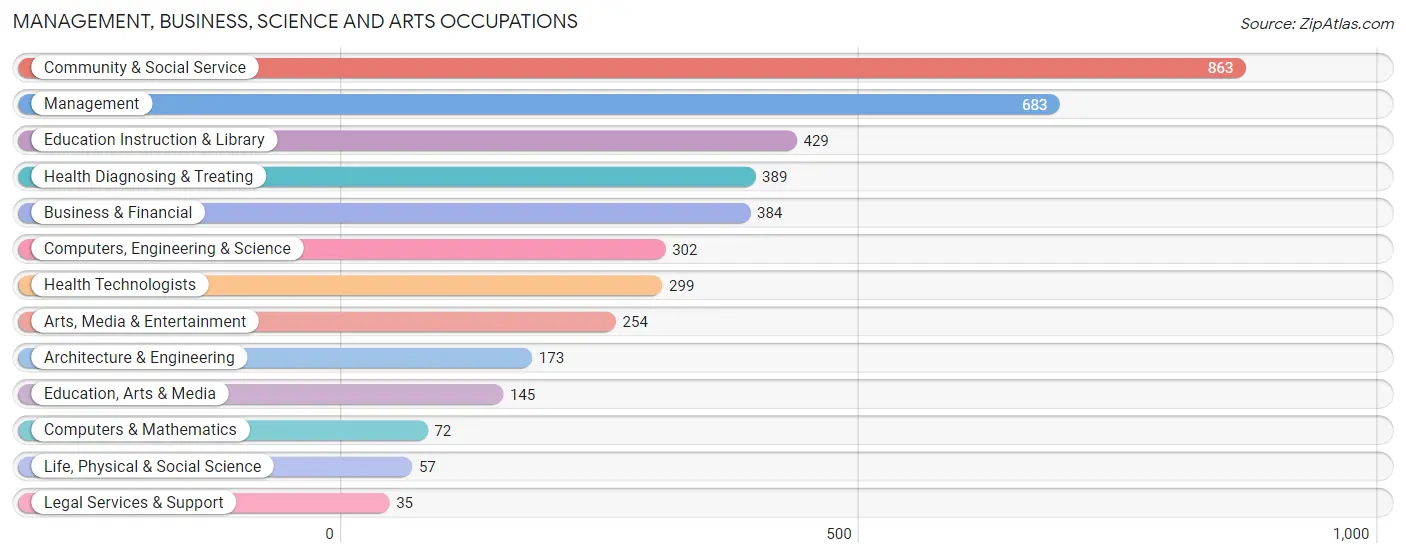
Management, Business, Science and Arts Occupations
The most common Management, Business, Science and Arts occupations in New Philadelphia are Community & Social Service (863 | 9.9%), Management (683 | 7.8%), Education Instruction & Library (429 | 4.9%), Health Diagnosing & Treating (389 | 4.4%), and Business & Financial (384 | 4.4%).
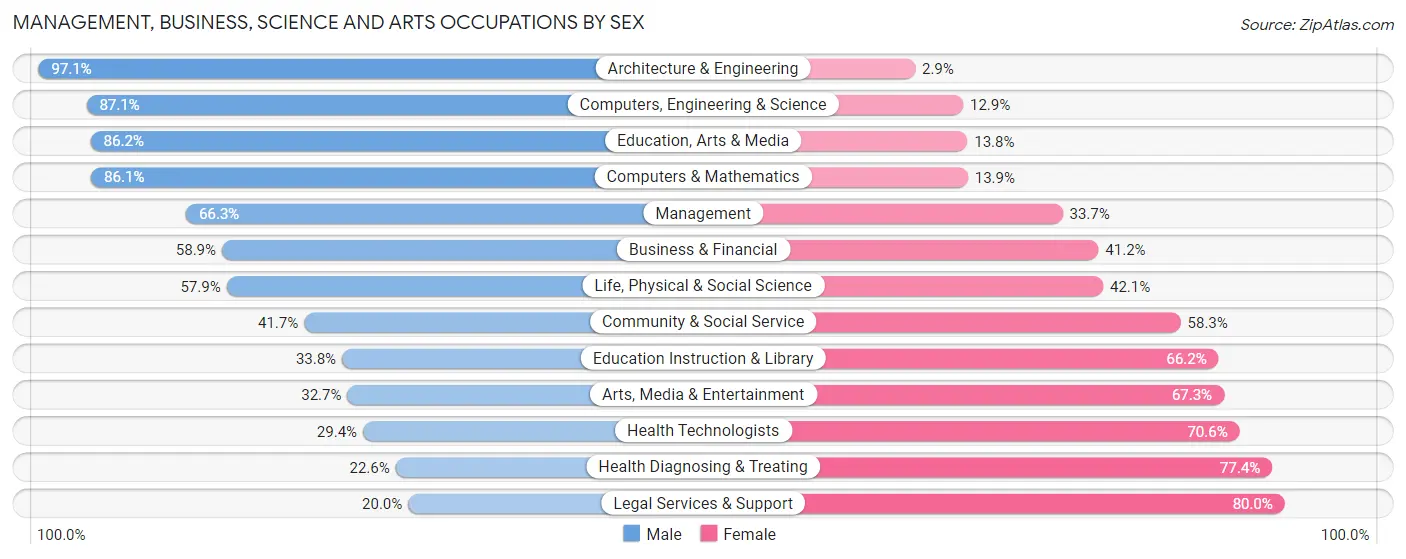
Management, Business, Science and Arts Occupations by Sex
Within the Management, Business, Science and Arts occupations in New Philadelphia, the most male-oriented occupations are Architecture & Engineering (97.1%), Computers, Engineering & Science (87.1%), and Education, Arts & Media (86.2%), while the most female-oriented occupations are Legal Services & Support (80.0%), Health Diagnosing & Treating (77.4%), and Health Technologists (70.6%).
| Occupation | Male | Female |
| Management | 453 (66.3%) | 230 (33.7%) |
| Business & Financial | 226 (58.9%) | 158 (41.1%) |
| Computers, Engineering & Science | 263 (87.1%) | 39 (12.9%) |
| Computers & Mathematics | 62 (86.1%) | 10 (13.9%) |
| Architecture & Engineering | 168 (97.1%) | 5 (2.9%) |
| Life, Physical & Social Science | 33 (57.9%) | 24 (42.1%) |
| Community & Social Service | 360 (41.7%) | 503 (58.3%) |
| Education, Arts & Media | 125 (86.2%) | 20 (13.8%) |
| Legal Services & Support | 7 (20.0%) | 28 (80.0%) |
| Education Instruction & Library | 145 (33.8%) | 284 (66.2%) |
| Arts, Media & Entertainment | 83 (32.7%) | 171 (67.3%) |
| Health Diagnosing & Treating | 88 (22.6%) | 301 (77.4%) |
| Health Technologists | 88 (29.4%) | 211 (70.6%) |
| Total (Category) | 1,390 (53.0%) | 1,231 (47.0%) |
| Total (Overall) | 5,177 (59.1%) | 3,581 (40.9%) |
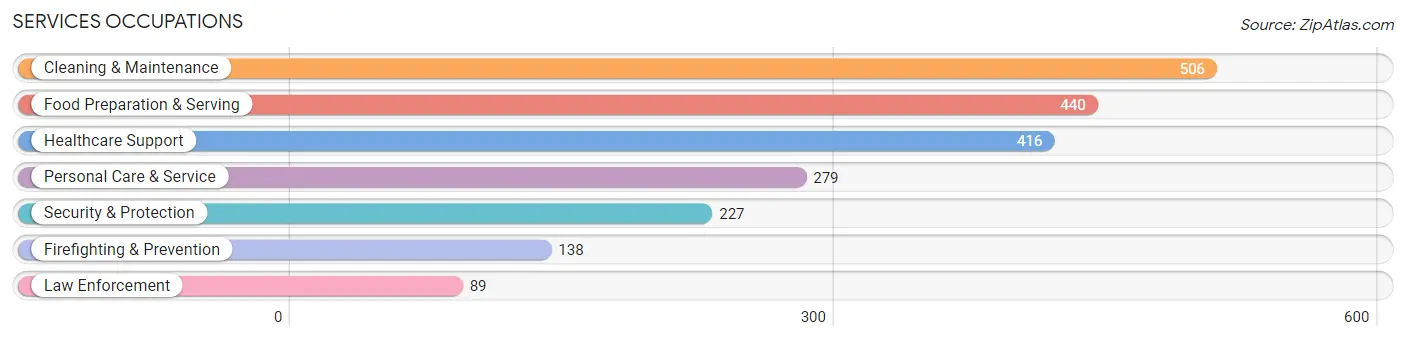
Services Occupations
The most common Services occupations in New Philadelphia are Cleaning & Maintenance (506 | 5.8%), Food Preparation & Serving (440 | 5.0%), Healthcare Support (416 | 4.8%), Personal Care & Service (279 | 3.2%), and Security & Protection (227 | 2.6%).
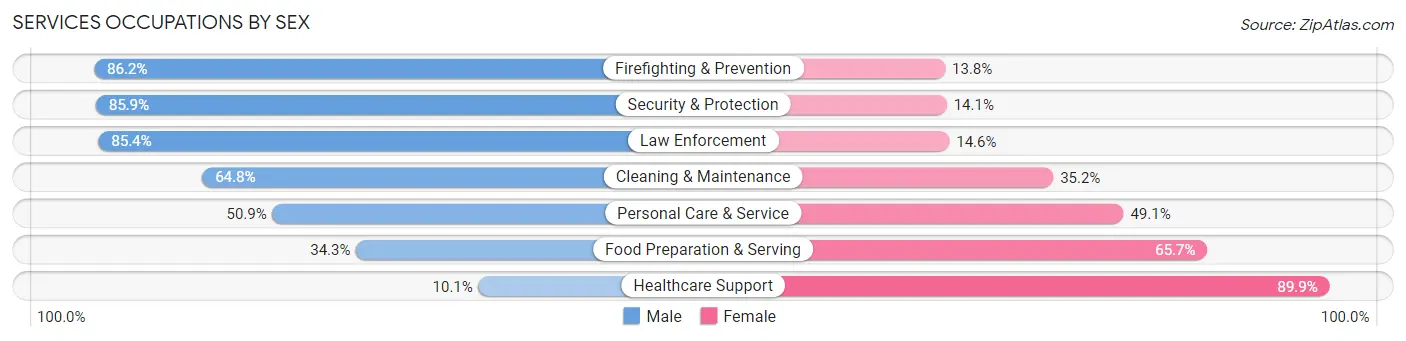
Services Occupations by Sex
Within the Services occupations in New Philadelphia, the most male-oriented occupations are Firefighting & Prevention (86.2%), Security & Protection (85.9%), and Law Enforcement (85.4%), while the most female-oriented occupations are Healthcare Support (89.9%), Food Preparation & Serving (65.7%), and Personal Care & Service (49.1%).
| Occupation | Male | Female |
| Healthcare Support | 42 (10.1%) | 374 (89.9%) |
| Security & Protection | 195 (85.9%) | 32 (14.1%) |
| Firefighting & Prevention | 119 (86.2%) | 19 (13.8%) |
| Law Enforcement | 76 (85.4%) | 13 (14.6%) |
| Food Preparation & Serving | 151 (34.3%) | 289 (65.7%) |
| Cleaning & Maintenance | 328 (64.8%) | 178 (35.2%) |
| Personal Care & Service | 142 (50.9%) | 137 (49.1%) |
| Total (Category) | 858 (45.9%) | 1,010 (54.1%) |
| Total (Overall) | 5,177 (59.1%) | 3,581 (40.9%) |
Sales and Office Occupations
The most common Sales and Office occupations in New Philadelphia are Office & Administration (965 | 11.0%), and Sales & Related (671 | 7.7%).
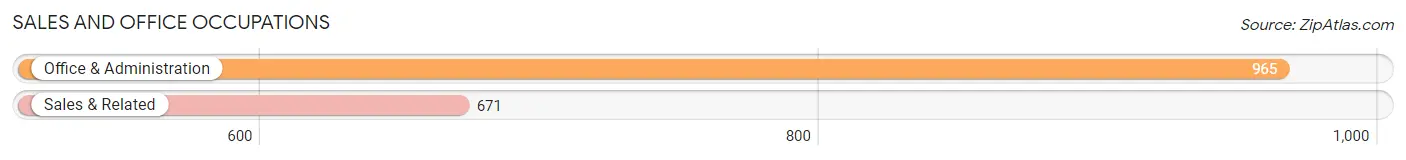
Sales and Office Occupations by Sex
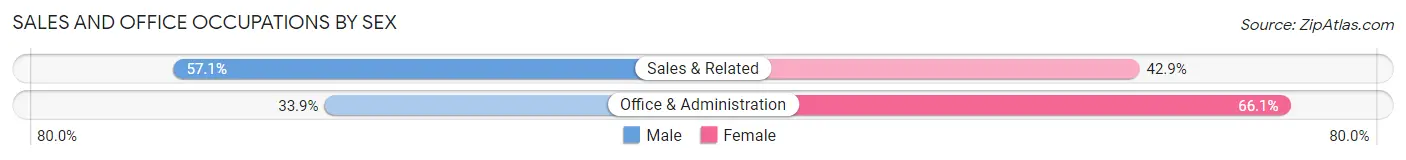
| Occupation | Male | Female |
| Sales & Related | 383 (57.1%) | 288 (42.9%) |
| Office & Administration | 327 (33.9%) | 638 (66.1%) |
| Total (Category) | 710 (43.4%) | 926 (56.6%) |
| Total (Overall) | 5,177 (59.1%) | 3,581 (40.9%) |
Natural Resources, Construction and Maintenance Occupations
The most common Natural Resources, Construction and Maintenance occupations in New Philadelphia are Installation, Maintenance & Repair (356 | 4.1%), Construction & Extraction (316 | 3.6%), and Farming, Fishing & Forestry (20 | 0.2%).
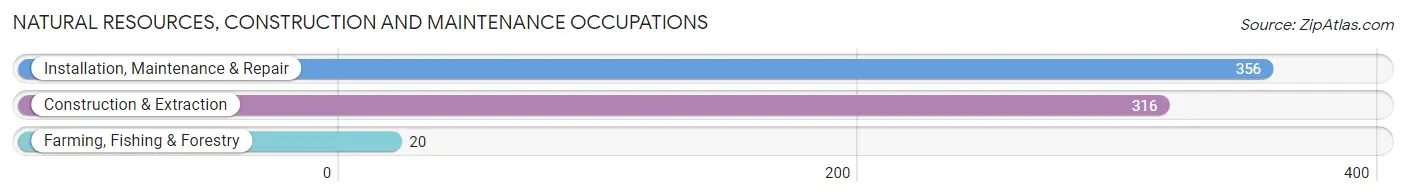
Natural Resources, Construction and Maintenance Occupations by Sex
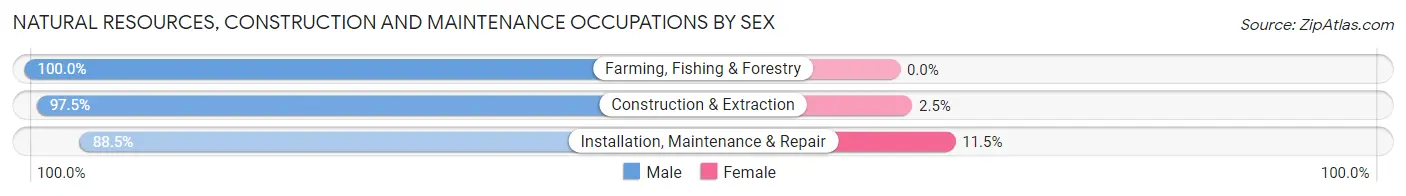
| Occupation | Male | Female |
| Farming, Fishing & Forestry | 20 (100.0%) | 0 (0.0%) |
| Construction & Extraction | 308 (97.5%) | 8 (2.5%) |
| Installation, Maintenance & Repair | 315 (88.5%) | 41 (11.5%) |
| Total (Category) | 643 (92.9%) | 49 (7.1%) |
| Total (Overall) | 5,177 (59.1%) | 3,581 (40.9%) |
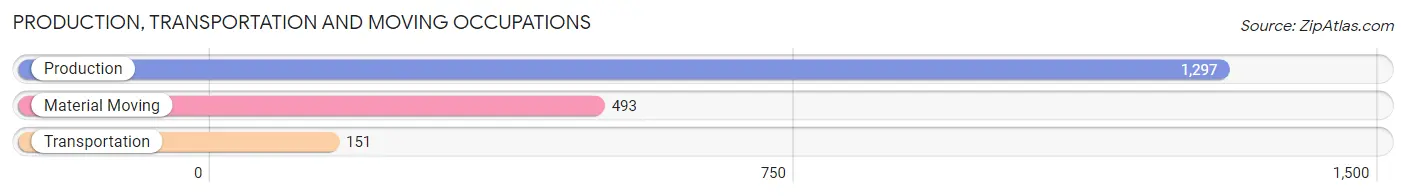
Production, Transportation and Moving Occupations
The most common Production, Transportation and Moving occupations in New Philadelphia are Production (1,297 | 14.8%), Material Moving (493 | 5.6%), and Transportation (151 | 1.7%).
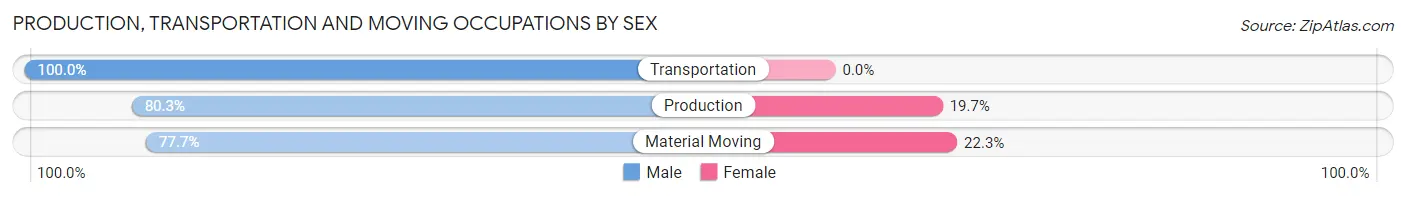
Production, Transportation and Moving Occupations by Sex
| Occupation | Male | Female |
| Production | 1,042 (80.3%) | 255 (19.7%) |
| Transportation | 151 (100.0%) | 0 (0.0%) |
| Material Moving | 383 (77.7%) | 110 (22.3%) |
| Total (Category) | 1,576 (81.2%) | 365 (18.8%) |
| Total (Overall) | 5,177 (59.1%) | 3,581 (40.9%) |
Employment Industries by Sex in New Philadelphia
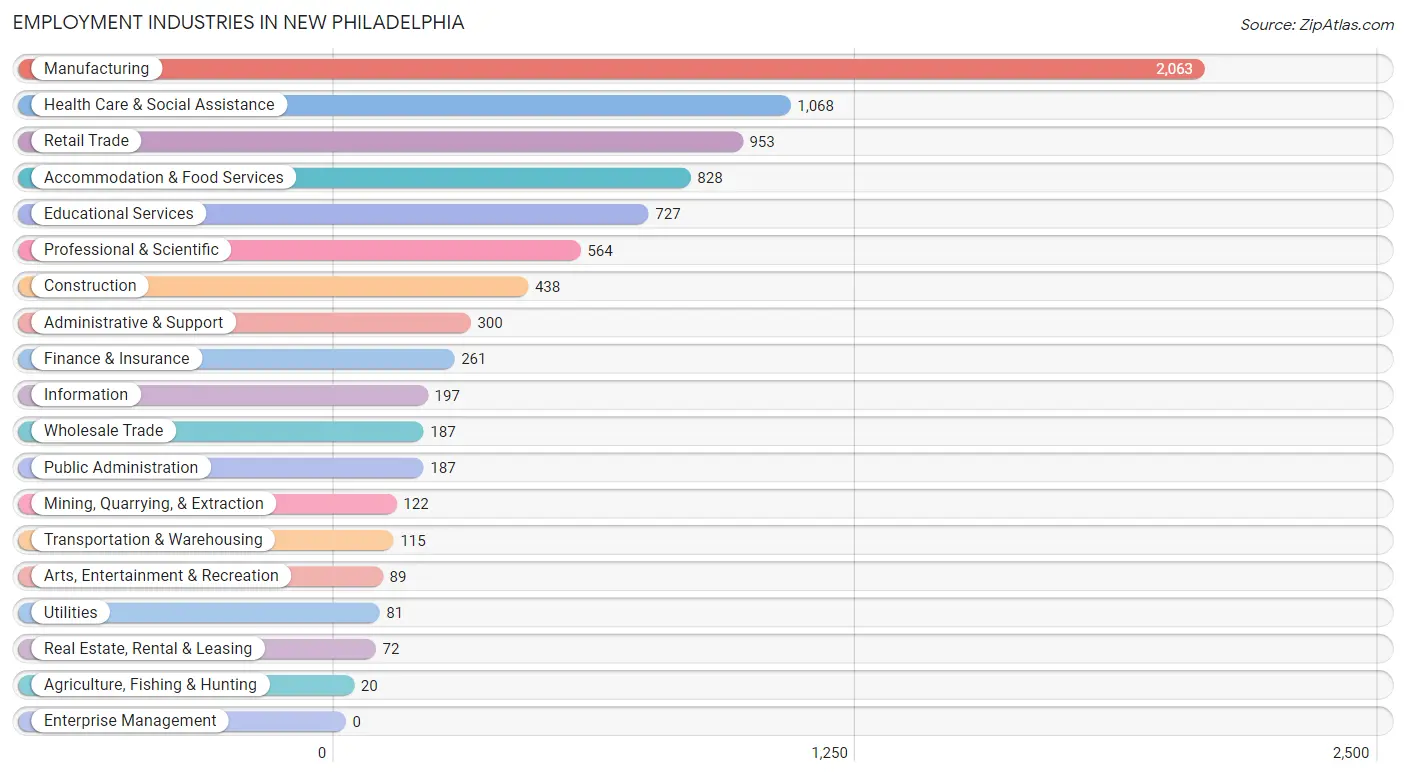
Employment Industries in New Philadelphia
The major employment industries in New Philadelphia include Manufacturing (2,063 | 23.6%), Health Care & Social Assistance (1,068 | 12.2%), Retail Trade (953 | 10.9%), Accommodation & Food Services (828 | 9.5%), and Educational Services (727 | 8.3%).
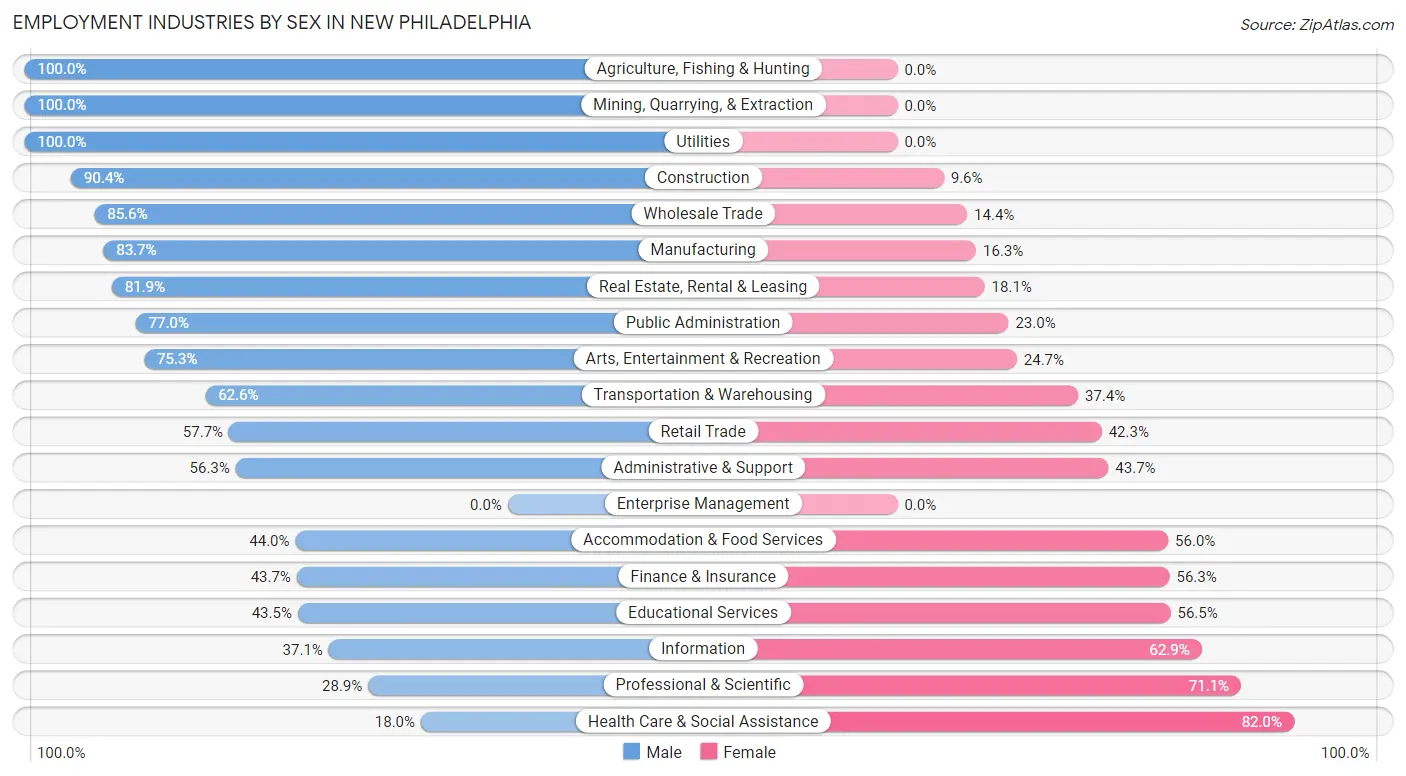
Employment Industries by Sex in New Philadelphia
The New Philadelphia industries that see more men than women are Agriculture, Fishing & Hunting (100.0%), Mining, Quarrying, & Extraction (100.0%), and Utilities (100.0%), whereas the industries that tend to have a higher number of women are Health Care & Social Assistance (82.0%), Professional & Scientific (71.1%), and Information (62.9%).
| Industry | Male | Female |
| Agriculture, Fishing & Hunting | 20 (100.0%) | 0 (0.0%) |
| Mining, Quarrying, & Extraction | 122 (100.0%) | 0 (0.0%) |
| Construction | 396 (90.4%) | 42 (9.6%) |
| Manufacturing | 1,727 (83.7%) | 336 (16.3%) |
| Wholesale Trade | 160 (85.6%) | 27 (14.4%) |
| Retail Trade | 550 (57.7%) | 403 (42.3%) |
| Transportation & Warehousing | 72 (62.6%) | 43 (37.4%) |
| Utilities | 81 (100.0%) | 0 (0.0%) |
| Information | 73 (37.1%) | 124 (62.9%) |
| Finance & Insurance | 114 (43.7%) | 147 (56.3%) |
| Real Estate, Rental & Leasing | 59 (81.9%) | 13 (18.1%) |
| Professional & Scientific | 163 (28.9%) | 401 (71.1%) |
| Enterprise Management | 0 (0.0%) | 0 (0.0%) |
| Administrative & Support | 169 (56.3%) | 131 (43.7%) |
| Educational Services | 316 (43.5%) | 411 (56.5%) |
| Health Care & Social Assistance | 192 (18.0%) | 876 (82.0%) |
| Arts, Entertainment & Recreation | 67 (75.3%) | 22 (24.7%) |
| Accommodation & Food Services | 364 (44.0%) | 464 (56.0%) |
| Public Administration | 144 (77.0%) | 43 (23.0%) |
| Total | 5,177 (59.1%) | 3,581 (40.9%) |
Education in New Philadelphia
School Enrollment in New Philadelphia
The most common levels of schooling among the 3,360 students in New Philadelphia are elementary school (837 | 24.9%), high school (689 | 20.5%), and college / undergraduate (661 | 19.7%).
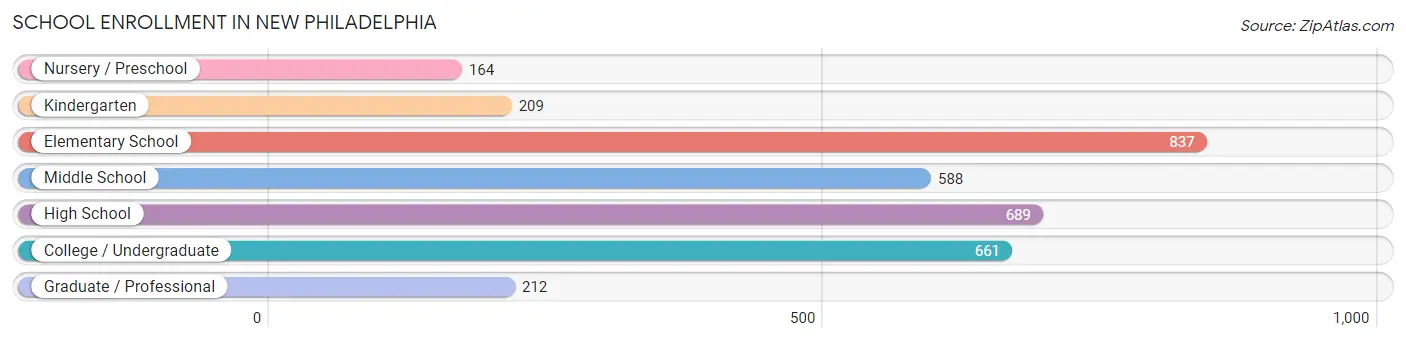
| School Level | # Students | % Students |
| Nursery / Preschool | 164 | 4.9% |
| Kindergarten | 209 | 6.2% |
| Elementary School | 837 | 24.9% |
| Middle School | 588 | 17.5% |
| High School | 689 | 20.5% |
| College / Undergraduate | 661 | 19.7% |
| Graduate / Professional | 212 | 6.3% |
| Total | 3,360 | 100.0% |
School Enrollment by Age by Funding Source in New Philadelphia
Out of a total of 3,360 students who are enrolled in schools in New Philadelphia, 504 (15.0%) attend a private institution, while the remaining 2,856 (85.0%) are enrolled in public schools. The age group of 3 to 4 year olds has the highest likelihood of being enrolled in private schools, with 37 (47.4% in the age bracket) enrolled. Conversely, the age group of 18 to 19 year olds has the lowest likelihood of being enrolled in a private school, with 108 (100.0% in the age bracket) attending a public institution.
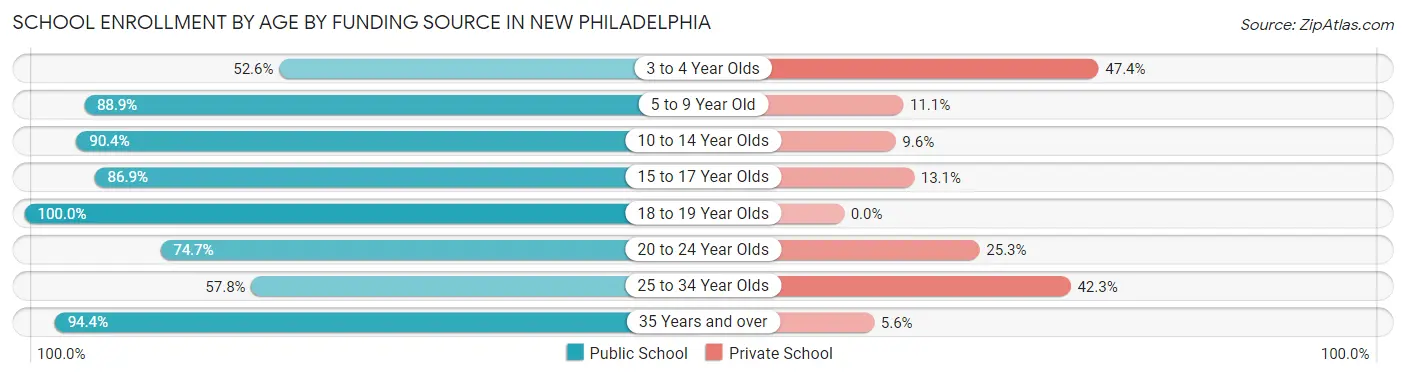
| Age Bracket | Public School | Private School |
| 3 to 4 Year Olds | 41 (52.6%) | 37 (47.4%) |
| 5 to 9 Year Old | 885 (88.9%) | 110 (11.1%) |
| 10 to 14 Year Olds | 750 (90.4%) | 80 (9.6%) |
| 15 to 17 Year Olds | 426 (86.9%) | 64 (13.1%) |
| 18 to 19 Year Olds | 108 (100.0%) | 0 (0.0%) |
| 20 to 24 Year Olds | 263 (74.7%) | 89 (25.3%) |
| 25 to 34 Year Olds | 149 (57.8%) | 109 (42.2%) |
| 35 Years and over | 235 (94.4%) | 14 (5.6%) |
| Total | 2,856 (85.0%) | 504 (15.0%) |
Educational Attainment by Field of Study in New Philadelphia
Business (763 | 23.7%), education (631 | 19.6%), science & technology (448 | 13.9%), liberal arts & history (287 | 8.9%), and social sciences (227 | 7.0%) are the most common fields of study among 3,221 individuals in New Philadelphia who have obtained a bachelor's degree or higher.
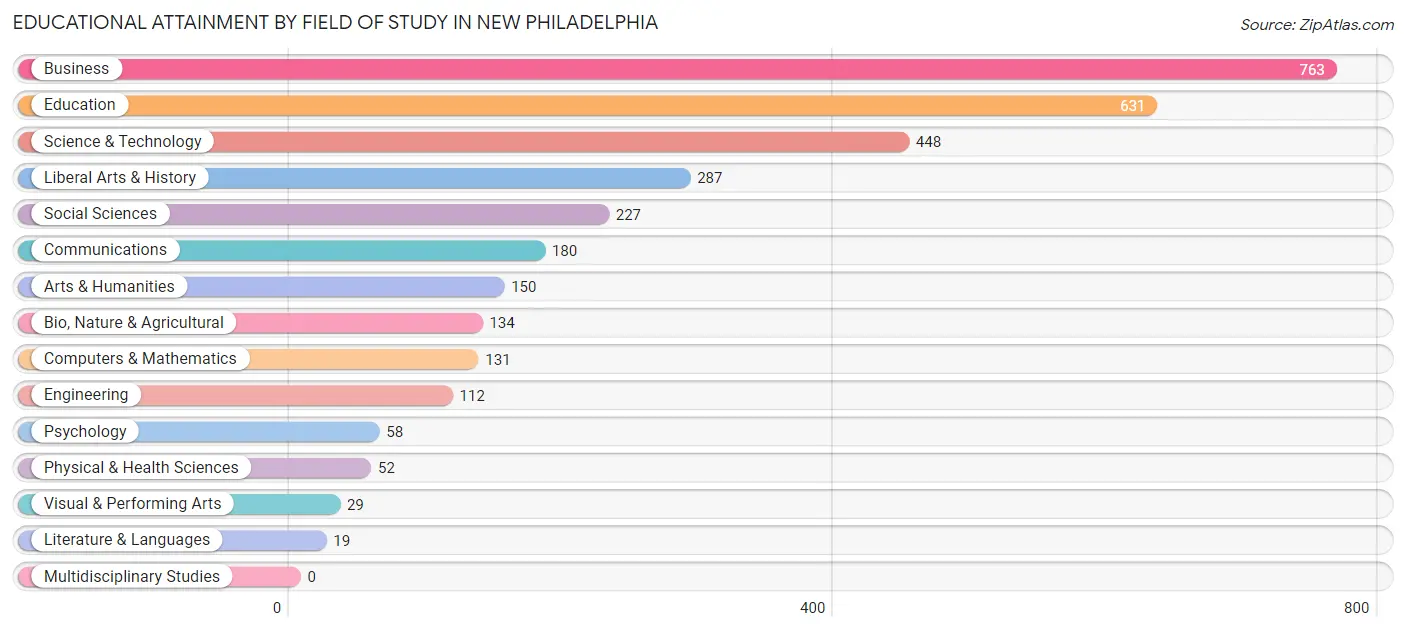
| Field of Study | # Graduates | % Graduates |
| Computers & Mathematics | 131 | 4.1% |
| Bio, Nature & Agricultural | 134 | 4.2% |
| Physical & Health Sciences | 52 | 1.6% |
| Psychology | 58 | 1.8% |
| Social Sciences | 227 | 7.0% |
| Engineering | 112 | 3.5% |
| Multidisciplinary Studies | 0 | 0.0% |
| Science & Technology | 448 | 13.9% |
| Business | 763 | 23.7% |
| Education | 631 | 19.6% |
| Literature & Languages | 19 | 0.6% |
| Liberal Arts & History | 287 | 8.9% |
| Visual & Performing Arts | 29 | 0.9% |
| Communications | 180 | 5.6% |
| Arts & Humanities | 150 | 4.7% |
| Total | 3,221 | 100.0% |
Transportation & Commute in New Philadelphia
Vehicle Availability by Sex in New Philadelphia
The most prevalent vehicle ownership categories in New Philadelphia are males with 2 vehicles (2,174, accounting for 42.9%) and females with 2 vehicles (1,684, making up 61.8%).
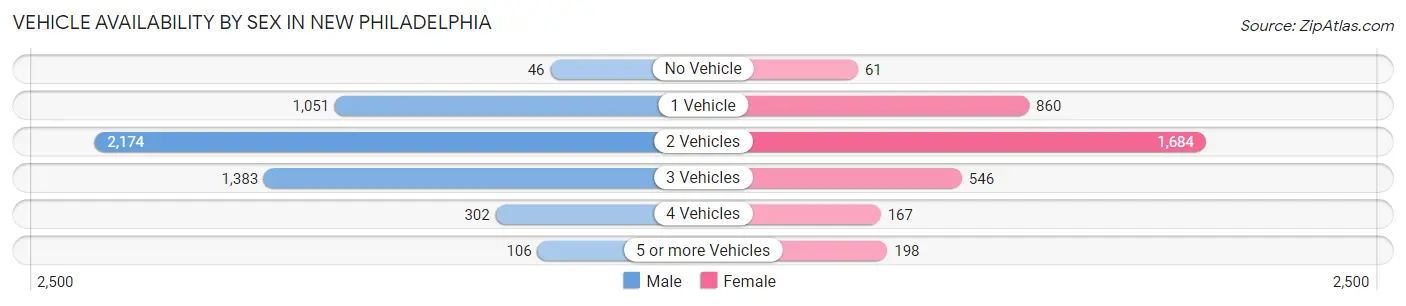
| Vehicles Available | Male | Female |
| No Vehicle | 46 (0.9%) | 61 (1.7%) |
| 1 Vehicle | 1,051 (20.8%) | 860 (24.5%) |
| 2 Vehicles | 2,174 (42.9%) | 1,684 (47.9%) |
| 3 Vehicles | 1,383 (27.3%) | 546 (15.5%) |
| 4 Vehicles | 302 (6.0%) | 167 (4.8%) |
| 5 or more Vehicles | 106 (2.1%) | 198 (5.6%) |
| Total | 5,062 (100.0%) | 3,516 (100.0%) |
Commute Time in New Philadelphia
The most frequently occuring commute durations in New Philadelphia are 10 to 14 minutes (1,820 commuters, 22.6%), 5 to 9 minutes (1,676 commuters, 20.8%), and 15 to 19 minutes (1,167 commuters, 14.5%).
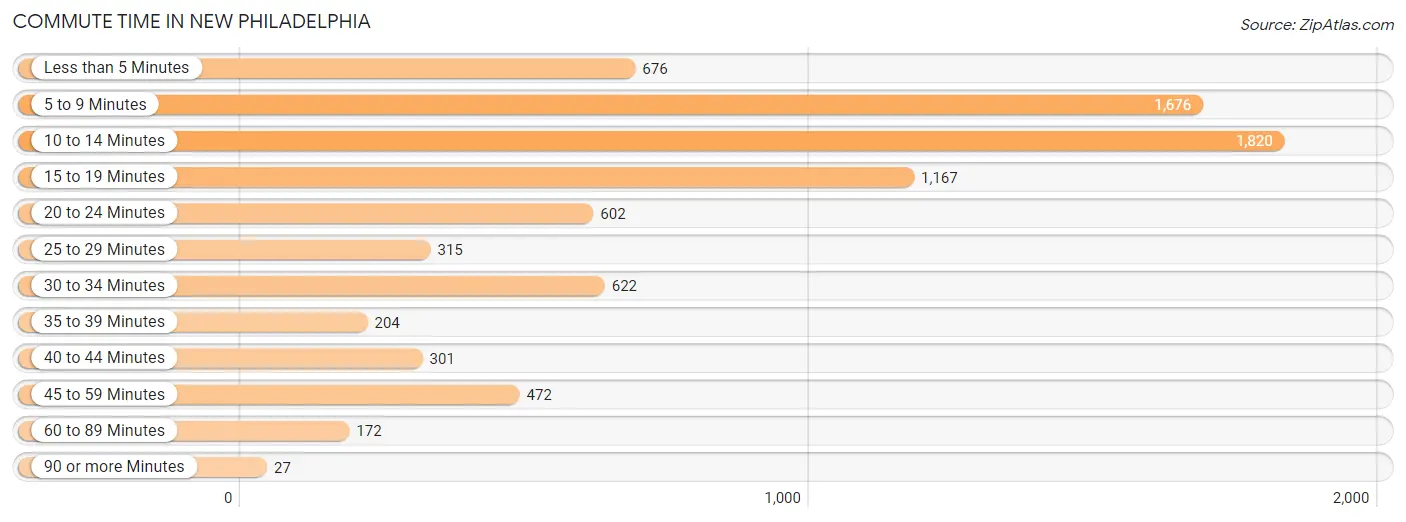
| Commute Time | # Commuters | % Commuters |
| Less than 5 Minutes | 676 | 8.4% |
| 5 to 9 Minutes | 1,676 | 20.8% |
| 10 to 14 Minutes | 1,820 | 22.6% |
| 15 to 19 Minutes | 1,167 | 14.5% |
| 20 to 24 Minutes | 602 | 7.5% |
| 25 to 29 Minutes | 315 | 3.9% |
| 30 to 34 Minutes | 622 | 7.7% |
| 35 to 39 Minutes | 204 | 2.5% |
| 40 to 44 Minutes | 301 | 3.7% |
| 45 to 59 Minutes | 472 | 5.9% |
| 60 to 89 Minutes | 172 | 2.1% |
| 90 or more Minutes | 27 | 0.3% |
Commute Time by Sex in New Philadelphia
The most common commute times in New Philadelphia are 10 to 14 minutes (1,025 commuters, 21.2%) for males and 10 to 14 minutes (795 commuters, 24.6%) for females.
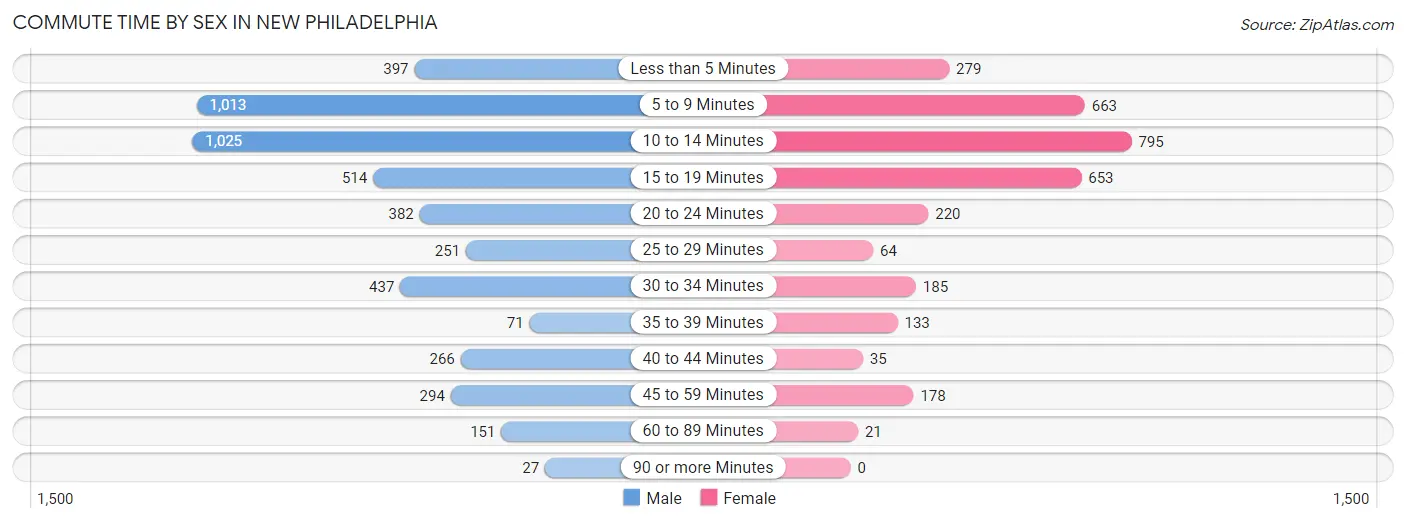
| Commute Time | Male | Female |
| Less than 5 Minutes | 397 (8.2%) | 279 (8.6%) |
| 5 to 9 Minutes | 1,013 (21.0%) | 663 (20.5%) |
| 10 to 14 Minutes | 1,025 (21.2%) | 795 (24.6%) |
| 15 to 19 Minutes | 514 (10.6%) | 653 (20.2%) |
| 20 to 24 Minutes | 382 (7.9%) | 220 (6.8%) |
| 25 to 29 Minutes | 251 (5.2%) | 64 (2.0%) |
| 30 to 34 Minutes | 437 (9.0%) | 185 (5.7%) |
| 35 to 39 Minutes | 71 (1.5%) | 133 (4.1%) |
| 40 to 44 Minutes | 266 (5.5%) | 35 (1.1%) |
| 45 to 59 Minutes | 294 (6.1%) | 178 (5.5%) |
| 60 to 89 Minutes | 151 (3.1%) | 21 (0.6%) |
| 90 or more Minutes | 27 (0.6%) | 0 (0.0%) |
Time of Departure to Work by Sex in New Philadelphia
The most frequent times of departure to work in New Philadelphia are 7:00 AM to 7:29 AM (712, 14.7%) for males and 6:30 AM to 6:59 AM (422, 13.1%) for females.
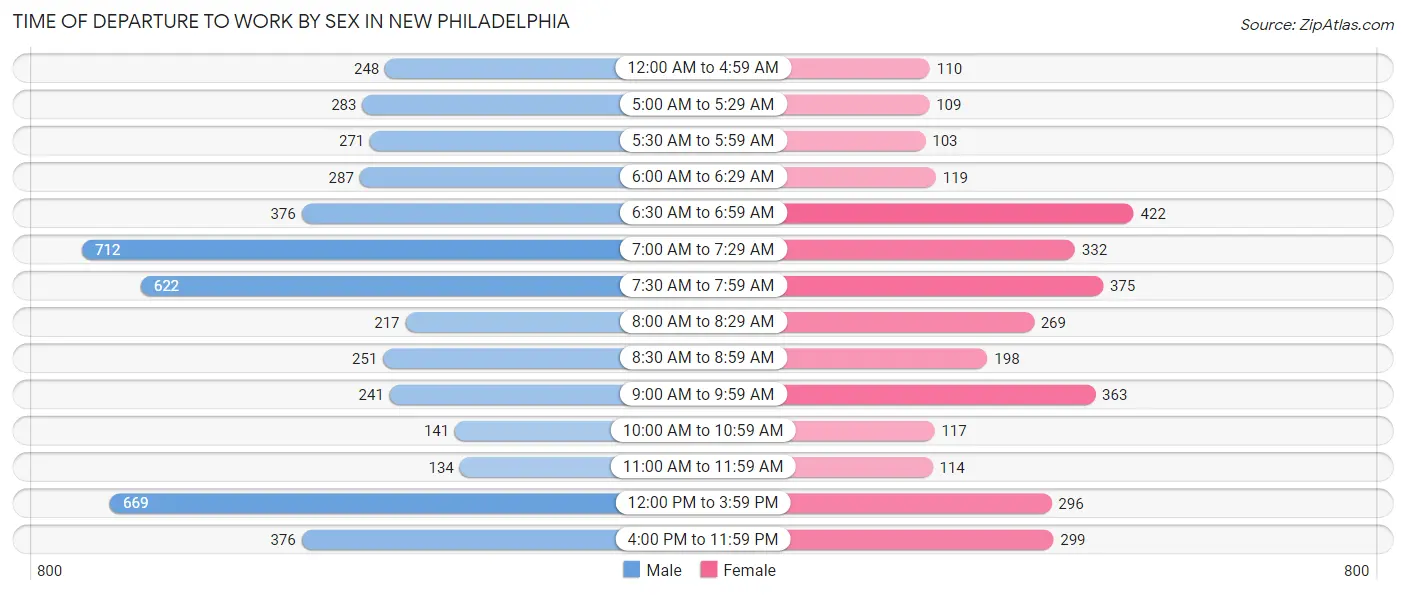
| Time of Departure | Male | Female |
| 12:00 AM to 4:59 AM | 248 (5.1%) | 110 (3.4%) |
| 5:00 AM to 5:29 AM | 283 (5.9%) | 109 (3.4%) |
| 5:30 AM to 5:59 AM | 271 (5.6%) | 103 (3.2%) |
| 6:00 AM to 6:29 AM | 287 (5.9%) | 119 (3.7%) |
| 6:30 AM to 6:59 AM | 376 (7.8%) | 422 (13.1%) |
| 7:00 AM to 7:29 AM | 712 (14.7%) | 332 (10.3%) |
| 7:30 AM to 7:59 AM | 622 (12.9%) | 375 (11.6%) |
| 8:00 AM to 8:29 AM | 217 (4.5%) | 269 (8.3%) |
| 8:30 AM to 8:59 AM | 251 (5.2%) | 198 (6.1%) |
| 9:00 AM to 9:59 AM | 241 (5.0%) | 363 (11.3%) |
| 10:00 AM to 10:59 AM | 141 (2.9%) | 117 (3.6%) |
| 11:00 AM to 11:59 AM | 134 (2.8%) | 114 (3.5%) |
| 12:00 PM to 3:59 PM | 669 (13.9%) | 296 (9.2%) |
| 4:00 PM to 11:59 PM | 376 (7.8%) | 299 (9.3%) |
| Total | 4,828 (100.0%) | 3,226 (100.0%) |
Housing Occupancy in New Philadelphia
Occupancy by Ownership in New Philadelphia
Of the total 8,111 dwellings in New Philadelphia, owner-occupied units account for 5,026 (62.0%), while renter-occupied units make up 3,085 (38.0%).
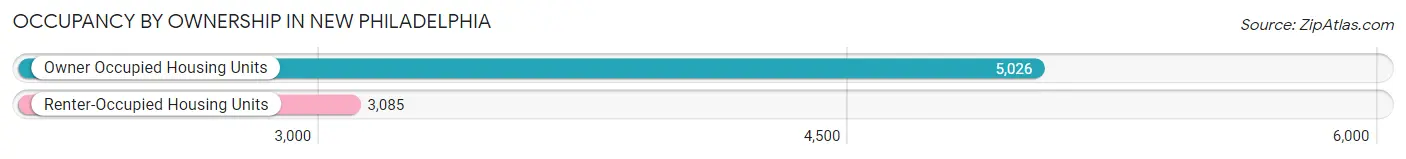
| Occupancy | # Housing Units | % Housing Units |
| Owner Occupied Housing Units | 5,026 | 62.0% |
| Renter-Occupied Housing Units | 3,085 | 38.0% |
| Total Occupied Housing Units | 8,111 | 100.0% |
Occupancy by Household Size in New Philadelphia
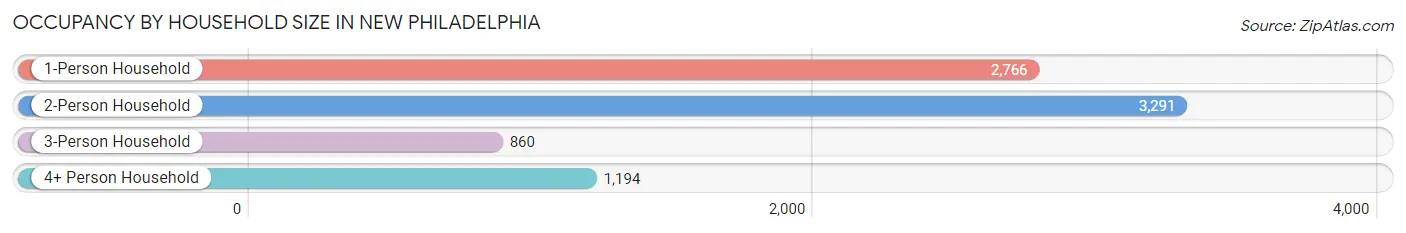
| Household Size | # Housing Units | % Housing Units |
| 1-Person Household | 2,766 | 34.1% |
| 2-Person Household | 3,291 | 40.6% |
| 3-Person Household | 860 | 10.6% |
| 4+ Person Household | 1,194 | 14.7% |
| Total Housing Units | 8,111 | 100.0% |
Occupancy by Ownership by Household Size in New Philadelphia
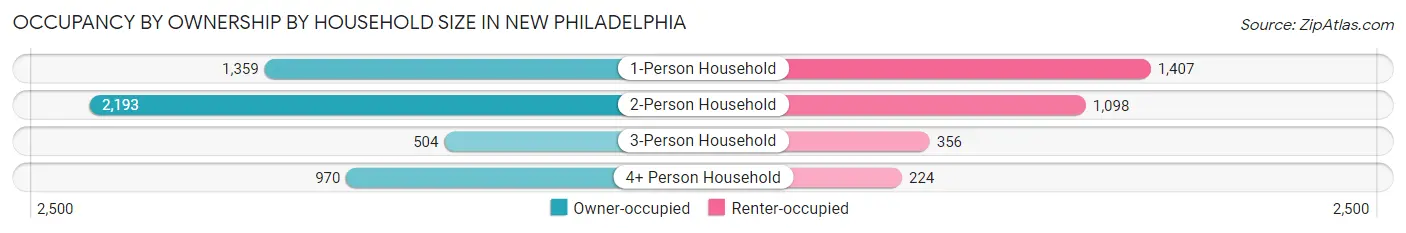
| Household Size | Owner-occupied | Renter-occupied |
| 1-Person Household | 1,359 (49.1%) | 1,407 (50.9%) |
| 2-Person Household | 2,193 (66.6%) | 1,098 (33.4%) |
| 3-Person Household | 504 (58.6%) | 356 (41.4%) |
| 4+ Person Household | 970 (81.2%) | 224 (18.8%) |
| Total Housing Units | 5,026 (62.0%) | 3,085 (38.0%) |
Occupancy by Educational Attainment in New Philadelphia
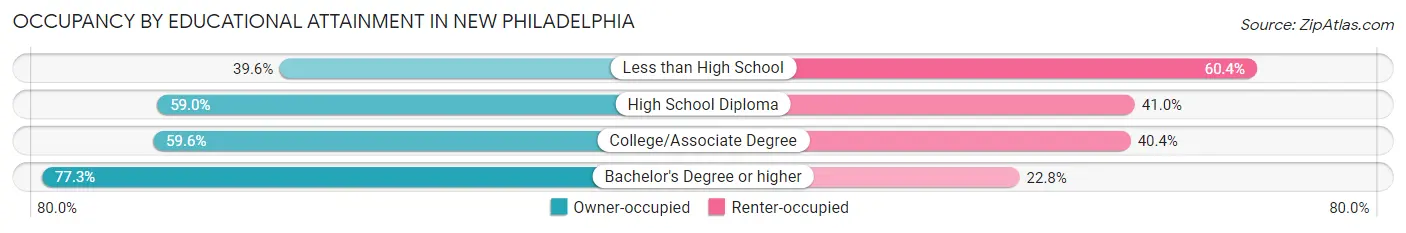
| Household Size | Owner-occupied | Renter-occupied |
| Less than High School | 300 (39.6%) | 457 (60.4%) |
| High School Diploma | 1,886 (59.0%) | 1,313 (41.0%) |
| College/Associate Degree | 1,251 (59.6%) | 847 (40.4%) |
| Bachelor's Degree or higher | 1,589 (77.2%) | 468 (22.8%) |
Occupancy by Age of Householder in New Philadelphia
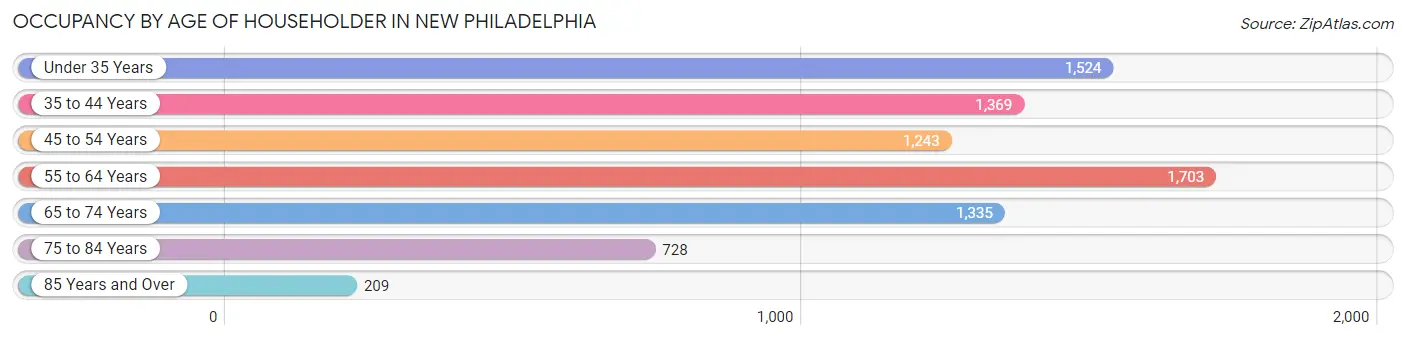
| Age Bracket | # Households | % Households |
| Under 35 Years | 1,524 | 18.8% |
| 35 to 44 Years | 1,369 | 16.9% |
| 45 to 54 Years | 1,243 | 15.3% |
| 55 to 64 Years | 1,703 | 21.0% |
| 65 to 74 Years | 1,335 | 16.5% |
| 75 to 84 Years | 728 | 9.0% |
| 85 Years and Over | 209 | 2.6% |
| Total | 8,111 | 100.0% |
Housing Finances in New Philadelphia
Median Income by Occupancy in New Philadelphia
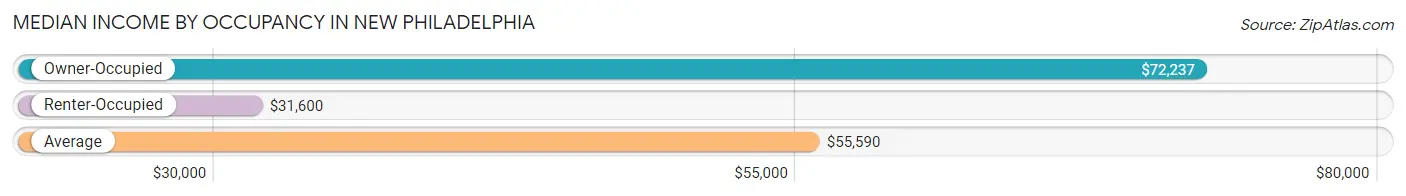
| Occupancy Type | # Households | Median Income |
| Owner-Occupied | 5,026 (62.0%) | $72,237 |
| Renter-Occupied | 3,085 (38.0%) | $31,600 |
| Average | 8,111 (100.0%) | $55,590 |
Occupancy by Householder Income Bracket in New Philadelphia
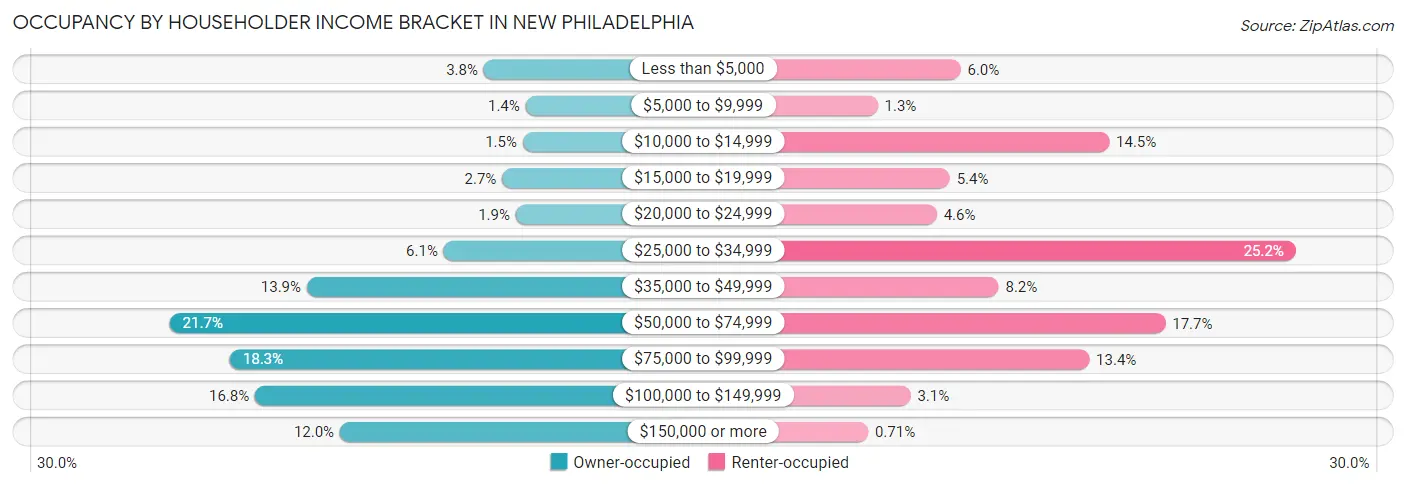
| Income Bracket | Owner-occupied | Renter-occupied |
| Less than $5,000 | 189 (3.8%) | 185 (6.0%) |
| $5,000 to $9,999 | 69 (1.4%) | 39 (1.3%) |
| $10,000 to $14,999 | 77 (1.5%) | 447 (14.5%) |
| $15,000 to $19,999 | 136 (2.7%) | 166 (5.4%) |
| $20,000 to $24,999 | 97 (1.9%) | 143 (4.6%) |
| $25,000 to $34,999 | 304 (6.0%) | 776 (25.2%) |
| $35,000 to $49,999 | 697 (13.9%) | 252 (8.2%) |
| $50,000 to $74,999 | 1,091 (21.7%) | 546 (17.7%) |
| $75,000 to $99,999 | 918 (18.3%) | 412 (13.4%) |
| $100,000 to $149,999 | 846 (16.8%) | 97 (3.1%) |
| $150,000 or more | 602 (12.0%) | 22 (0.7%) |
| Total | 5,026 (100.0%) | 3,085 (100.0%) |
Monthly Housing Cost Tiers in New Philadelphia
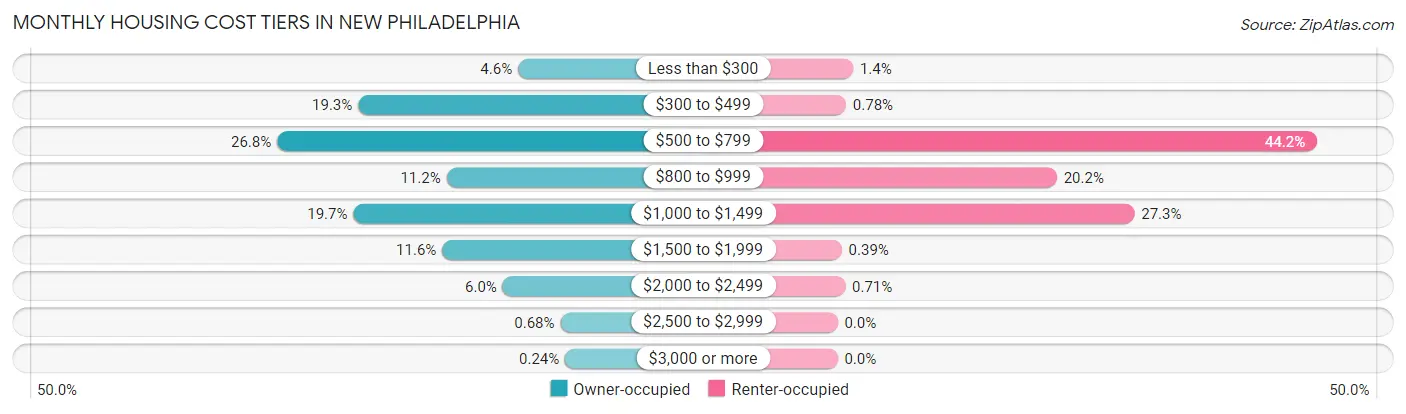
| Monthly Cost | Owner-occupied | Renter-occupied |
| Less than $300 | 230 (4.6%) | 44 (1.4%) |
| $300 to $499 | 970 (19.3%) | 24 (0.8%) |
| $500 to $799 | 1,345 (26.8%) | 1,362 (44.2%) |
| $800 to $999 | 561 (11.2%) | 623 (20.2%) |
| $1,000 to $1,499 | 992 (19.7%) | 843 (27.3%) |
| $1,500 to $1,999 | 581 (11.6%) | 12 (0.4%) |
| $2,000 to $2,499 | 301 (6.0%) | 22 (0.7%) |
| $2,500 to $2,999 | 34 (0.7%) | 0 (0.0%) |
| $3,000 or more | 12 (0.2%) | 0 (0.0%) |
| Total | 5,026 (100.0%) | 3,085 (100.0%) |
Physical Housing Characteristics in New Philadelphia
Housing Structures in New Philadelphia
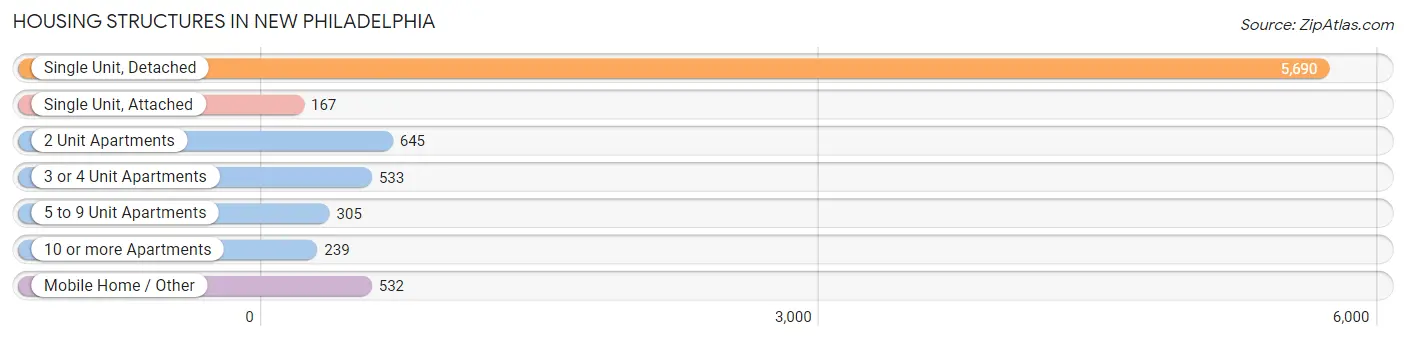
| Structure Type | # Housing Units | % Housing Units |
| Single Unit, Detached | 5,690 | 70.2% |
| Single Unit, Attached | 167 | 2.1% |
| 2 Unit Apartments | 645 | 8.0% |
| 3 or 4 Unit Apartments | 533 | 6.6% |
| 5 to 9 Unit Apartments | 305 | 3.8% |
| 10 or more Apartments | 239 | 2.9% |
| Mobile Home / Other | 532 | 6.6% |
| Total | 8,111 | 100.0% |
Housing Structures by Occupancy in New Philadelphia
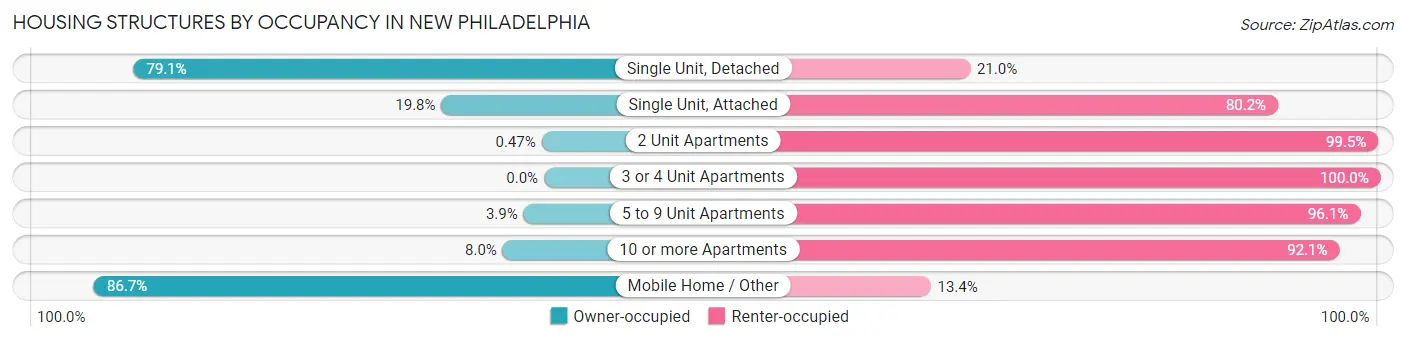
| Structure Type | Owner-occupied | Renter-occupied |
| Single Unit, Detached | 4,498 (79.0%) | 1,192 (20.9%) |
| Single Unit, Attached | 33 (19.8%) | 134 (80.2%) |
| 2 Unit Apartments | 3 (0.5%) | 642 (99.5%) |
| 3 or 4 Unit Apartments | 0 (0.0%) | 533 (100.0%) |
| 5 to 9 Unit Apartments | 12 (3.9%) | 293 (96.1%) |
| 10 or more Apartments | 19 (8.0%) | 220 (92.0%) |
| Mobile Home / Other | 461 (86.7%) | 71 (13.4%) |
| Total | 5,026 (62.0%) | 3,085 (38.0%) |
Housing Structures by Number of Rooms in New Philadelphia
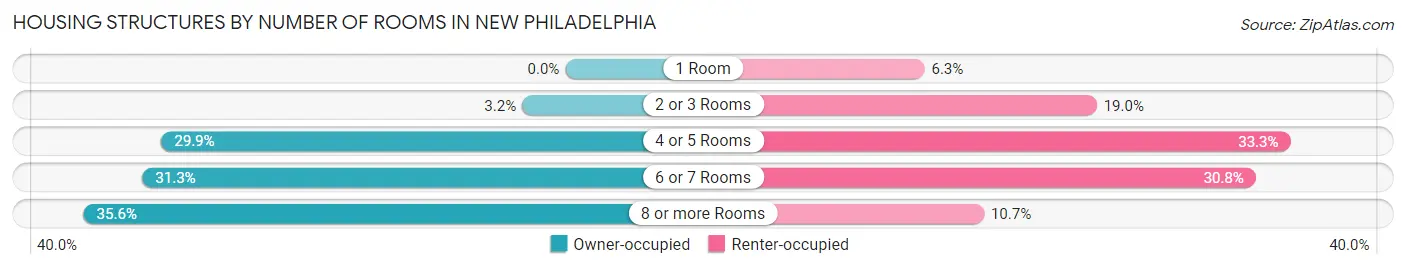
| Number of Rooms | Owner-occupied | Renter-occupied |
| 1 Room | 0 (0.0%) | 193 (6.3%) |
| 2 or 3 Rooms | 161 (3.2%) | 586 (19.0%) |
| 4 or 5 Rooms | 1,502 (29.9%) | 1,028 (33.3%) |
| 6 or 7 Rooms | 1,572 (31.3%) | 949 (30.8%) |
| 8 or more Rooms | 1,791 (35.6%) | 329 (10.7%) |
| Total | 5,026 (100.0%) | 3,085 (100.0%) |
Housing Structure by Heating Type in New Philadelphia
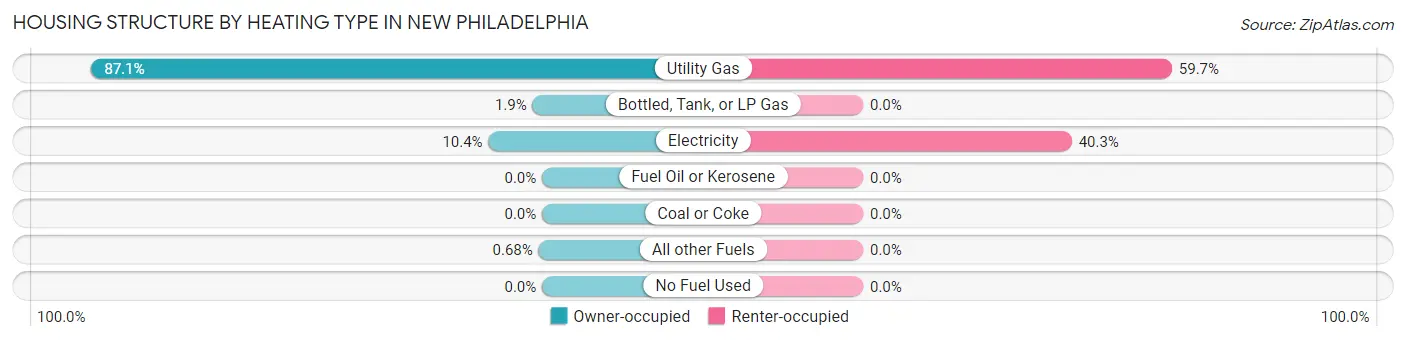
| Heating Type | Owner-occupied | Renter-occupied |
| Utility Gas | 4,378 (87.1%) | 1,841 (59.7%) |
| Bottled, Tank, or LP Gas | 93 (1.8%) | 0 (0.0%) |
| Electricity | 521 (10.4%) | 1,244 (40.3%) |
| Fuel Oil or Kerosene | 0 (0.0%) | 0 (0.0%) |
| Coal or Coke | 0 (0.0%) | 0 (0.0%) |
| All other Fuels | 34 (0.7%) | 0 (0.0%) |
| No Fuel Used | 0 (0.0%) | 0 (0.0%) |
| Total | 5,026 (100.0%) | 3,085 (100.0%) |
Household Vehicle Usage in New Philadelphia
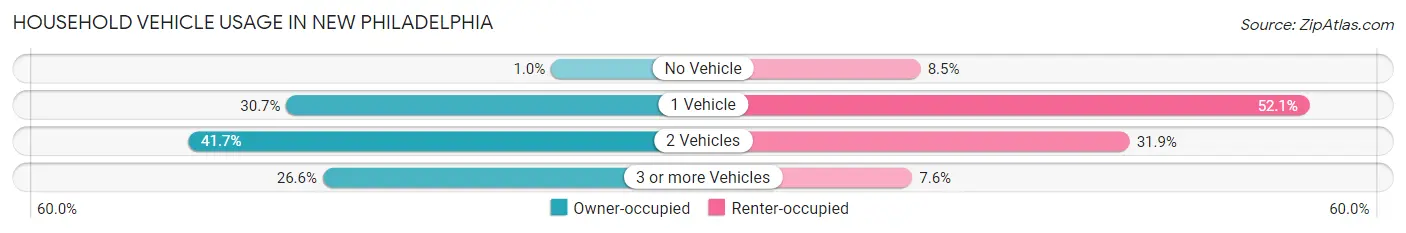
| Vehicles per Household | Owner-occupied | Renter-occupied |
| No Vehicle | 52 (1.0%) | 262 (8.5%) |
| 1 Vehicle | 1,542 (30.7%) | 1,606 (52.1%) |
| 2 Vehicles | 2,095 (41.7%) | 984 (31.9%) |
| 3 or more Vehicles | 1,337 (26.6%) | 233 (7.5%) |
| Total | 5,026 (100.0%) | 3,085 (100.0%) |
Real Estate & Mortgages in New Philadelphia
Real Estate and Mortgage Overview in New Philadelphia
| Characteristic | Without Mortgage | With Mortgage |
| Housing Units | 2,321 | 2,705 |
| Median Property Value | $139,600 | $171,100 |
| Median Household Income | $50,831 | $426 |
| Monthly Housing Costs | $492 | $12 |
| Real Estate Taxes | $1,670 | $75 |
Property Value by Mortgage Status in New Philadelphia
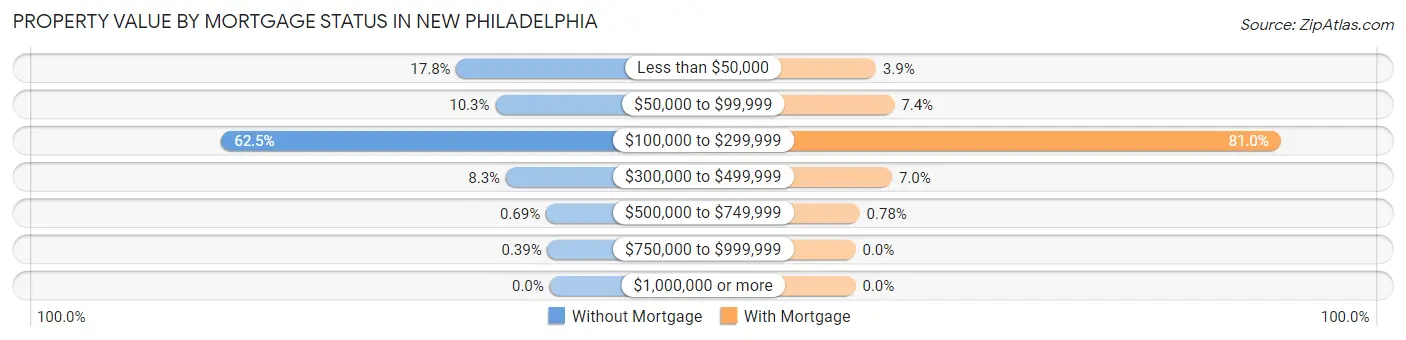
| Property Value | Without Mortgage | With Mortgage |
| Less than $50,000 | 412 (17.7%) | 105 (3.9%) |
| $50,000 to $99,999 | 240 (10.3%) | 200 (7.4%) |
| $100,000 to $299,999 | 1,451 (62.5%) | 2,191 (81.0%) |
| $300,000 to $499,999 | 193 (8.3%) | 188 (7.0%) |
| $500,000 to $749,999 | 16 (0.7%) | 21 (0.8%) |
| $750,000 to $999,999 | 9 (0.4%) | 0 (0.0%) |
| $1,000,000 or more | 0 (0.0%) | 0 (0.0%) |
| Total | 2,321 (100.0%) | 2,705 (100.0%) |
Household Income by Mortgage Status in New Philadelphia
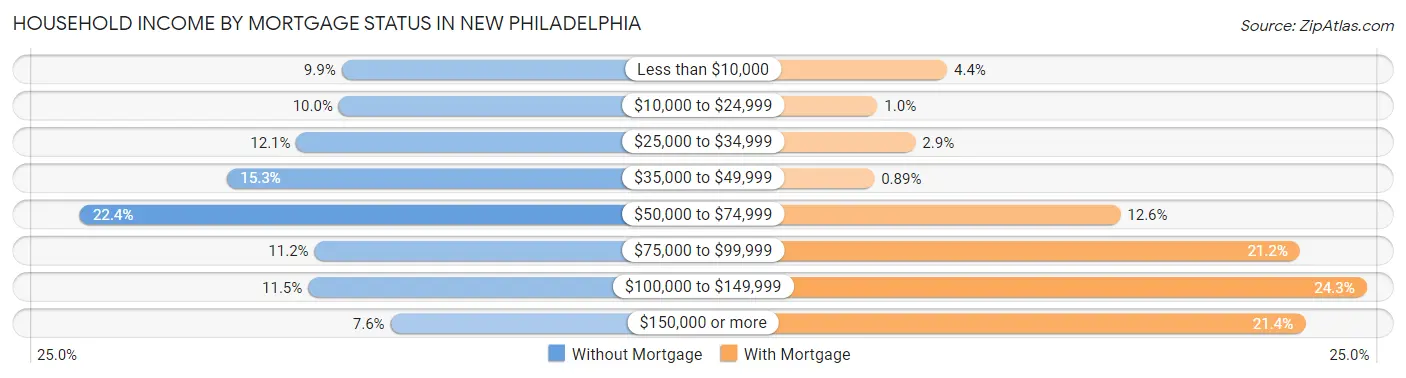
| Household Income | Without Mortgage | With Mortgage |
| Less than $10,000 | 230 (9.9%) | 118 (4.4%) |
| $10,000 to $24,999 | 233 (10.0%) | 28 (1.0%) |
| $25,000 to $34,999 | 280 (12.1%) | 77 (2.9%) |
| $35,000 to $49,999 | 356 (15.3%) | 24 (0.9%) |
| $50,000 to $74,999 | 519 (22.4%) | 341 (12.6%) |
| $75,000 to $99,999 | 260 (11.2%) | 572 (21.1%) |
| $100,000 to $149,999 | 267 (11.5%) | 658 (24.3%) |
| $150,000 or more | 176 (7.6%) | 579 (21.4%) |
| Total | 2,321 (100.0%) | 2,705 (100.0%) |
Property Value to Household Income Ratio in New Philadelphia
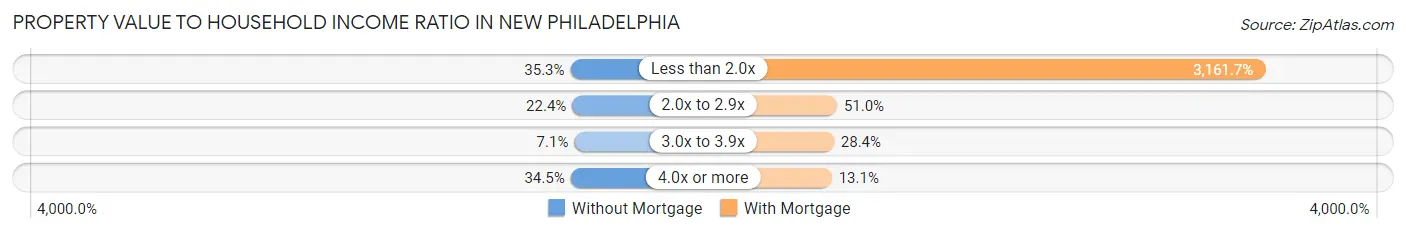
| Value-to-Income Ratio | Without Mortgage | With Mortgage |
| Less than 2.0x | 820 (35.3%) | 85,523 (3,161.7%) |
| 2.0x to 2.9x | 520 (22.4%) | 1,379 (51.0%) |
| 3.0x to 3.9x | 164 (7.1%) | 769 (28.4%) |
| 4.0x or more | 800 (34.5%) | 355 (13.1%) |
| Total | 2,321 (100.0%) | 2,705 (100.0%) |
Real Estate Taxes by Mortgage Status in New Philadelphia
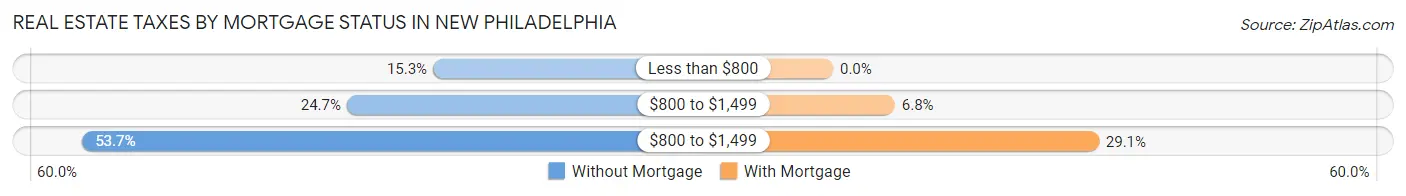
| Property Taxes | Without Mortgage | With Mortgage |
| Less than $800 | 354 (15.2%) | 0 (0.0%) |
| $800 to $1,499 | 573 (24.7%) | 183 (6.8%) |
| $800 to $1,499 | 1,246 (53.7%) | 788 (29.1%) |
| Total | 2,321 (100.0%) | 2,705 (100.0%) |
Health & Disability in New Philadelphia
Health Insurance Coverage by Age in New Philadelphia
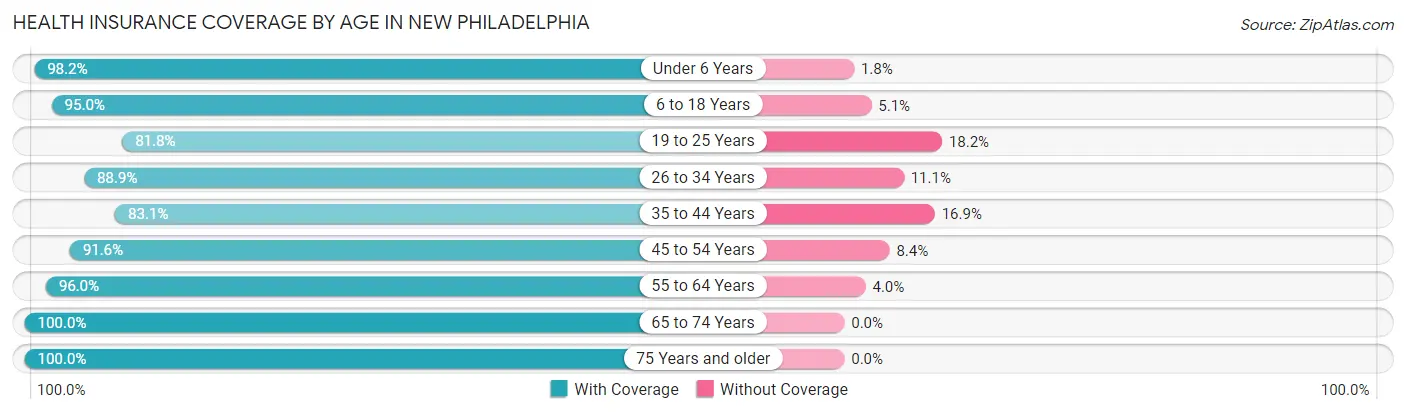
| Age Bracket | With Coverage | Without Coverage |
| Under 6 Years | 1,203 (98.2%) | 22 (1.8%) |
| 6 to 18 Years | 2,219 (95.0%) | 118 (5.1%) |
| 19 to 25 Years | 1,163 (81.8%) | 259 (18.2%) |
| 26 to 34 Years | 1,789 (88.9%) | 223 (11.1%) |
| 35 to 44 Years | 1,897 (83.1%) | 385 (16.9%) |
| 45 to 54 Years | 1,999 (91.6%) | 184 (8.4%) |
| 55 to 64 Years | 2,403 (96.0%) | 99 (4.0%) |
| 65 to 74 Years | 1,878 (100.0%) | 0 (0.0%) |
| 75 Years and older | 1,517 (100.0%) | 0 (0.0%) |
| Total | 16,068 (92.6%) | 1,290 (7.4%) |
Health Insurance Coverage by Citizenship Status in New Philadelphia
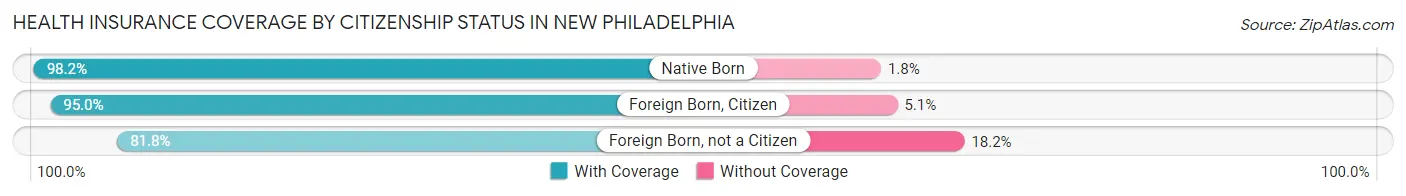
| Citizenship Status | With Coverage | Without Coverage |
| Native Born | 1,203 (98.2%) | 22 (1.8%) |
| Foreign Born, Citizen | 2,219 (95.0%) | 118 (5.1%) |
| Foreign Born, not a Citizen | 1,163 (81.8%) | 259 (18.2%) |
Health Insurance Coverage by Household Income in New Philadelphia
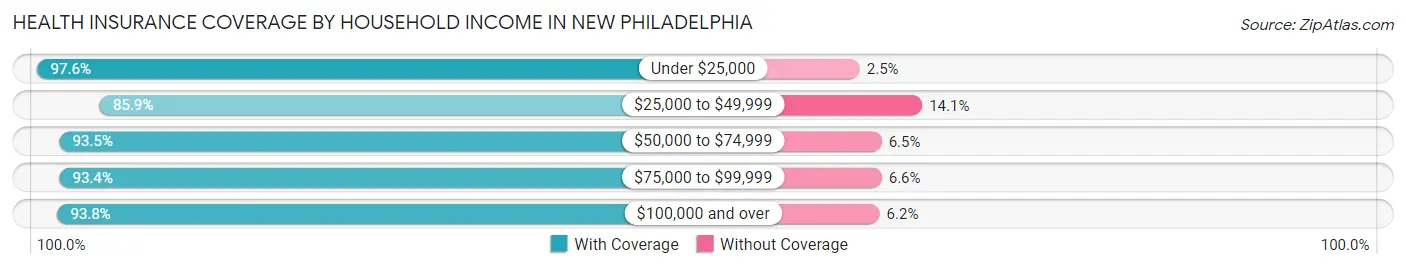
| Household Income | With Coverage | Without Coverage |
| Under $25,000 | 2,425 (97.6%) | 61 (2.5%) |
| $25,000 to $49,999 | 3,141 (85.9%) | 517 (14.1%) |
| $50,000 to $74,999 | 3,301 (93.5%) | 231 (6.5%) |
| $75,000 to $99,999 | 2,976 (93.4%) | 209 (6.6%) |
| $100,000 and over | 4,146 (93.8%) | 272 (6.2%) |
Public vs Private Health Insurance Coverage by Age in New Philadelphia
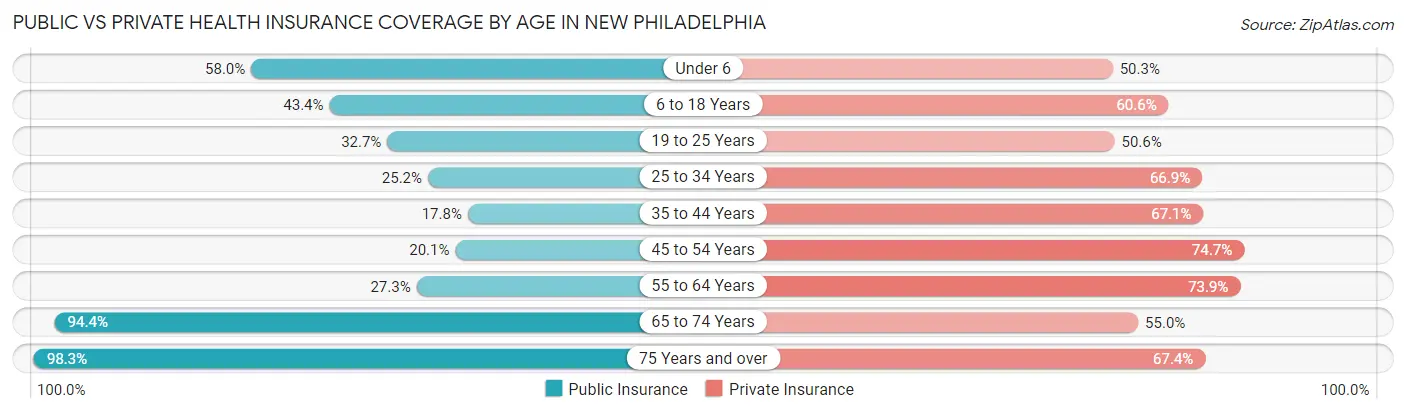
| Age Bracket | Public Insurance | Private Insurance |
| Under 6 | 710 (58.0%) | 616 (50.3%) |
| 6 to 18 Years | 1,015 (43.4%) | 1,417 (60.6%) |
| 19 to 25 Years | 465 (32.7%) | 720 (50.6%) |
| 25 to 34 Years | 506 (25.2%) | 1,345 (66.8%) |
| 35 to 44 Years | 405 (17.7%) | 1,531 (67.1%) |
| 45 to 54 Years | 438 (20.1%) | 1,630 (74.7%) |
| 55 to 64 Years | 682 (27.3%) | 1,850 (73.9%) |
| 65 to 74 Years | 1,773 (94.4%) | 1,033 (55.0%) |
| 75 Years and over | 1,491 (98.3%) | 1,023 (67.4%) |
| Total | 7,485 (43.1%) | 11,165 (64.3%) |
Disability Status by Sex by Age in New Philadelphia
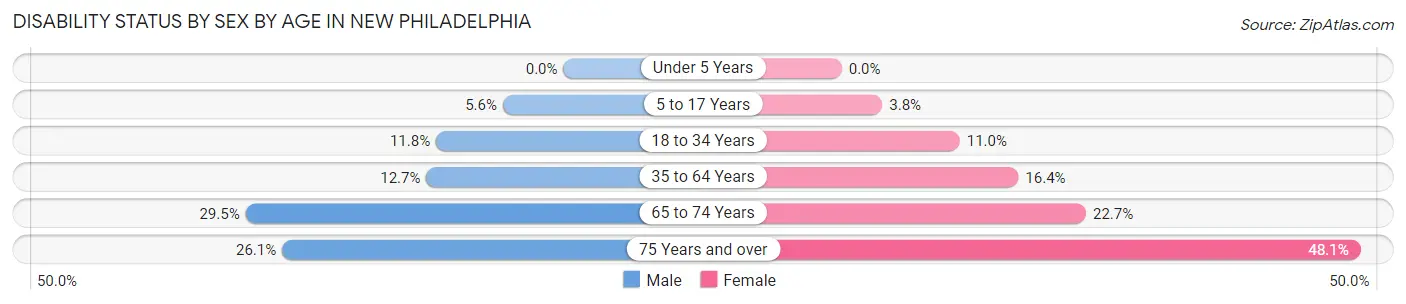
| Age Bracket | Male | Female |
| Under 5 Years | 0 (0.0%) | 0 (0.0%) |
| 5 to 17 Years | 76 (5.6%) | 39 (3.8%) |
| 18 to 34 Years | 230 (11.8%) | 177 (11.0%) |
| 35 to 64 Years | 482 (12.7%) | 521 (16.4%) |
| 65 to 74 Years | 269 (29.5%) | 219 (22.7%) |
| 75 Years and over | 164 (26.1%) | 428 (48.1%) |
Disability Class by Sex by Age in New Philadelphia
Disability Class: Hearing Difficulty
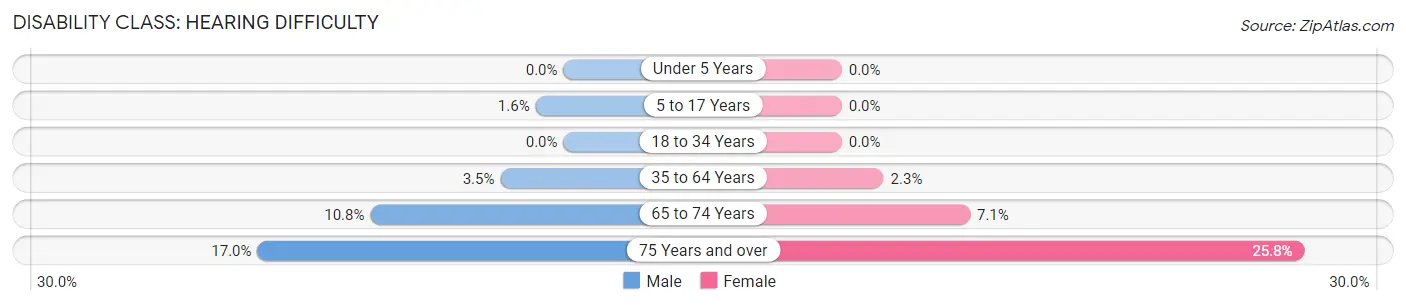
| Age Bracket | Male | Female |
| Under 5 Years | 0 (0.0%) | 0 (0.0%) |
| 5 to 17 Years | 21 (1.5%) | 0 (0.0%) |
| 18 to 34 Years | 0 (0.0%) | 0 (0.0%) |
| 35 to 64 Years | 133 (3.5%) | 74 (2.3%) |
| 65 to 74 Years | 98 (10.7%) | 69 (7.1%) |
| 75 Years and over | 107 (17.0%) | 229 (25.8%) |
Disability Class: Vision Difficulty
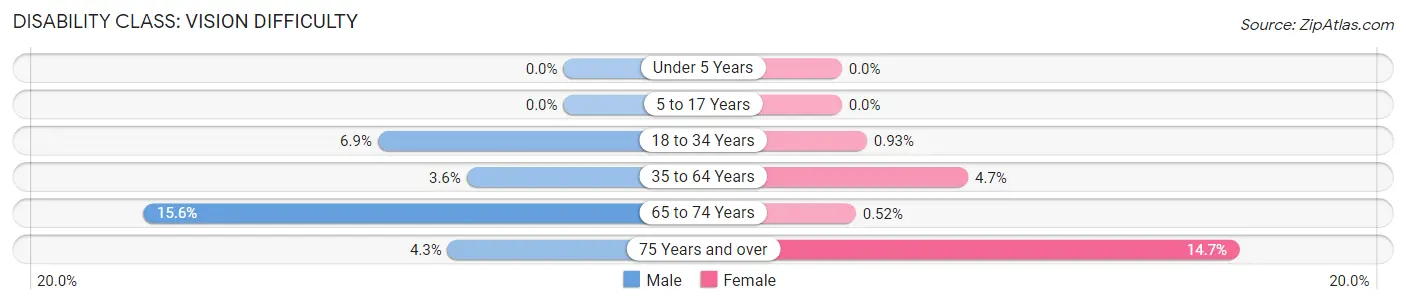
| Age Bracket | Male | Female |
| Under 5 Years | 0 (0.0%) | 0 (0.0%) |
| 5 to 17 Years | 0 (0.0%) | 0 (0.0%) |
| 18 to 34 Years | 134 (6.9%) | 15 (0.9%) |
| 35 to 64 Years | 136 (3.6%) | 149 (4.7%) |
| 65 to 74 Years | 142 (15.6%) | 5 (0.5%) |
| 75 Years and over | 27 (4.3%) | 131 (14.7%) |
Disability Class: Cognitive Difficulty
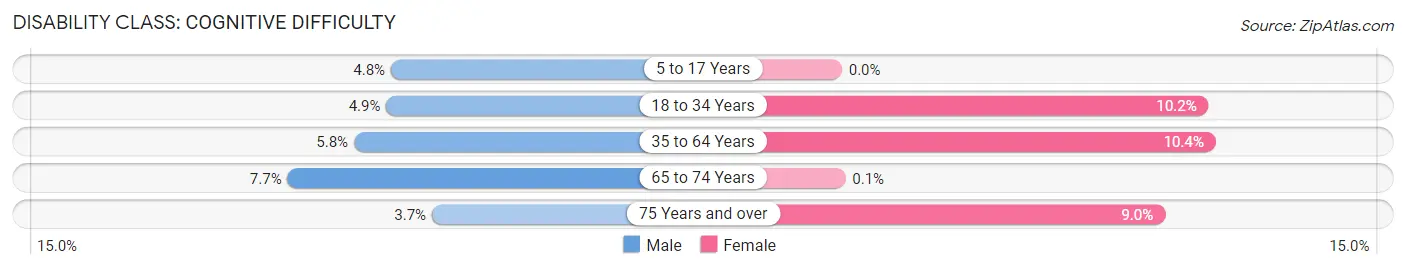
| Age Bracket | Male | Female |
| 5 to 17 Years | 65 (4.8%) | 0 (0.0%) |
| 18 to 34 Years | 96 (4.9%) | 165 (10.2%) |
| 35 to 64 Years | 221 (5.8%) | 331 (10.4%) |
| 65 to 74 Years | 70 (7.7%) | 1 (0.1%) |
| 75 Years and over | 23 (3.7%) | 80 (9.0%) |
Disability Class: Ambulatory Difficulty
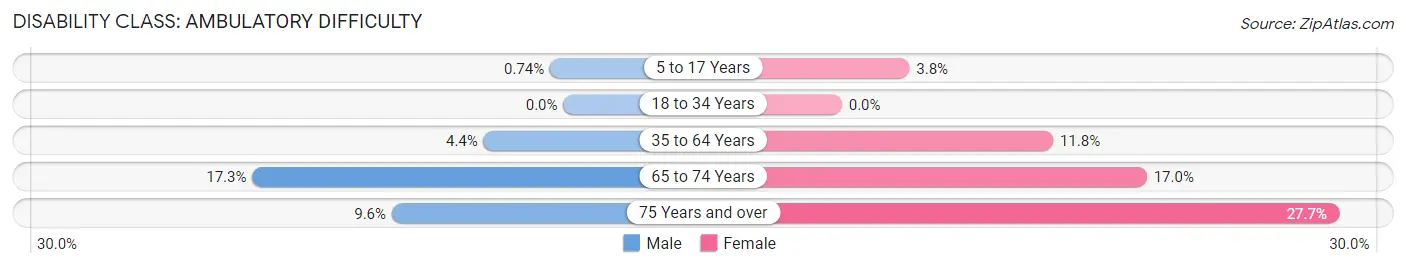
| Age Bracket | Male | Female |
| 5 to 17 Years | 10 (0.7%) | 39 (3.8%) |
| 18 to 34 Years | 0 (0.0%) | 0 (0.0%) |
| 35 to 64 Years | 168 (4.4%) | 374 (11.8%) |
| 65 to 74 Years | 158 (17.3%) | 164 (17.0%) |
| 75 Years and over | 60 (9.6%) | 246 (27.7%) |
Disability Class: Self-Care Difficulty
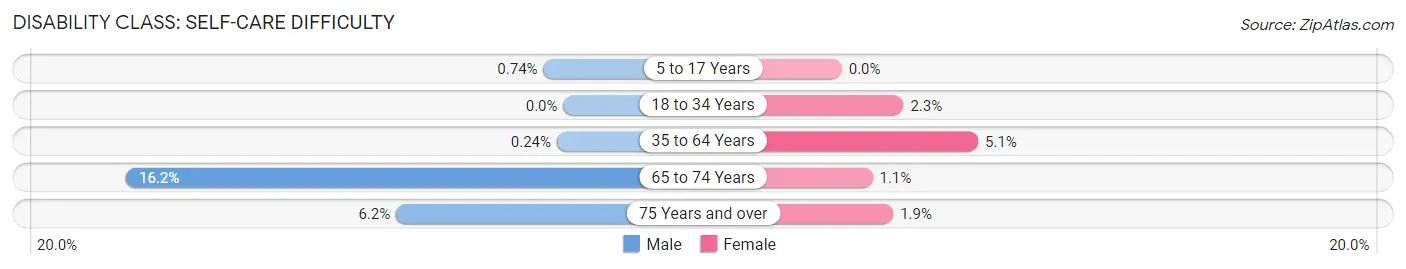
| Age Bracket | Male | Female |
| 5 to 17 Years | 10 (0.7%) | 0 (0.0%) |
| 18 to 34 Years | 0 (0.0%) | 37 (2.3%) |
| 35 to 64 Years | 9 (0.2%) | 161 (5.1%) |
| 65 to 74 Years | 148 (16.2%) | 11 (1.1%) |
| 75 Years and over | 39 (6.2%) | 17 (1.9%) |
Technology Access in New Philadelphia
Computing Device Access in New Philadelphia
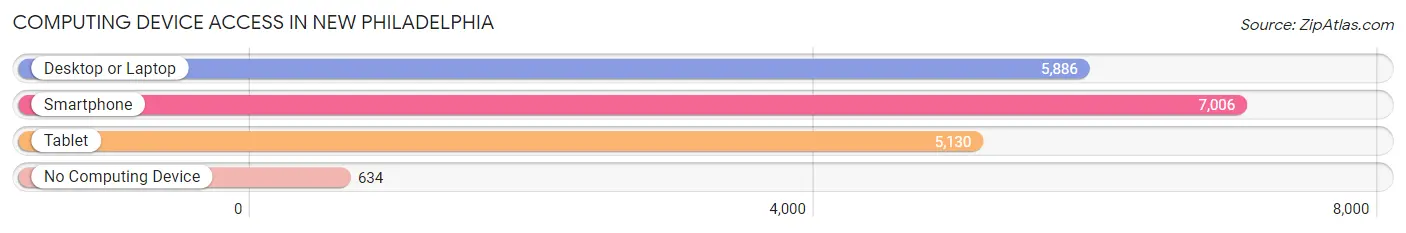
| Device Type | # Households | % Households |
| Desktop or Laptop | 5,886 | 72.6% |
| Smartphone | 7,006 | 86.4% |
| Tablet | 5,130 | 63.2% |
| No Computing Device | 634 | 7.8% |
| Total | 8,111 | 100.0% |
Internet Access in New Philadelphia
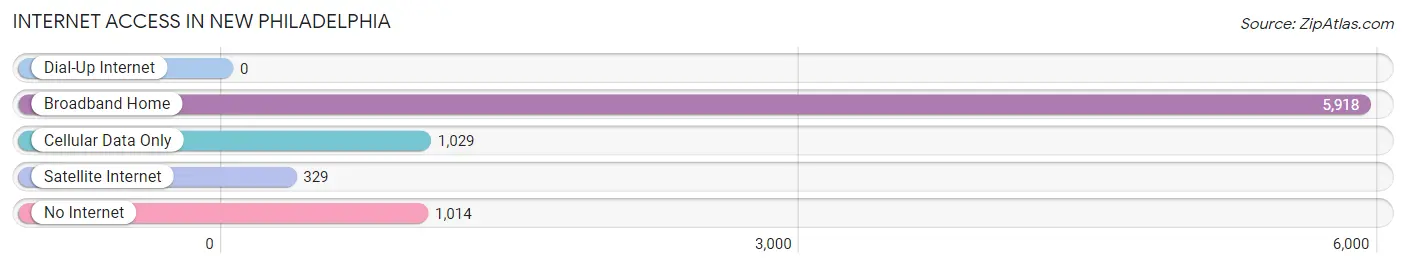
| Internet Type | # Households | % Households |
| Dial-Up Internet | 0 | 0.0% |
| Broadband Home | 5,918 | 73.0% |
| Cellular Data Only | 1,029 | 12.7% |
| Satellite Internet | 329 | 4.1% |
| No Internet | 1,014 | 12.5% |
| Total | 8,111 | 100.0% |
New Philadelphia Summary
New Philadelphia, Ohio is a city located in Tuscarawas County, Ohio, United States. It is the county seat of Tuscarawas County and is located along the Tuscarawas River. The population was 17,288 at the 2010 census.
History
New Philadelphia was founded in 1804 by John Knisely, a Revolutionary War veteran. The town was originally known as "Knisely's Town" and was later renamed "New Philadelphia" in 1808. The town was officially incorporated in 1833.
New Philadelphia was an important stop on the Underground Railroad, with many of the town's residents helping to hide and transport escaped slaves. The town was also home to the first public library in Ohio, which was established in 1817.
Geography
New Philadelphia is located at 40°27'17" North, 81°25'17" West (40.454722, -81.421389). According to the United States Census Bureau, the city has a total area of 8.2 square miles (21.2 km2), of which 8.1 square miles (21.0 km2) is land and 0.1 square miles (0.2 km2) is water.
Economy
New Philadelphia is home to a variety of businesses and industries. The city is home to several manufacturing companies, including the New Philadelphia Manufacturing Company, which produces a variety of products, including furniture, cabinets, and other wood products. The city is also home to several retail stores, including a Walmart Supercenter, a Lowe's Home Improvement store, and a variety of other stores.
Demographics
As of the census of 2010, there were 17,288 people, 7,093 households, and 4,541 families residing in the city. The population density was 2,128.3 people per square mile (821.7/km2). There were 7,717 housing units at an average density of 951.3 per square mile (367.3/km2). The racial makeup of the city was 94.2% White, 1.3% African American, 0.2% Native American, 0.7% Asian, 0.1% Pacific Islander, 1.3% from other races, and 2.3% from two or more races. Hispanic or Latino of any race were 3.2% of the population.
There were 7,093 households, out of which 28.7% had children under the age of 18 living with them, 46.2% were married couples living together, 13.3% had a female householder with no husband present, and 36.2% were non-families. 30.7% of all households were made up of individuals, and 13.2% had someone living alone who was 65 years of age or older. The average household size was 2.37 and the average family size was 2.94.
In the city, the population was spread out, with 23.2% under the age of 18, 8.3% from 18 to 24, 27.2% from 25 to 44, 24.2% from 45 to 64, and 17.1% who were 65 years of age or older. The median age was 38.7 years. For every 100 females, there were 91.2 males. For every 100 females age 18 and over, there were 87.7 males.
The median income for a household in the city was $37,845, and the median income for a family was $45,945. Males had a median income of $36,945 versus $25,945 for females. The per capita income for the city was $19,945. About 8.7% of families and 11.2% of the population were below the poverty line, including 15.2% of those under age 18 and 8.2% of those age 65 or over.
Common Questions
What is Per Capita Income in New Philadelphia?
Per Capita income in New Philadelphia is $32,665.
What is the Median Family Income in New Philadelphia?
Median Family Income in New Philadelphia is $67,051.
What is the Median Household income in New Philadelphia?
Median Household Income in New Philadelphia is $55,590.
What is Income or Wage Gap in New Philadelphia?
Income or Wage Gap in New Philadelphia is 25.7%.
Women in New Philadelphia earn 74.3 cents for every dollar earned by a man.
What is Family Income Deficit in New Philadelphia?
Family Income Deficit in New Philadelphia is $13,722.
Families that are below poverty line in New Philadelphia earn $13,722 less on average than the poverty threshold level.
What is Inequality or Gini Index in New Philadelphia?
Inequality or Gini Index in New Philadelphia is 0.43.
What is the Total Population of New Philadelphia?
Total Population of New Philadelphia is 17,602.
What is the Total Male Population of New Philadelphia?
Total Male Population of New Philadelphia is 9,384.
What is the Total Female Population of New Philadelphia?
Total Female Population of New Philadelphia is 8,218.
What is the Ratio of Males per 100 Females in New Philadelphia?
There are 114.19 Males per 100 Females in New Philadelphia.
What is the Ratio of Females per 100 Males in New Philadelphia?
There are 87.57 Females per 100 Males in New Philadelphia.
What is the Median Population Age in New Philadelphia?
Median Population Age in New Philadelphia is 42.8 Years.
What is the Average Family Size in New Philadelphia
Average Family Size in New Philadelphia is 2.6 People.
What is the Average Household Size in New Philadelphia
Average Household Size in New Philadelphia is 2.1 People.
How Large is the Labor Force in New Philadelphia?
There are 9,038 People in the Labor Forcein in New Philadelphia.
What is the Percentage of People in the Labor Force in New Philadelphia?
62.3% of People are in the Labor Force in New Philadelphia.
What is the Unemployment Rate in New Philadelphia?
Unemployment Rate in New Philadelphia is 3.1%.