Lowellville, OH Map & Demographics
Lowellville Map
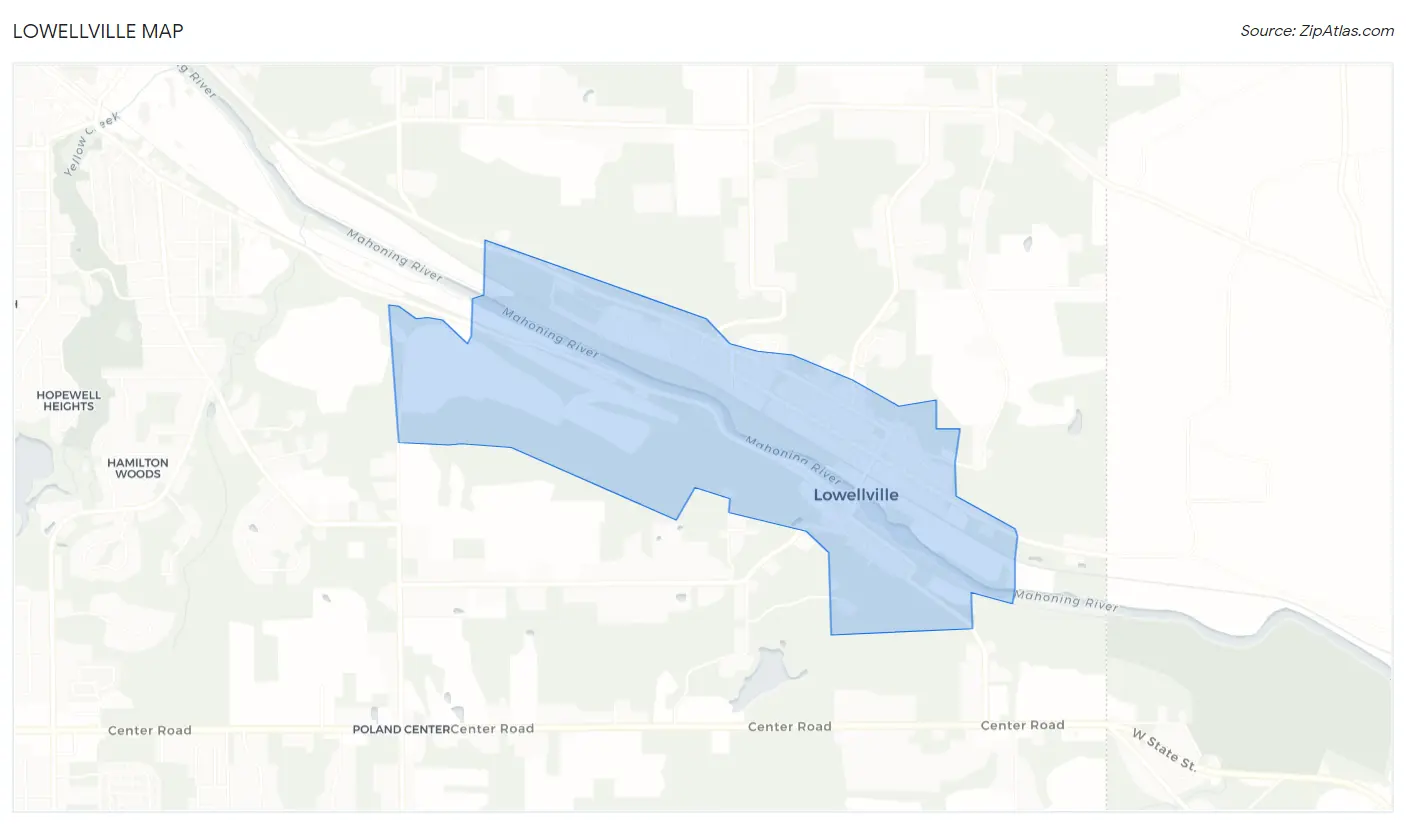
Lowellville Overview
$28,381
PER CAPITA INCOME
$58,750
AVG FAMILY INCOME
$51,458
AVG HOUSEHOLD INCOME
48.7%
WAGE / INCOME GAP [ % ]
51.3¢/ $1
WAGE / INCOME GAP [ $ ]
$18,810
FAMILY INCOME DEFICIT
0.40
INEQUALITY / GINI INDEX
1,102
TOTAL POPULATION
584
MALE POPULATION
518
FEMALE POPULATION
112.74
MALES / 100 FEMALES
88.70
FEMALES / 100 MALES
48.6
MEDIAN AGE
2.9
AVG FAMILY SIZE
2.2
AVG HOUSEHOLD SIZE
559
LABOR FORCE [ PEOPLE ]
57.0%
PERCENT IN LABOR FORCE
4.3%
UNEMPLOYMENT RATE
Lowellville Zip Codes
Income in Lowellville
Income Overview in Lowellville
Per Capita Income in Lowellville is $28,381, while median incomes of families and households are $58,750 and $51,458 respectively.
| Characteristic | Number | Measure |
| Per Capita Income | 1,102 | $28,381 |
| Median Family Income | 285 | $58,750 |
| Mean Family Income | 285 | $68,803 |
| Median Household Income | 489 | $51,458 |
| Mean Household Income | 489 | $59,131 |
| Income Deficit | 285 | $18,810 |
| Wage / Income Gap (%) | 1,102 | 48.72% |
| Wage / Income Gap ($) | 1,102 | 51.28¢ per $1 |
| Gini / Inequality Index | 1,102 | 0.40 |
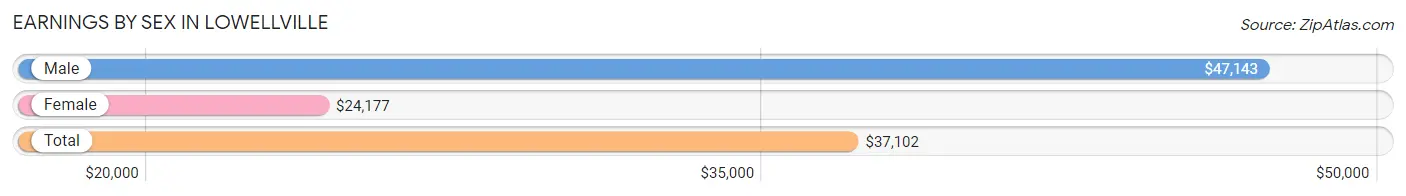
Earnings by Sex in Lowellville
Average Earnings in Lowellville are $37,102, $47,143 for men and $24,177 for women, a difference of 48.7%.
| Sex | Number | Average Earnings |
| Male | 300 (53.9%) | $47,143 |
| Female | 257 (46.1%) | $24,177 |
| Total | 557 (100.0%) | $37,102 |
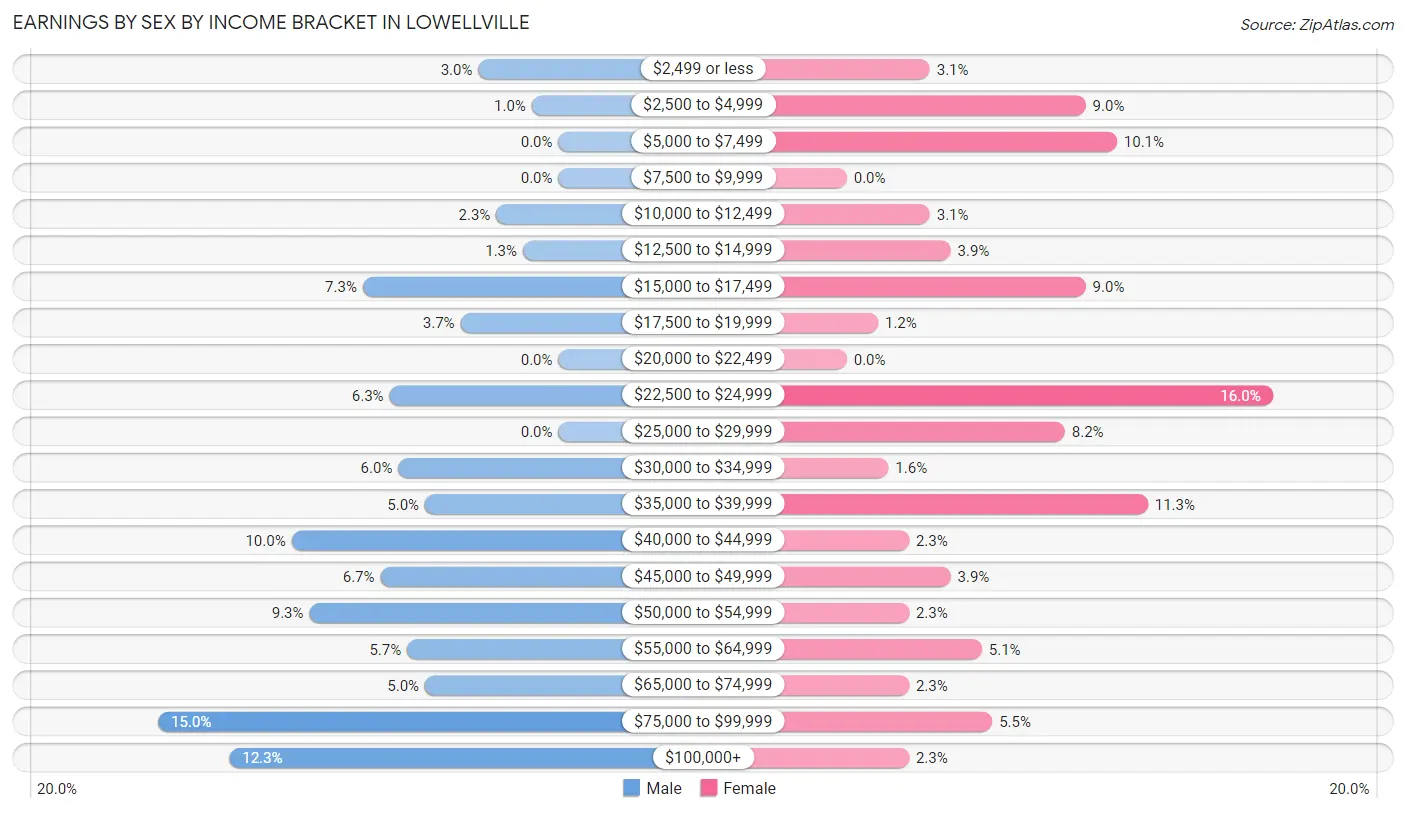
Earnings by Sex by Income Bracket in Lowellville
The most common earnings brackets in Lowellville are $75,000 to $99,999 for men (45 | 15.0%) and $22,500 to $24,999 for women (41 | 16.0%).
| Income | Male | Female |
| $2,499 or less | 9 (3.0%) | 8 (3.1%) |
| $2,500 to $4,999 | 3 (1.0%) | 23 (8.9%) |
| $5,000 to $7,499 | 0 (0.0%) | 26 (10.1%) |
| $7,500 to $9,999 | 0 (0.0%) | 0 (0.0%) |
| $10,000 to $12,499 | 7 (2.3%) | 8 (3.1%) |
| $12,500 to $14,999 | 4 (1.3%) | 10 (3.9%) |
| $15,000 to $17,499 | 22 (7.3%) | 23 (8.9%) |
| $17,500 to $19,999 | 11 (3.7%) | 3 (1.2%) |
| $20,000 to $22,499 | 0 (0.0%) | 0 (0.0%) |
| $22,500 to $24,999 | 19 (6.3%) | 41 (16.0%) |
| $25,000 to $29,999 | 0 (0.0%) | 21 (8.2%) |
| $30,000 to $34,999 | 18 (6.0%) | 4 (1.6%) |
| $35,000 to $39,999 | 15 (5.0%) | 29 (11.3%) |
| $40,000 to $44,999 | 30 (10.0%) | 6 (2.3%) |
| $45,000 to $49,999 | 20 (6.7%) | 10 (3.9%) |
| $50,000 to $54,999 | 28 (9.3%) | 6 (2.3%) |
| $55,000 to $64,999 | 17 (5.7%) | 13 (5.1%) |
| $65,000 to $74,999 | 15 (5.0%) | 6 (2.3%) |
| $75,000 to $99,999 | 45 (15.0%) | 14 (5.4%) |
| $100,000+ | 37 (12.3%) | 6 (2.3%) |
| Total | 300 (100.0%) | 257 (100.0%) |
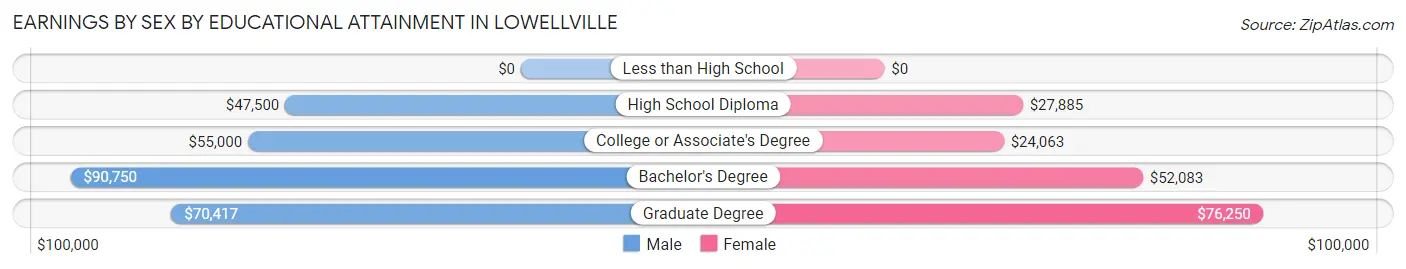
Earnings by Sex by Educational Attainment in Lowellville
Average earnings in Lowellville are $51,645 for men and $27,083 for women, a difference of 47.6%. Men with an educational attainment of bachelor's degree enjoy the highest average annual earnings of $90,750, while those with high school diploma education earn the least with $47,500. Women with an educational attainment of graduate degree earn the most with the average annual earnings of $76,250, while those with college or associate's degree education have the smallest earnings of $24,063.
| Educational Attainment | Male Income | Female Income |
| Less than High School | - | - |
| High School Diploma | $47,500 | $27,885 |
| College or Associate's Degree | $55,000 | $24,063 |
| Bachelor's Degree | $90,750 | $52,083 |
| Graduate Degree | $70,417 | $76,250 |
| Total | $51,645 | $27,083 |
Family Income in Lowellville
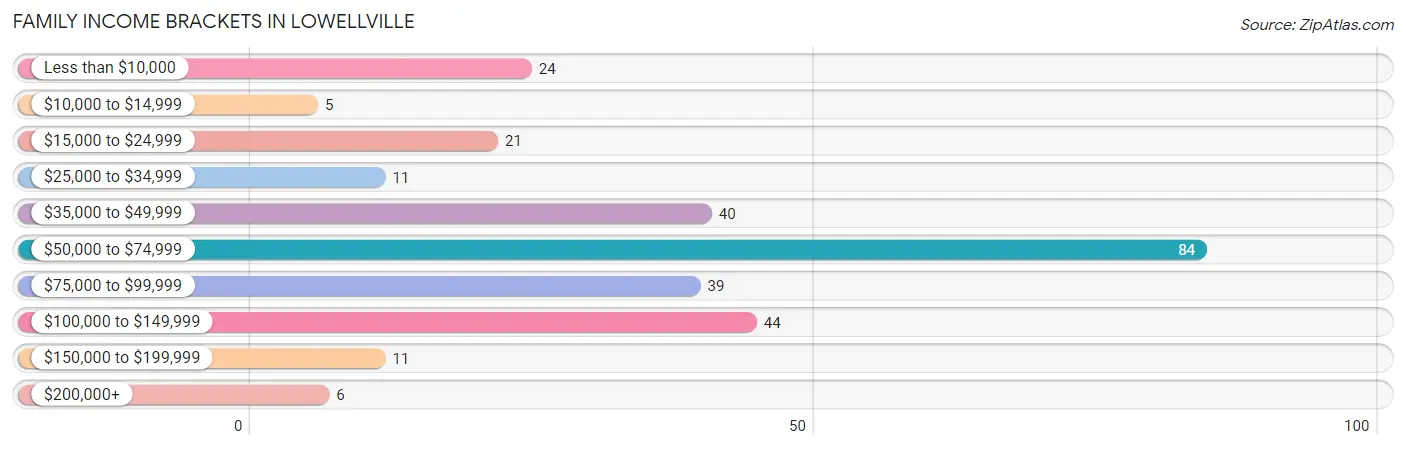
Family Income Brackets in Lowellville
According to the Lowellville family income data, there are 84 families falling into the $50,000 to $74,999 income range, which is the most common income bracket and makes up 29.5% of all families. Conversely, the $10,000 to $14,999 income bracket is the least frequent group with only 5 families (1.8%) belonging to this category.
| Income Bracket | # Families | % Families |
| Less than $10,000 | 24 | 8.4% |
| $10,000 to $14,999 | 5 | 1.8% |
| $15,000 to $24,999 | 21 | 7.4% |
| $25,000 to $34,999 | 11 | 3.9% |
| $35,000 to $49,999 | 40 | 14.0% |
| $50,000 to $74,999 | 84 | 29.5% |
| $75,000 to $99,999 | 39 | 13.7% |
| $100,000 to $149,999 | 44 | 15.4% |
| $150,000 to $199,999 | 11 | 3.9% |
| $200,000+ | 6 | 2.1% |
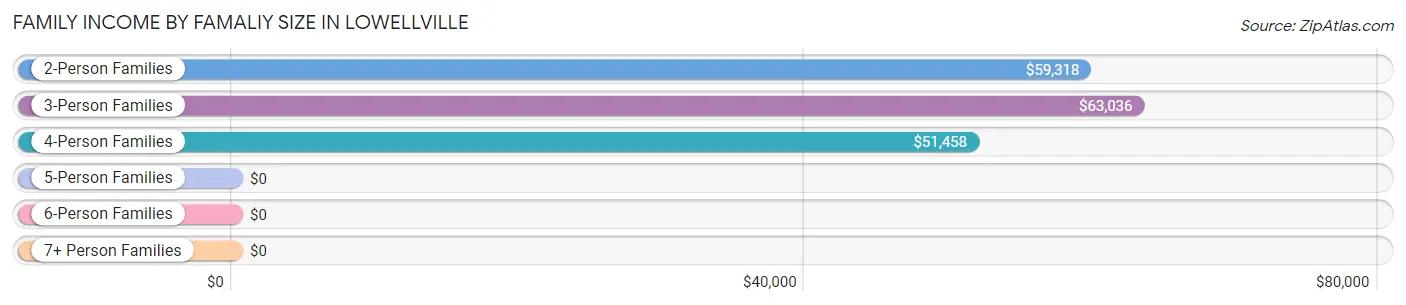
Family Income by Famaliy Size in Lowellville
3-person families (61 | 21.4%) account for the highest median family income in Lowellville with $63,036 per family, while 2-person families (174 | 61.1%) have the highest median income of $29,659 per family member.
| Income Bracket | # Families | Median Income |
| 2-Person Families | 174 (61.1%) | $59,318 |
| 3-Person Families | 61 (21.4%) | $63,036 |
| 4-Person Families | 34 (11.9%) | $51,458 |
| 5-Person Families | 13 (4.6%) | $0 |
| 6-Person Families | 0 (0.0%) | $0 |
| 7+ Person Families | 3 (1.1%) | $0 |
| Total | 285 (100.0%) | $58,750 |
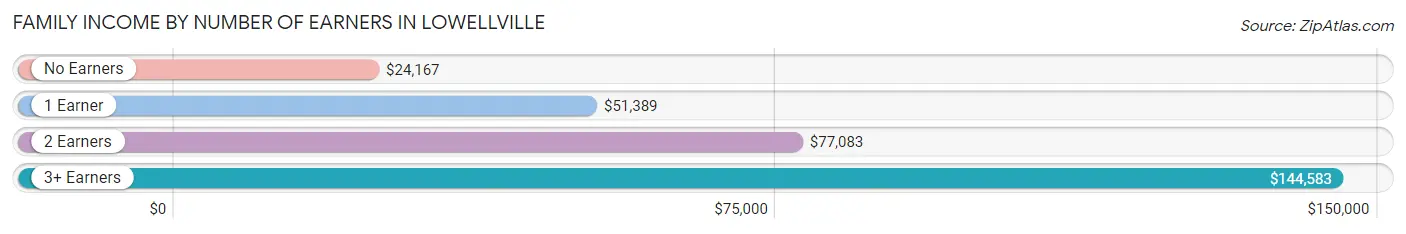
Family Income by Number of Earners in Lowellville
The median family income in Lowellville is $58,750, with families comprising 3+ earners (22) having the highest median family income of $144,583, while families with no earners (60) have the lowest median family income of $24,167, accounting for 7.7% and 21.0% of families, respectively.
| Number of Earners | # Families | Median Income |
| No Earners | 60 (21.0%) | $24,167 |
| 1 Earner | 96 (33.7%) | $51,389 |
| 2 Earners | 107 (37.5%) | $77,083 |
| 3+ Earners | 22 (7.7%) | $144,583 |
| Total | 285 (100.0%) | $58,750 |
Household Income in Lowellville
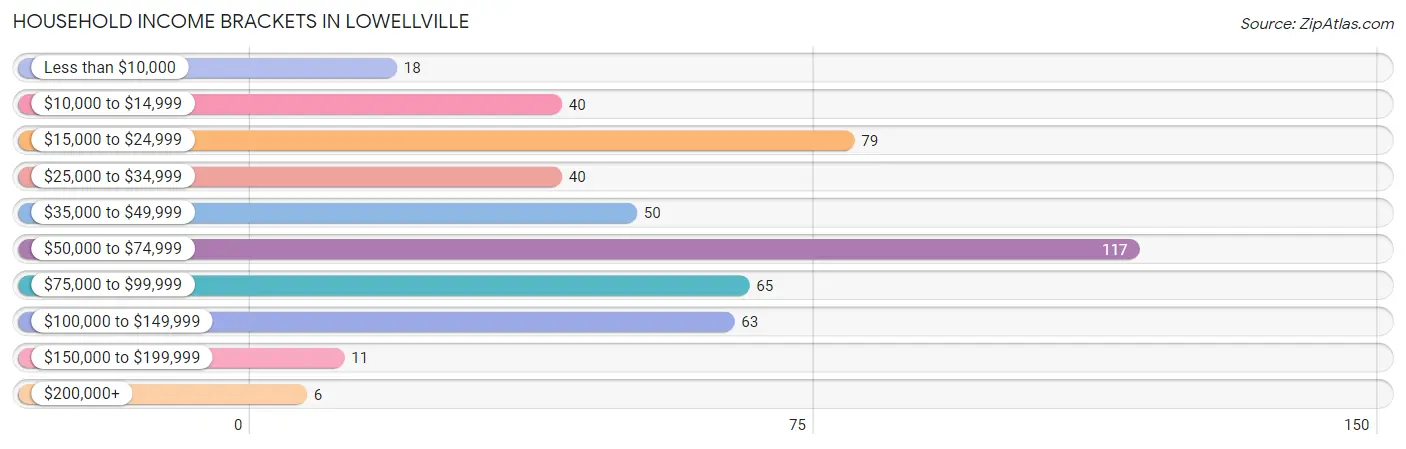
Household Income Brackets in Lowellville
With 117 households falling in the category, the $50,000 to $74,999 income range is the most frequent in Lowellville, accounting for 23.9% of all households. In contrast, only 6 households (1.2%) fall into the $200,000+ income bracket, making it the least populous group.
| Income Bracket | # Households | % Households |
| Less than $10,000 | 18 | 3.7% |
| $10,000 to $14,999 | 40 | 8.2% |
| $15,000 to $24,999 | 79 | 16.2% |
| $25,000 to $34,999 | 40 | 8.2% |
| $35,000 to $49,999 | 50 | 10.2% |
| $50,000 to $74,999 | 117 | 23.9% |
| $75,000 to $99,999 | 65 | 13.3% |
| $100,000 to $149,999 | 63 | 12.9% |
| $150,000 to $199,999 | 11 | 2.2% |
| $200,000+ | 6 | 1.2% |
Household Income by Householder Age in Lowellville
The median household income in Lowellville is $51,458, with the highest median household income of $71,429 found in the 25 to 44 years age bracket for the primary householder. A total of 96 households (19.6%) fall into this category. Meanwhile, the 15 to 24 years age bracket for the primary householder has the lowest median household income of $0, with 10 households (2.0%) in this group.
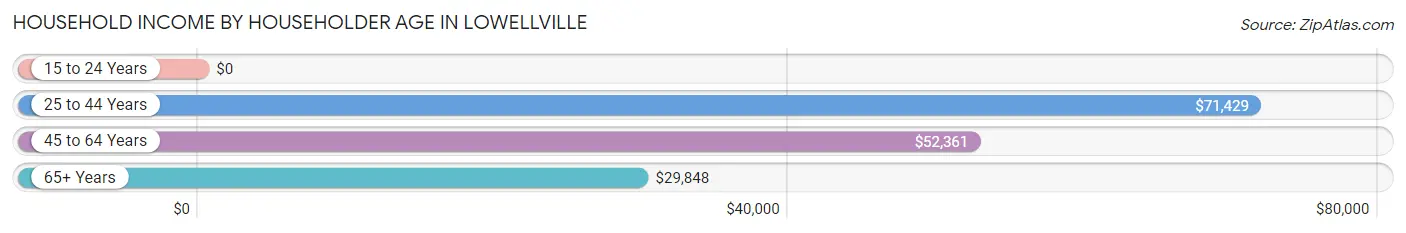
| Income Bracket | # Households | Median Income |
| 15 to 24 Years | 10 (2.0%) | $0 |
| 25 to 44 Years | 96 (19.6%) | $71,429 |
| 45 to 64 Years | 205 (41.9%) | $52,361 |
| 65+ Years | 178 (36.4%) | $29,848 |
| Total | 489 (100.0%) | $51,458 |
Poverty in Lowellville
Income Below Poverty by Sex and Age in Lowellville
With 18.1% poverty level for males and 23.1% for females among the residents of Lowellville, under 5 year old males and under 5 year old females are the most vulnerable to poverty, with 21 males (72.4%) and 9 females (56.2%) in their respective age groups living below the poverty level.
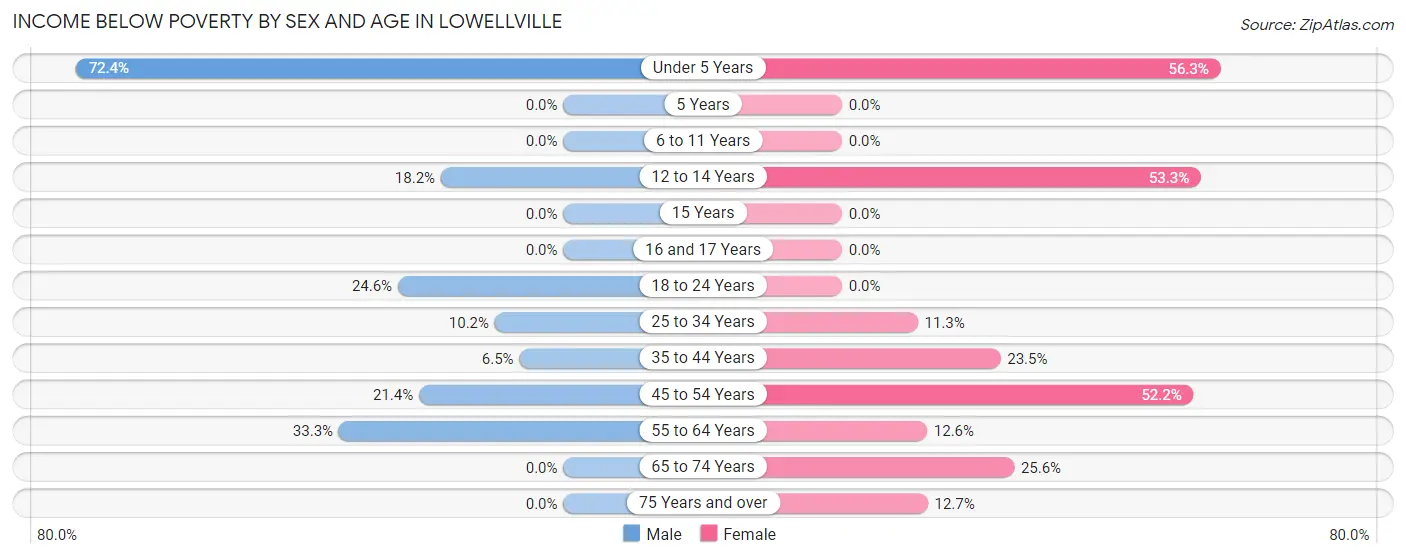
| Age Bracket | Male | Female |
| Under 5 Years | 21 (72.4%) | 9 (56.2%) |
| 5 Years | 0 (0.0%) | 0 (0.0%) |
| 6 to 11 Years | 0 (0.0%) | 0 (0.0%) |
| 12 to 14 Years | 4 (18.2%) | 8 (53.3%) |
| 15 Years | 0 (0.0%) | 0 (0.0%) |
| 16 and 17 Years | 0 (0.0%) | 0 (0.0%) |
| 18 to 24 Years | 14 (24.6%) | 0 (0.0%) |
| 25 to 34 Years | 12 (10.2%) | 9 (11.3%) |
| 35 to 44 Years | 3 (6.5%) | 4 (23.5%) |
| 45 to 54 Years | 18 (21.4%) | 47 (52.2%) |
| 55 to 64 Years | 33 (33.3%) | 12 (12.6%) |
| 65 to 74 Years | 0 (0.0%) | 23 (25.6%) |
| 75 Years and over | 0 (0.0%) | 7 (12.7%) |
| Total | 105 (18.1%) | 119 (23.1%) |
Income Above Poverty by Sex and Age in Lowellville
According to the poverty statistics in Lowellville, males aged 5 years and females aged 6 to 11 years are the age groups that are most secure financially, with 100.0% of males and 100.0% of females in these age groups living above the poverty line.
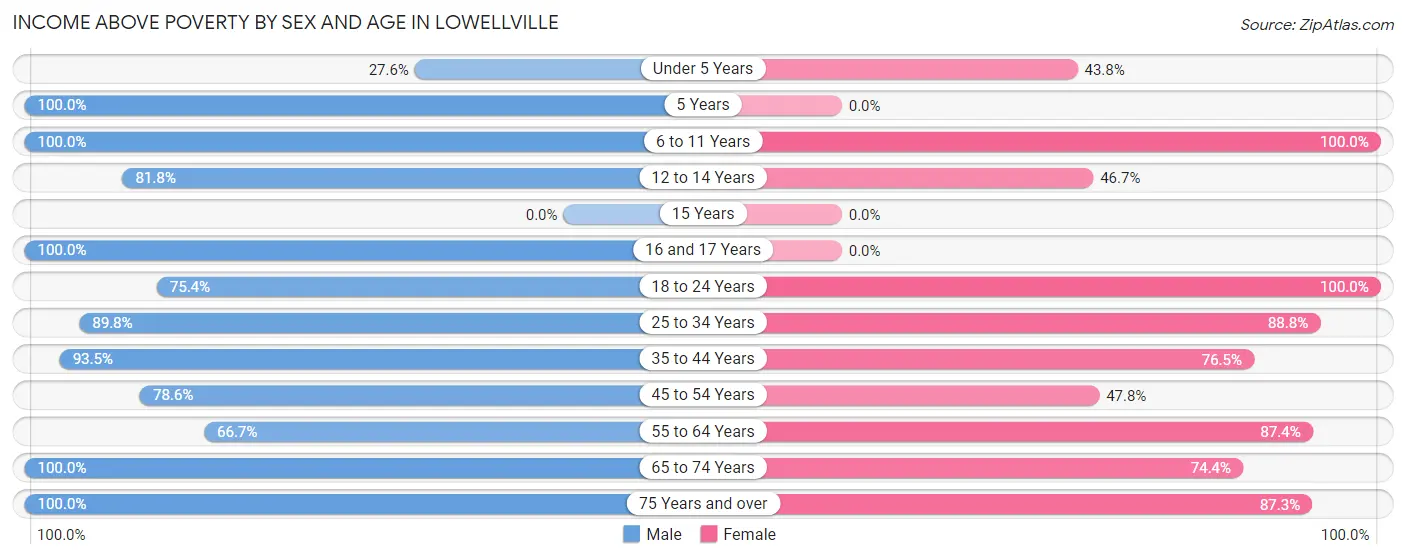
| Age Bracket | Male | Female |
| Under 5 Years | 8 (27.6%) | 7 (43.8%) |
| 5 Years | 6 (100.0%) | 0 (0.0%) |
| 6 to 11 Years | 9 (100.0%) | 20 (100.0%) |
| 12 to 14 Years | 18 (81.8%) | 7 (46.7%) |
| 15 Years | 0 (0.0%) | 0 (0.0%) |
| 16 and 17 Years | 9 (100.0%) | 0 (0.0%) |
| 18 to 24 Years | 43 (75.4%) | 38 (100.0%) |
| 25 to 34 Years | 106 (89.8%) | 71 (88.7%) |
| 35 to 44 Years | 43 (93.5%) | 13 (76.5%) |
| 45 to 54 Years | 66 (78.6%) | 43 (47.8%) |
| 55 to 64 Years | 66 (66.7%) | 83 (87.4%) |
| 65 to 74 Years | 55 (100.0%) | 67 (74.4%) |
| 75 Years and over | 47 (100.0%) | 48 (87.3%) |
| Total | 476 (81.9%) | 397 (76.9%) |
Income Below Poverty Among Married-Couple Families in Lowellville
The poverty statistics for married-couple families in Lowellville show that 13.0% or 22 of the total 169 families live below the poverty line. Families with 1 or 2 children have the highest poverty rate of 27.6%, comprising of 8 families. On the other hand, families with 5 or more children have the lowest poverty rate of 0.0%, which includes 0 families.
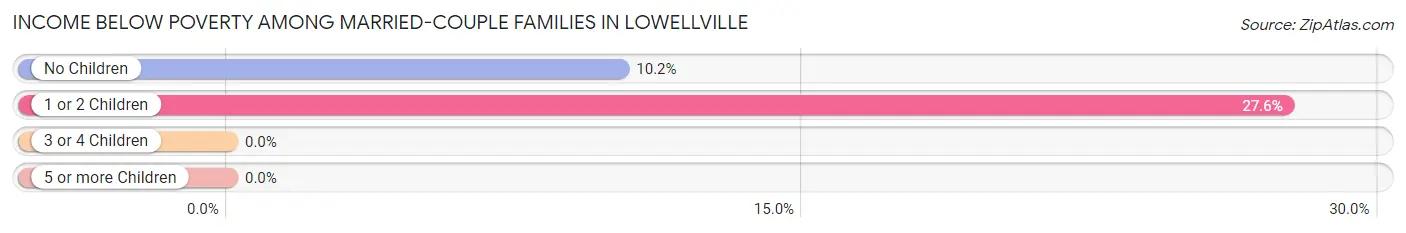
| Children | Above Poverty | Below Poverty |
| No Children | 123 (89.8%) | 14 (10.2%) |
| 1 or 2 Children | 21 (72.4%) | 8 (27.6%) |
| 3 or 4 Children | 0 (0.0%) | 0 (0.0%) |
| 5 or more Children | 3 (100.0%) | 0 (0.0%) |
| Total | 147 (87.0%) | 22 (13.0%) |
Income Below Poverty Among Single-Parent Households in Lowellville
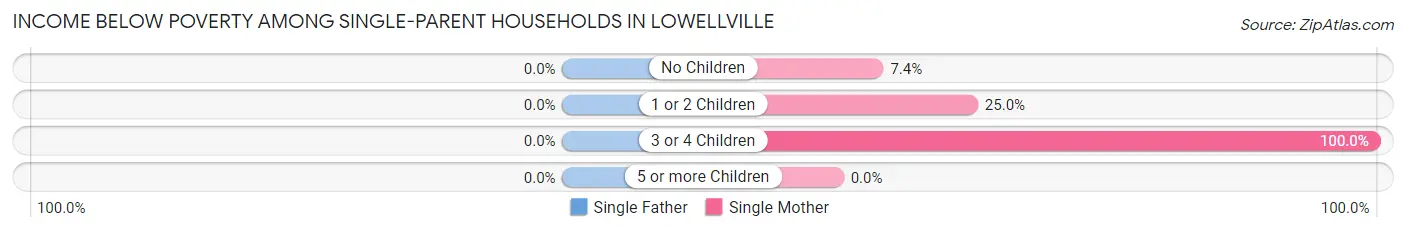
| Children | Single Father | Single Mother |
| No Children | 0 (0.0%) | 4 (7.4%) |
| 1 or 2 Children | 0 (0.0%) | 5 (25.0%) |
| 3 or 4 Children | 0 (0.0%) | 10 (100.0%) |
| 5 or more Children | 0 (0.0%) | 0 (0.0%) |
| Total | 0 (0.0%) | 19 (22.6%) |
Income Below Poverty Among Married-Couple vs Single-Parent Households in Lowellville
The poverty data for Lowellville shows that 22 of the married-couple family households (13.0%) and 19 of the single-parent households (16.4%) are living below the poverty level. Within the married-couple family households, those with 1 or 2 children have the highest poverty rate, with 8 households (27.6%) falling below the poverty line. Among the single-parent households, those with 3 or 4 children have the highest poverty rate, with 10 household (100.0%) living below poverty.
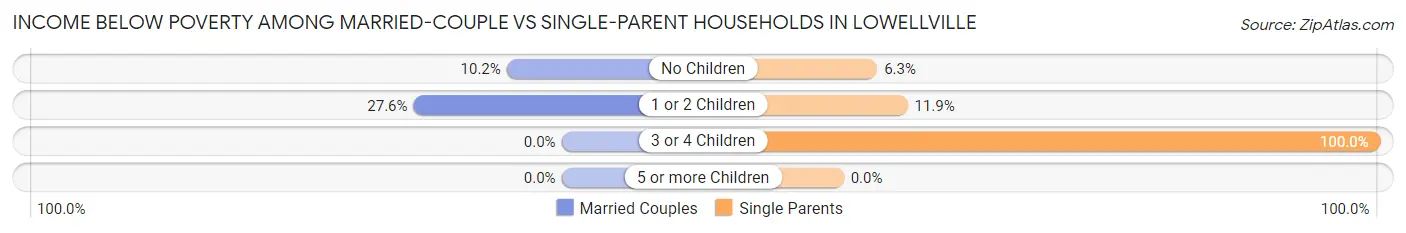
| Children | Married-Couple Families | Single-Parent Households |
| No Children | 14 (10.2%) | 4 (6.2%) |
| 1 or 2 Children | 8 (27.6%) | 5 (11.9%) |
| 3 or 4 Children | 0 (0.0%) | 10 (100.0%) |
| 5 or more Children | 0 (0.0%) | 0 (0.0%) |
| Total | 22 (13.0%) | 19 (16.4%) |
Race in Lowellville
The most populous races in Lowellville are White / Caucasian (1,056 | 95.8%), Hispanic or Latino (34 | 3.1%), and Two or more Races (22 | 2.0%).
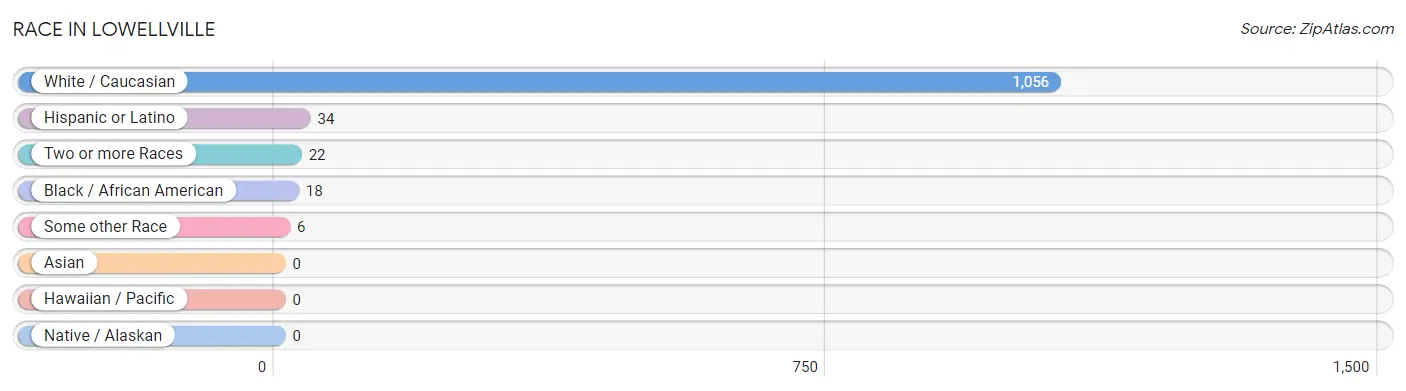
| Race | # Population | % Population |
| Asian | 0 | 0.0% |
| Black / African American | 18 | 1.6% |
| Hawaiian / Pacific | 0 | 0.0% |
| Hispanic or Latino | 34 | 3.1% |
| Native / Alaskan | 0 | 0.0% |
| White / Caucasian | 1,056 | 95.8% |
| Two or more Races | 22 | 2.0% |
| Some other Race | 6 | 0.5% |
| Total | 1,102 | 100.0% |
Ancestry in Lowellville
The most populous ancestries reported in Lowellville are Italian (335 | 30.4%), Irish (173 | 15.7%), English (128 | 11.6%), German (128 | 11.6%), and French (90 | 8.2%), together accounting for 77.5% of all Lowellville residents.
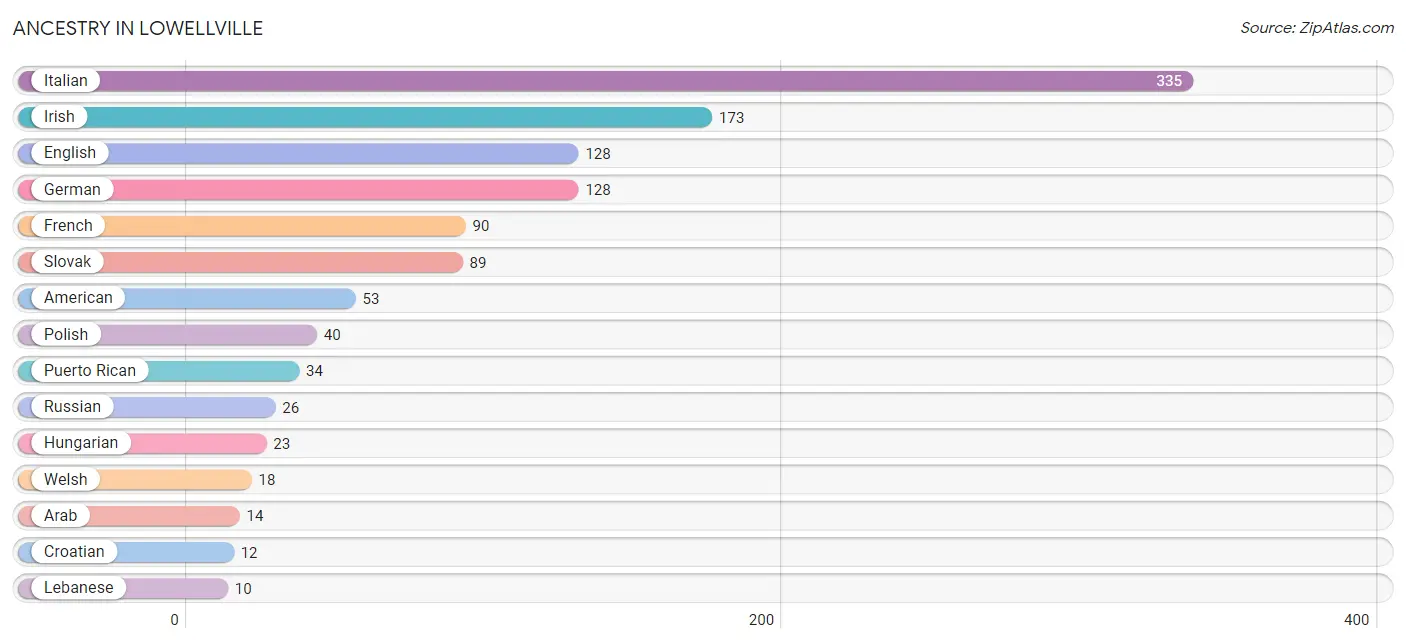
| Ancestry | # Population | % Population |
| American | 53 | 4.8% |
| Arab | 14 | 1.3% |
| British | 8 | 0.7% |
| Croatian | 12 | 1.1% |
| English | 128 | 11.6% |
| European | 6 | 0.5% |
| French | 90 | 8.2% |
| German | 128 | 11.6% |
| Hungarian | 23 | 2.1% |
| Irish | 173 | 15.7% |
| Italian | 335 | 30.4% |
| Lebanese | 10 | 0.9% |
| Norwegian | 3 | 0.3% |
| Polish | 40 | 3.6% |
| Puerto Rican | 34 | 3.1% |
| Romanian | 6 | 0.5% |
| Russian | 26 | 2.4% |
| Slovak | 89 | 8.1% |
| Slovene | 8 | 0.7% |
| Syrian | 4 | 0.4% |
| Welsh | 18 | 1.6% | View All 21 Rows |
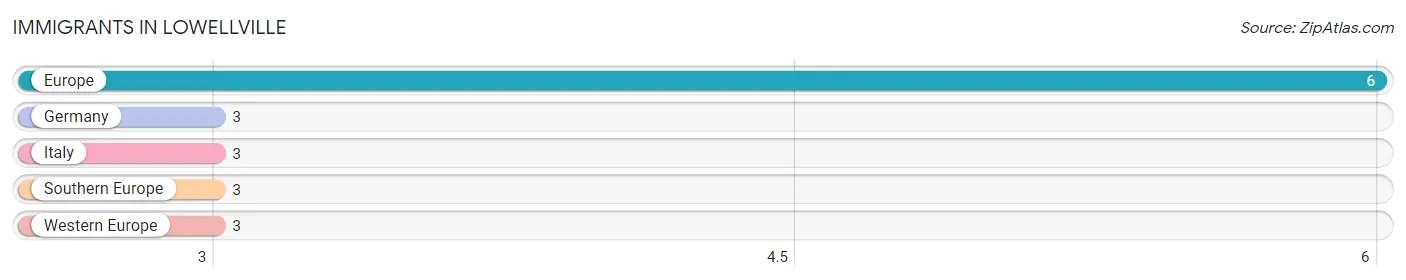
Immigrants in Lowellville
The most numerous immigrant groups reported in Lowellville came from Europe (6 | 0.5%), Germany (3 | 0.3%), Italy (3 | 0.3%), Southern Europe (3 | 0.3%), and Western Europe (3 | 0.3%), together accounting for 1.6% of all Lowellville residents.
| Immigration Origin | # Population | % Population |
| Europe | 6 | 0.5% |
| Germany | 3 | 0.3% |
| Italy | 3 | 0.3% |
| Southern Europe | 3 | 0.3% |
| Western Europe | 3 | 0.3% | View All 5 Rows |
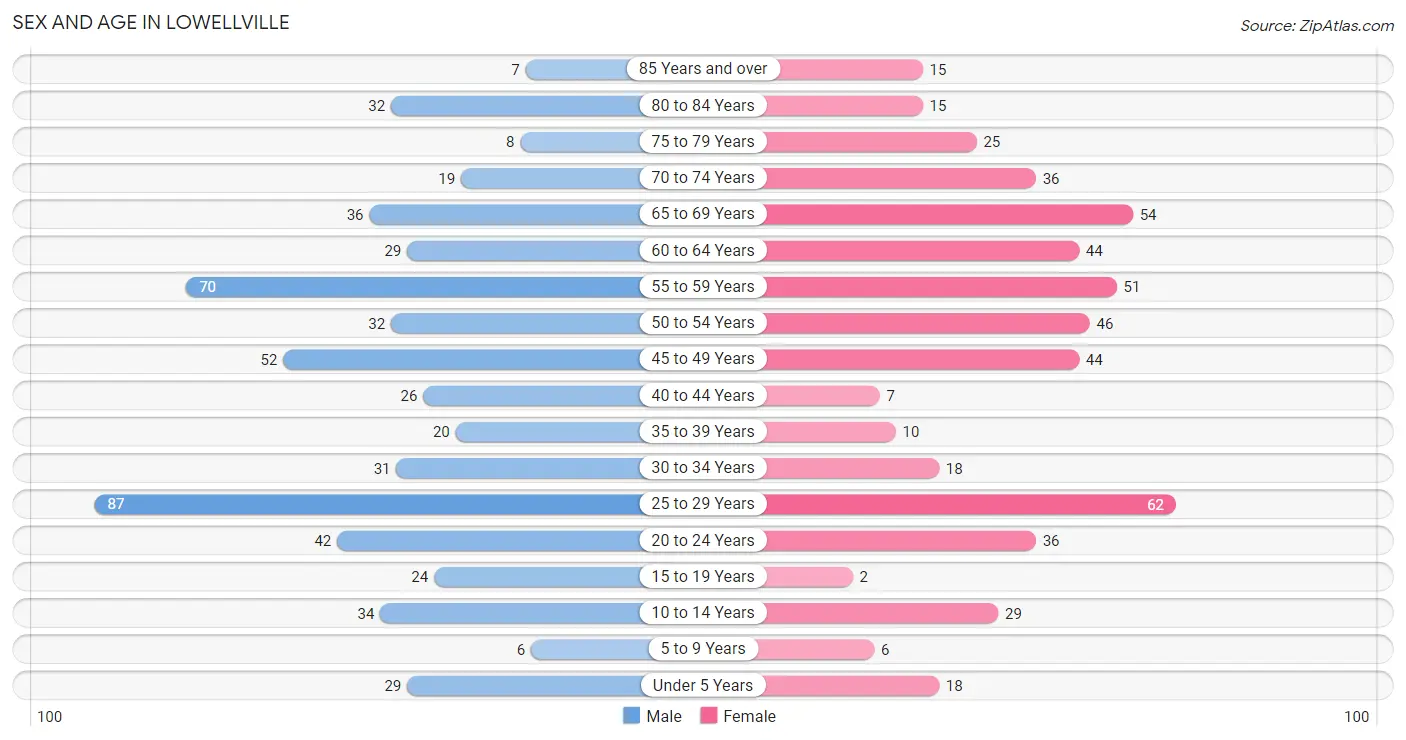
Sex and Age in Lowellville
Sex and Age in Lowellville
The most populous age groups in Lowellville are 25 to 29 Years (87 | 14.9%) for men and 25 to 29 Years (62 | 12.0%) for women.
| Age Bracket | Male | Female |
| Under 5 Years | 29 (5.0%) | 18 (3.5%) |
| 5 to 9 Years | 6 (1.0%) | 6 (1.2%) |
| 10 to 14 Years | 34 (5.8%) | 29 (5.6%) |
| 15 to 19 Years | 24 (4.1%) | 2 (0.4%) |
| 20 to 24 Years | 42 (7.2%) | 36 (7.0%) |
| 25 to 29 Years | 87 (14.9%) | 62 (12.0%) |
| 30 to 34 Years | 31 (5.3%) | 18 (3.5%) |
| 35 to 39 Years | 20 (3.4%) | 10 (1.9%) |
| 40 to 44 Years | 26 (4.4%) | 7 (1.3%) |
| 45 to 49 Years | 52 (8.9%) | 44 (8.5%) |
| 50 to 54 Years | 32 (5.5%) | 46 (8.9%) |
| 55 to 59 Years | 70 (12.0%) | 51 (9.9%) |
| 60 to 64 Years | 29 (5.0%) | 44 (8.5%) |
| 65 to 69 Years | 36 (6.2%) | 54 (10.4%) |
| 70 to 74 Years | 19 (3.3%) | 36 (7.0%) |
| 75 to 79 Years | 8 (1.4%) | 25 (4.8%) |
| 80 to 84 Years | 32 (5.5%) | 15 (2.9%) |
| 85 Years and over | 7 (1.2%) | 15 (2.9%) |
| Total | 584 (100.0%) | 518 (100.0%) |
Families and Households in Lowellville
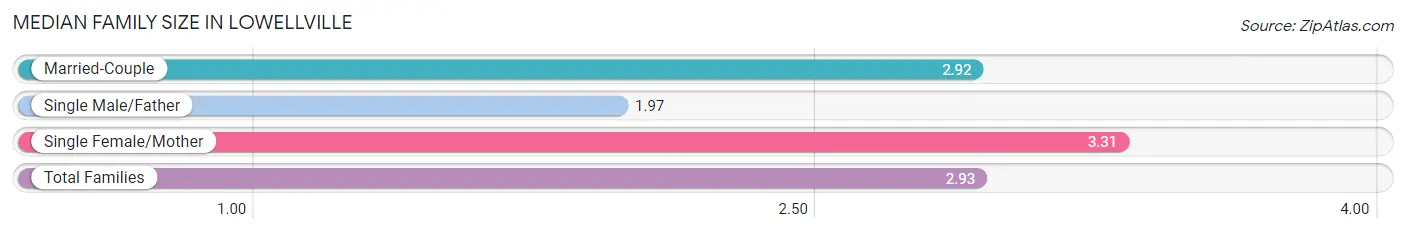
Median Family Size in Lowellville
The median family size in Lowellville is 2.93 persons per family, with single female/mother families (84 | 29.5%) accounting for the largest median family size of 3.31 persons per family. On the other hand, single male/father families (32 | 11.2%) represent the smallest median family size with 1.97 persons per family.
| Family Type | # Families | Family Size |
| Married-Couple | 169 (59.3%) | 2.92 |
| Single Male/Father | 32 (11.2%) | 1.97 |
| Single Female/Mother | 84 (29.5%) | 3.31 |
| Total Families | 285 (100.0%) | 2.93 |
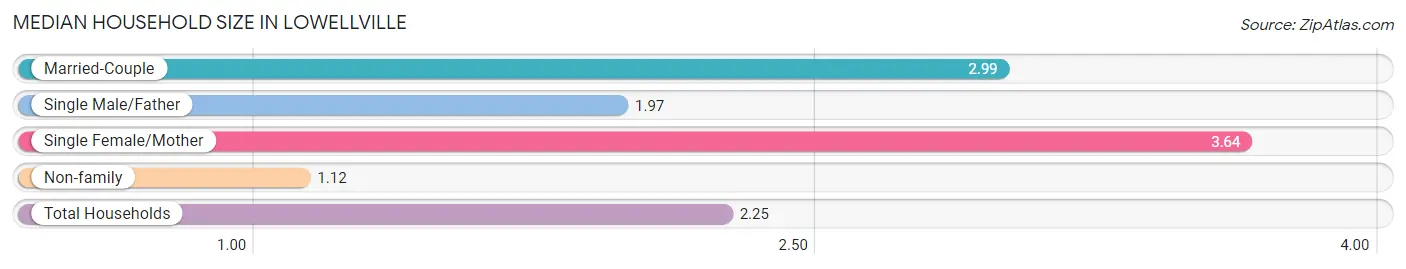
Median Household Size in Lowellville
The median household size in Lowellville is 2.25 persons per household, with single female/mother households (84 | 17.2%) accounting for the largest median household size of 3.64 persons per household. non-family households (204 | 41.7%) represent the smallest median household size with 1.12 persons per household.
| Household Type | # Households | Household Size |
| Married-Couple | 169 (34.6%) | 2.99 |
| Single Male/Father | 32 (6.5%) | 1.97 |
| Single Female/Mother | 84 (17.2%) | 3.64 |
| Non-family | 204 (41.7%) | 1.12 |
| Total Households | 489 (100.0%) | 2.25 |
Household Size by Marriage Status in Lowellville
Out of a total of 489 households in Lowellville, 285 (58.3%) are family households, while 204 (41.7%) are nonfamily households. The most numerous type of family households are 2-person households, comprising 157, and the most common type of nonfamily households are 1-person households, comprising 177.
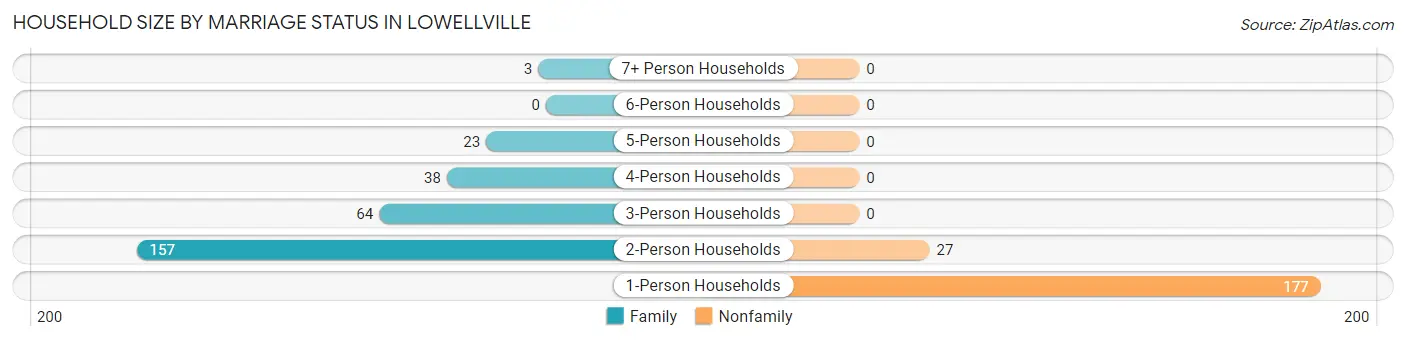
| Household Size | Family Households | Nonfamily Households |
| 1-Person Households | - | 177 (36.2%) |
| 2-Person Households | 157 (32.1%) | 27 (5.5%) |
| 3-Person Households | 64 (13.1%) | 0 (0.0%) |
| 4-Person Households | 38 (7.8%) | 0 (0.0%) |
| 5-Person Households | 23 (4.7%) | 0 (0.0%) |
| 6-Person Households | 0 (0.0%) | 0 (0.0%) |
| 7+ Person Households | 3 (0.6%) | 0 (0.0%) |
| Total | 285 (58.3%) | 204 (41.7%) |
Female Fertility in Lowellville
Fertility by Age in Lowellville
Average fertility rate in Lowellville is 113.0 births per 1,000 women. Women in the age bracket of 35 to 50 years have the highest fertility rate with 132.0 births per 1,000 women. Women in the age bracket of 20 to 34 years acount for 54.5% of all women with births.
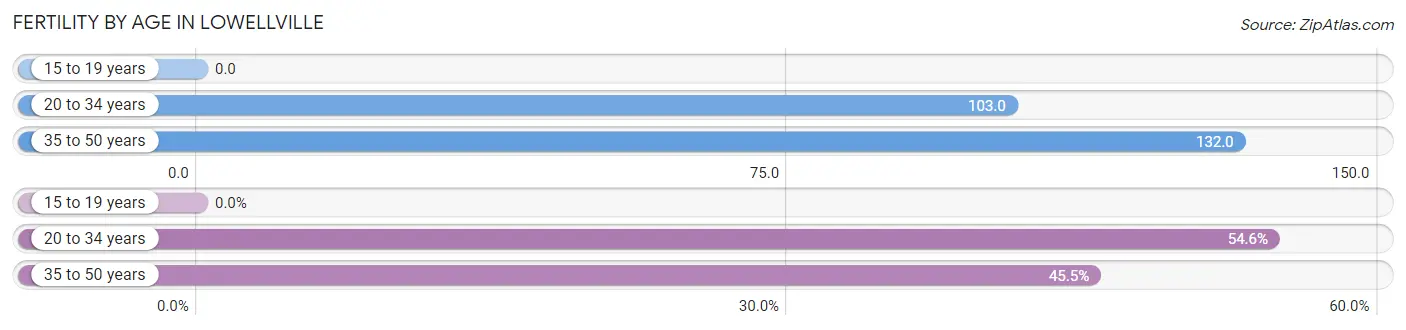
| Age Bracket | Women with Births | Births / 1,000 Women |
| 15 to 19 years | 0 (0.0%) | 0.0 |
| 20 to 34 years | 12 (54.5%) | 103.0 |
| 35 to 50 years | 10 (45.5%) | 132.0 |
| Total | 22 (100.0%) | 113.0 |
Fertility by Age by Marriage Status in Lowellville
59.1% of women with births (22) in Lowellville are married. The highest percentage of unmarried women with births falls into 20 to 34 years age bracket with 75.0% of them unmarried at the time of birth, while the lowest percentage of unmarried women with births belong to 35 to 50 years age bracket with 0.0% of them unmarried.
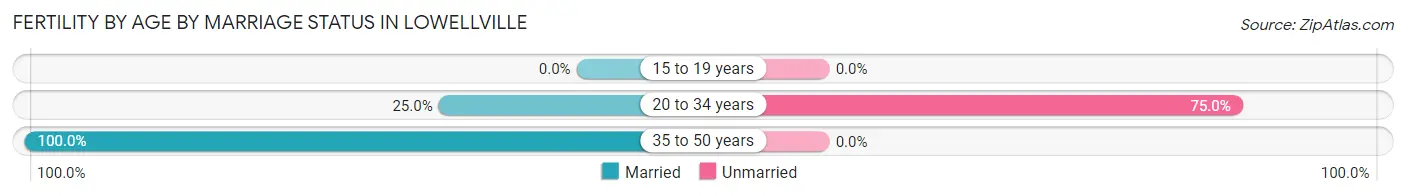
| Age Bracket | Married | Unmarried |
| 15 to 19 years | 0 (0.0%) | 0 (0.0%) |
| 20 to 34 years | 3 (25.0%) | 9 (75.0%) |
| 35 to 50 years | 10 (100.0%) | 0 (0.0%) |
| Total | 13 (59.1%) | 9 (40.9%) |
Fertility by Education in Lowellville
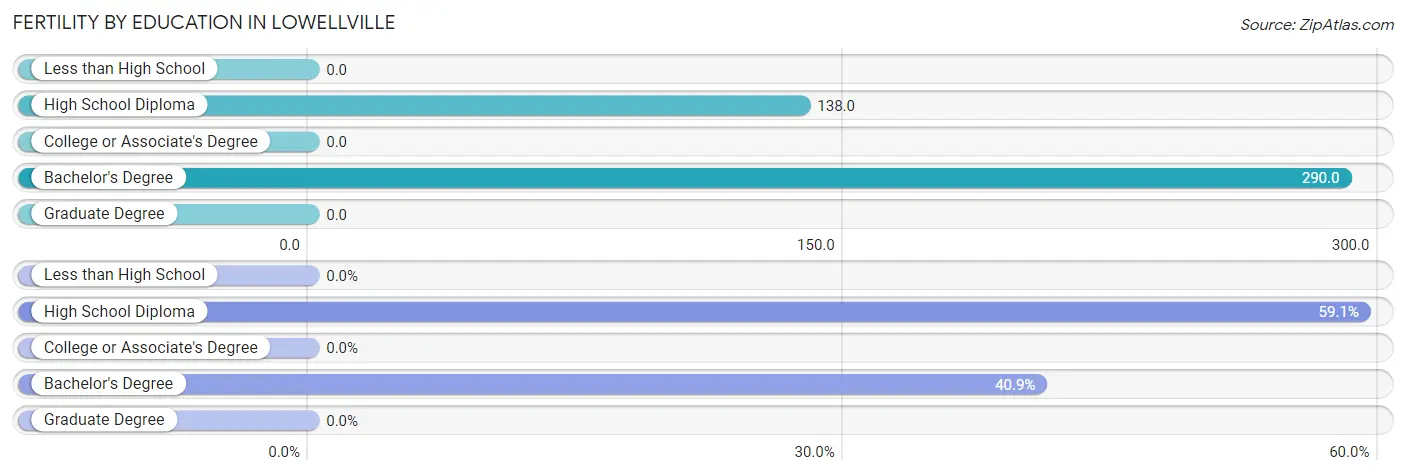
| Educational Attainment | Women with Births | Births / 1,000 Women |
| Less than High School | 0 (0.0%) | 0.0 |
| High School Diploma | 13 (59.1%) | 138.0 |
| College or Associate's Degree | 0 (0.0%) | 0.0 |
| Bachelor's Degree | 9 (40.9%) | 290.0 |
| Graduate Degree | 0 (0.0%) | 0.0 |
| Total | 22 (100.0%) | 113.0 |
Fertility by Education by Marriage Status in Lowellville
40.9% of women with births in Lowellville are unmarried. Women with the educational attainment of high school diploma are most likely to be married with 100.0% of them married at childbirth, while women with the educational attainment of bachelor's degree are least likely to be married with 100.0% of them unmarried at childbirth.
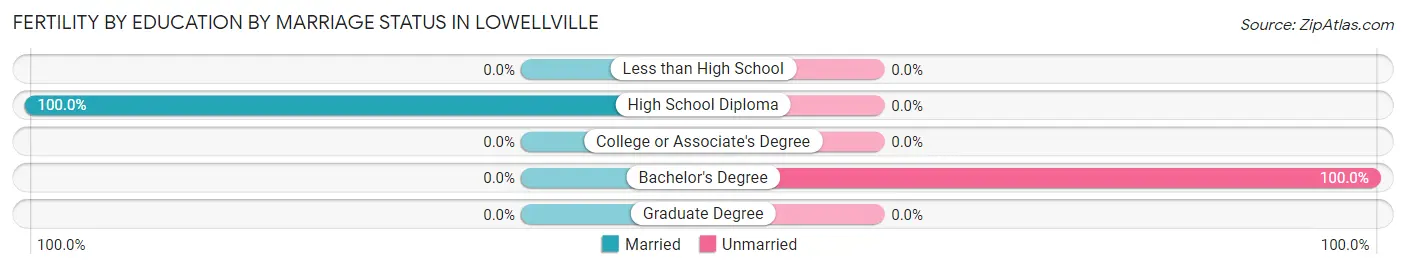
| Educational Attainment | Married | Unmarried |
| Less than High School | 0 (0.0%) | 0 (0.0%) |
| High School Diploma | 13 (100.0%) | 0 (0.0%) |
| College or Associate's Degree | 0 (0.0%) | 0 (0.0%) |
| Bachelor's Degree | 0 (0.0%) | 9 (100.0%) |
| Graduate Degree | 0 (0.0%) | 0 (0.0%) |
| Total | 13 (59.1%) | 9 (40.9%) |
Employment Characteristics in Lowellville
Employment by Class of Employer in Lowellville
Among the 530 employed individuals in Lowellville, private company employees (411 | 77.5%), self-employed (not incorporated) (41 | 7.7%), and not-for-profit organizations (38 | 7.2%) make up the most common classes of employment.
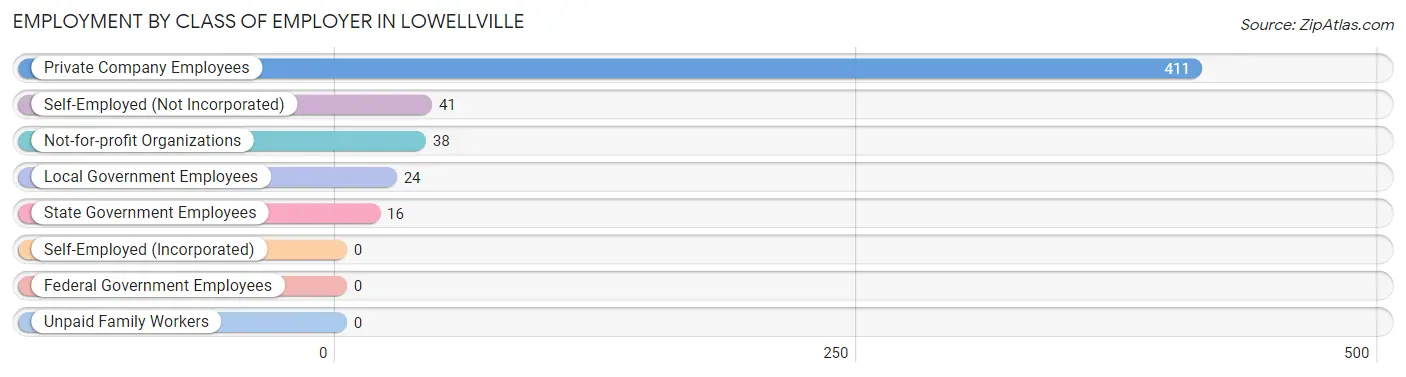
| Employer Class | # Employees | % Employees |
| Private Company Employees | 411 | 77.5% |
| Self-Employed (Incorporated) | 0 | 0.0% |
| Self-Employed (Not Incorporated) | 41 | 7.7% |
| Not-for-profit Organizations | 38 | 7.2% |
| Local Government Employees | 24 | 4.5% |
| State Government Employees | 16 | 3.0% |
| Federal Government Employees | 0 | 0.0% |
| Unpaid Family Workers | 0 | 0.0% |
| Total | 530 | 100.0% |
Employment Status by Age in Lowellville
According to the labor force statistics for Lowellville, out of the total population over 16 years of age (980), 57.0% or 559 individuals are in the labor force, with 4.3% or 24 of them unemployed. The age group with the highest labor force participation rate is 16 to 19 years, with 100.0% or 26 individuals in the labor force. Within the labor force, the 20 to 24 years age range has the highest percentage of unemployed individuals, with 21.9% or 14 of them being unemployed.
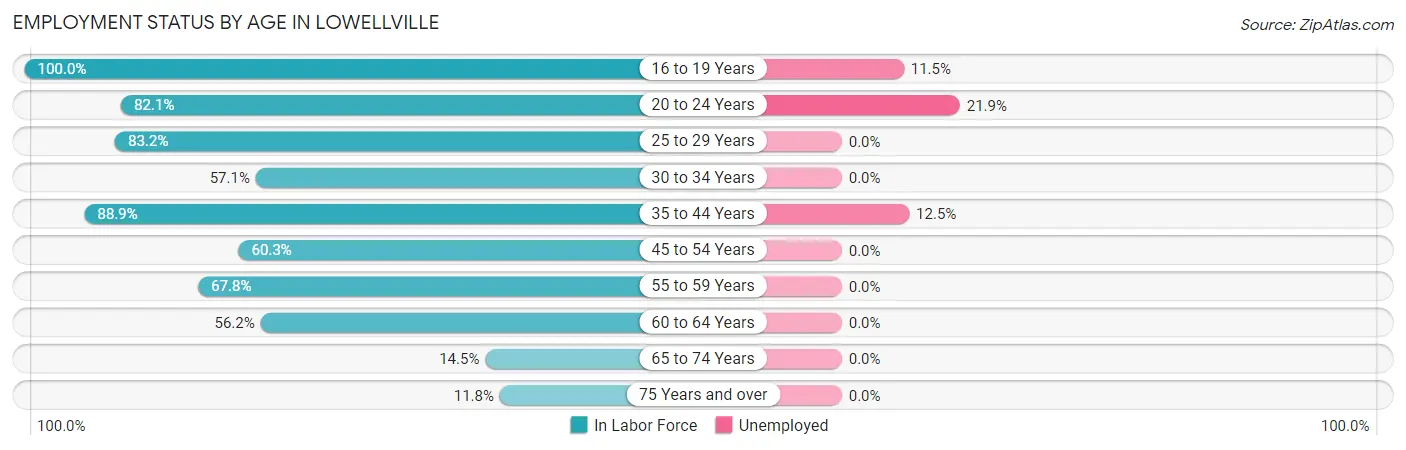
| Age Bracket | In Labor Force | Unemployed |
| 16 to 19 Years | 26 (100.0%) | 3 (11.5%) |
| 20 to 24 Years | 64 (82.1%) | 14 (21.9%) |
| 25 to 29 Years | 124 (83.2%) | 0 (0.0%) |
| 30 to 34 Years | 28 (57.1%) | 0 (0.0%) |
| 35 to 44 Years | 56 (88.9%) | 7 (12.5%) |
| 45 to 54 Years | 105 (60.3%) | 0 (0.0%) |
| 55 to 59 Years | 82 (67.8%) | 0 (0.0%) |
| 60 to 64 Years | 41 (56.2%) | 0 (0.0%) |
| 65 to 74 Years | 21 (14.5%) | 0 (0.0%) |
| 75 Years and over | 12 (11.8%) | 0 (0.0%) |
| Total | 559 (57.0%) | 24 (4.3%) |
Employment Status by Educational Attainment in Lowellville
According to labor force statistics for Lowellville, 69.3% of individuals (436) out of the total population between 25 and 64 years of age (629) are in the labor force, with 1.6% or 7 of them being unemployed. The group with the highest labor force participation rate are those with the educational attainment of college / associate degree, with 77.8% or 133 individuals in the labor force. Within the labor force, individuals with high school diploma education have the highest percentage of unemployment, with 3.4% or 7 of them being unemployed.
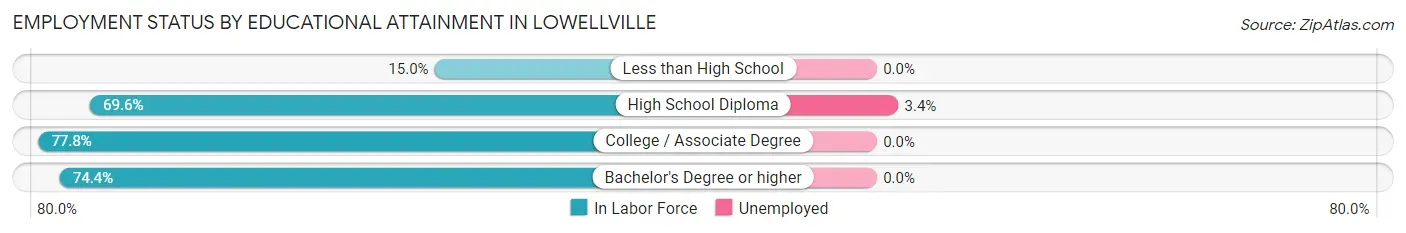
| Educational Attainment | In Labor Force | Unemployed |
| Less than High School | 6 (15.0%) | 0 (0.0%) |
| High School Diploma | 204 (69.6%) | 10 (3.4%) |
| College / Associate Degree | 133 (77.8%) | 0 (0.0%) |
| Bachelor's Degree or higher | 93 (74.4%) | 0 (0.0%) |
| Total | 436 (69.3%) | 10 (1.6%) |
Employment Occupations by Sex in Lowellville
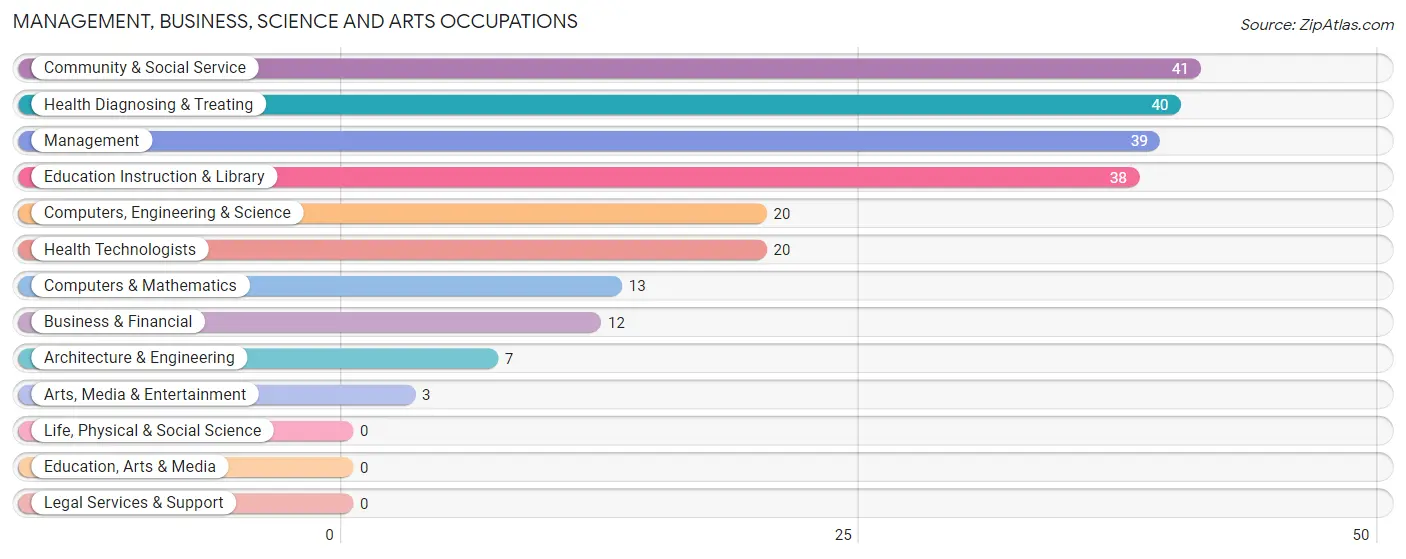
Management, Business, Science and Arts Occupations
The most common Management, Business, Science and Arts occupations in Lowellville are Community & Social Service (41 | 7.7%), Health Diagnosing & Treating (40 | 7.5%), Management (39 | 7.3%), Education Instruction & Library (38 | 7.1%), and Computers, Engineering & Science (20 | 3.7%).
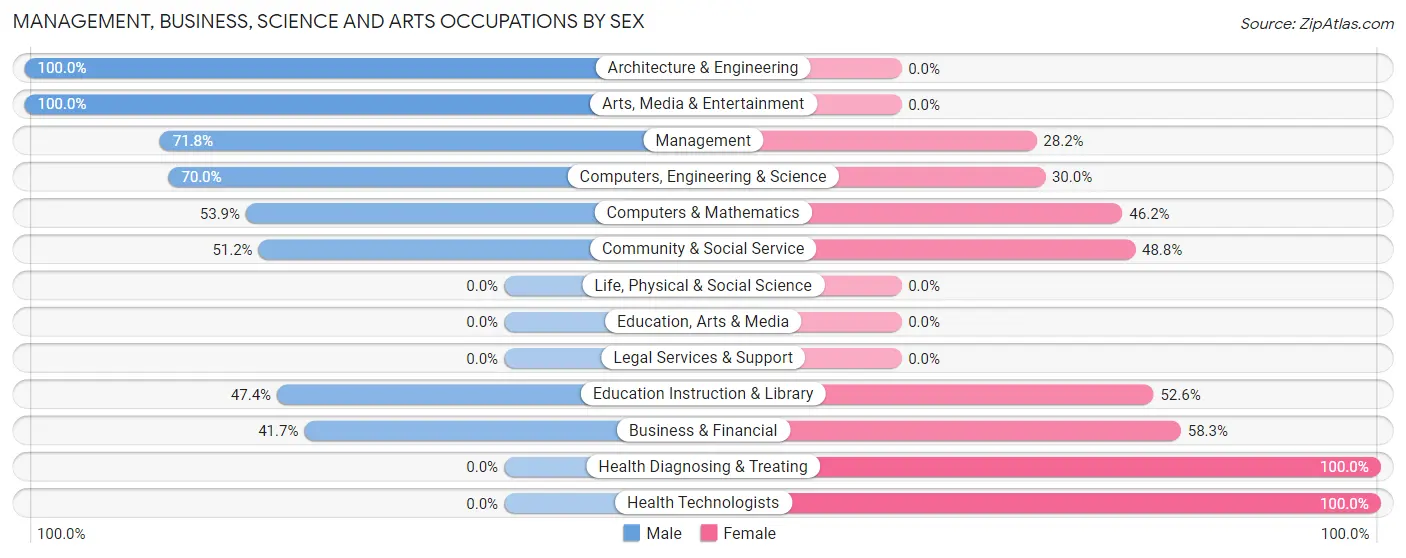
Management, Business, Science and Arts Occupations by Sex
Within the Management, Business, Science and Arts occupations in Lowellville, the most male-oriented occupations are Architecture & Engineering (100.0%), Arts, Media & Entertainment (100.0%), and Management (71.8%), while the most female-oriented occupations are Health Diagnosing & Treating (100.0%), Health Technologists (100.0%), and Business & Financial (58.3%).
| Occupation | Male | Female |
| Management | 28 (71.8%) | 11 (28.2%) |
| Business & Financial | 5 (41.7%) | 7 (58.3%) |
| Computers, Engineering & Science | 14 (70.0%) | 6 (30.0%) |
| Computers & Mathematics | 7 (53.8%) | 6 (46.2%) |
| Architecture & Engineering | 7 (100.0%) | 0 (0.0%) |
| Life, Physical & Social Science | 0 (0.0%) | 0 (0.0%) |
| Community & Social Service | 21 (51.2%) | 20 (48.8%) |
| Education, Arts & Media | 0 (0.0%) | 0 (0.0%) |
| Legal Services & Support | 0 (0.0%) | 0 (0.0%) |
| Education Instruction & Library | 18 (47.4%) | 20 (52.6%) |
| Arts, Media & Entertainment | 3 (100.0%) | 0 (0.0%) |
| Health Diagnosing & Treating | 0 (0.0%) | 40 (100.0%) |
| Health Technologists | 0 (0.0%) | 20 (100.0%) |
| Total (Category) | 68 (44.7%) | 84 (55.3%) |
| Total (Overall) | 294 (54.9%) | 241 (45.1%) |
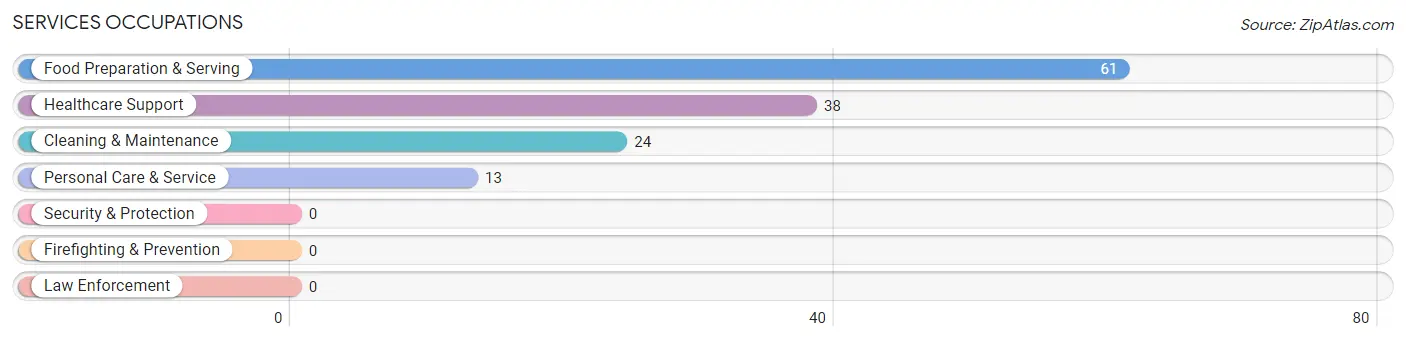
Services Occupations
The most common Services occupations in Lowellville are Food Preparation & Serving (61 | 11.4%), Healthcare Support (38 | 7.1%), Cleaning & Maintenance (24 | 4.5%), and Personal Care & Service (13 | 2.4%).
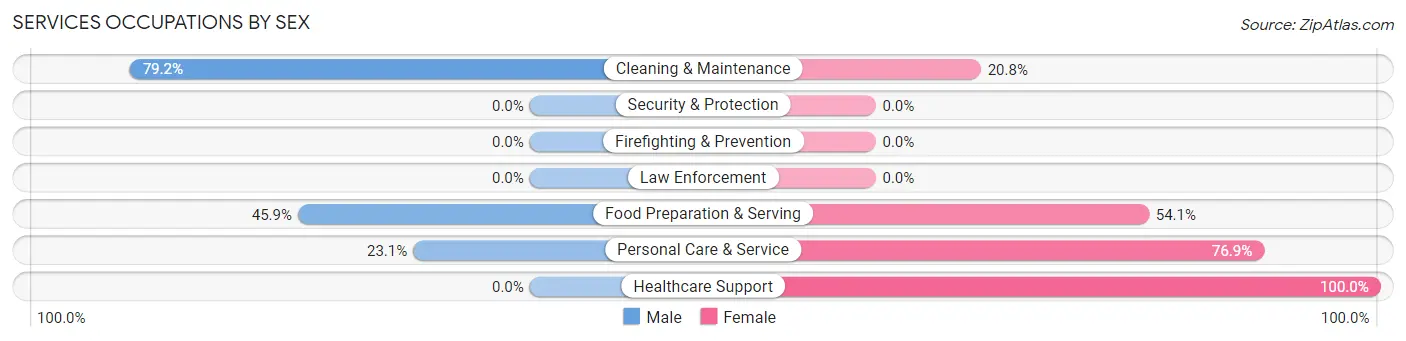
Services Occupations by Sex
Within the Services occupations in Lowellville, the most male-oriented occupations are Cleaning & Maintenance (79.2%), Food Preparation & Serving (45.9%), and Personal Care & Service (23.1%), while the most female-oriented occupations are Healthcare Support (100.0%), Personal Care & Service (76.9%), and Food Preparation & Serving (54.1%).
| Occupation | Male | Female |
| Healthcare Support | 0 (0.0%) | 38 (100.0%) |
| Security & Protection | 0 (0.0%) | 0 (0.0%) |
| Firefighting & Prevention | 0 (0.0%) | 0 (0.0%) |
| Law Enforcement | 0 (0.0%) | 0 (0.0%) |
| Food Preparation & Serving | 28 (45.9%) | 33 (54.1%) |
| Cleaning & Maintenance | 19 (79.2%) | 5 (20.8%) |
| Personal Care & Service | 3 (23.1%) | 10 (76.9%) |
| Total (Category) | 50 (36.8%) | 86 (63.2%) |
| Total (Overall) | 294 (54.9%) | 241 (45.1%) |
Sales and Office Occupations
The most common Sales and Office occupations in Lowellville are Sales & Related (47 | 8.8%), and Office & Administration (31 | 5.8%).
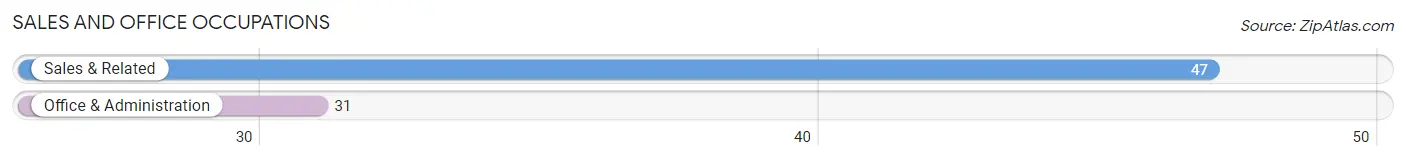
Sales and Office Occupations by Sex
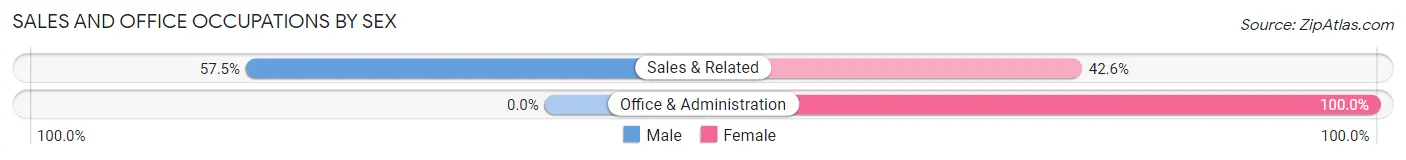
| Occupation | Male | Female |
| Sales & Related | 27 (57.5%) | 20 (42.5%) |
| Office & Administration | 0 (0.0%) | 31 (100.0%) |
| Total (Category) | 27 (34.6%) | 51 (65.4%) |
| Total (Overall) | 294 (54.9%) | 241 (45.1%) |
Natural Resources, Construction and Maintenance Occupations
The most common Natural Resources, Construction and Maintenance occupations in Lowellville are , and Construction & Extraction (42 | 7.9%).
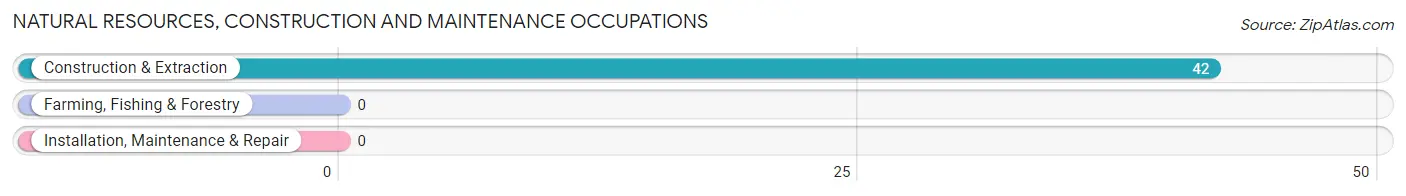
Natural Resources, Construction and Maintenance Occupations by Sex
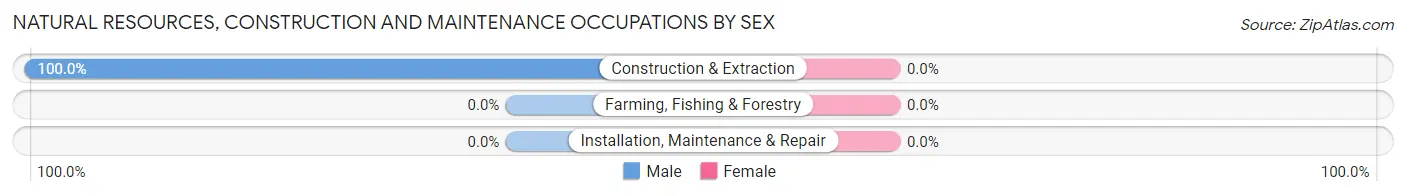
| Occupation | Male | Female |
| Farming, Fishing & Forestry | 0 (0.0%) | 0 (0.0%) |
| Construction & Extraction | 42 (100.0%) | 0 (0.0%) |
| Installation, Maintenance & Repair | 0 (0.0%) | 0 (0.0%) |
| Total (Category) | 42 (100.0%) | 0 (0.0%) |
| Total (Overall) | 294 (54.9%) | 241 (45.1%) |
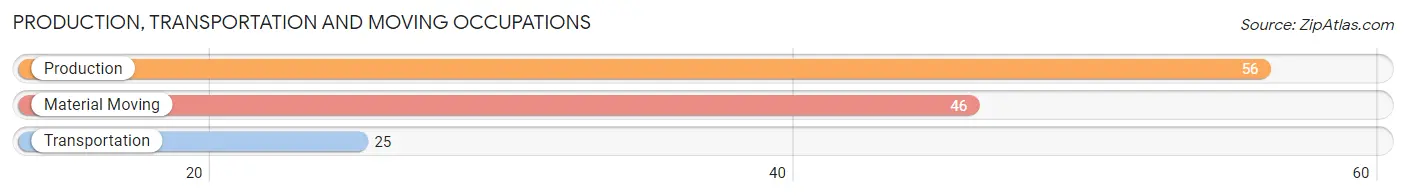
Production, Transportation and Moving Occupations
The most common Production, Transportation and Moving occupations in Lowellville are Production (56 | 10.5%), Material Moving (46 | 8.6%), and Transportation (25 | 4.7%).
Production, Transportation and Moving Occupations by Sex
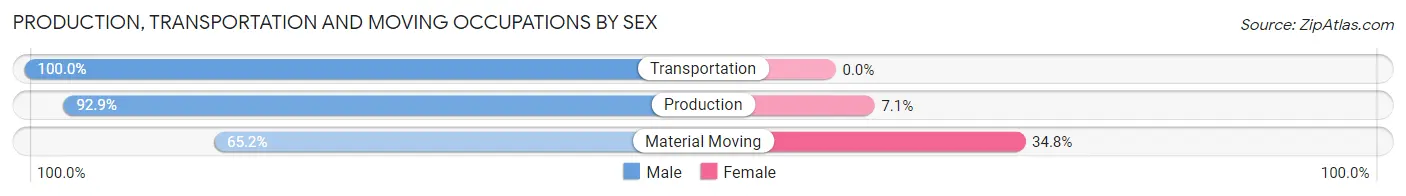
| Occupation | Male | Female |
| Production | 52 (92.9%) | 4 (7.1%) |
| Transportation | 25 (100.0%) | 0 (0.0%) |
| Material Moving | 30 (65.2%) | 16 (34.8%) |
| Total (Category) | 107 (84.3%) | 20 (15.8%) |
| Total (Overall) | 294 (54.9%) | 241 (45.1%) |
Employment Industries by Sex in Lowellville
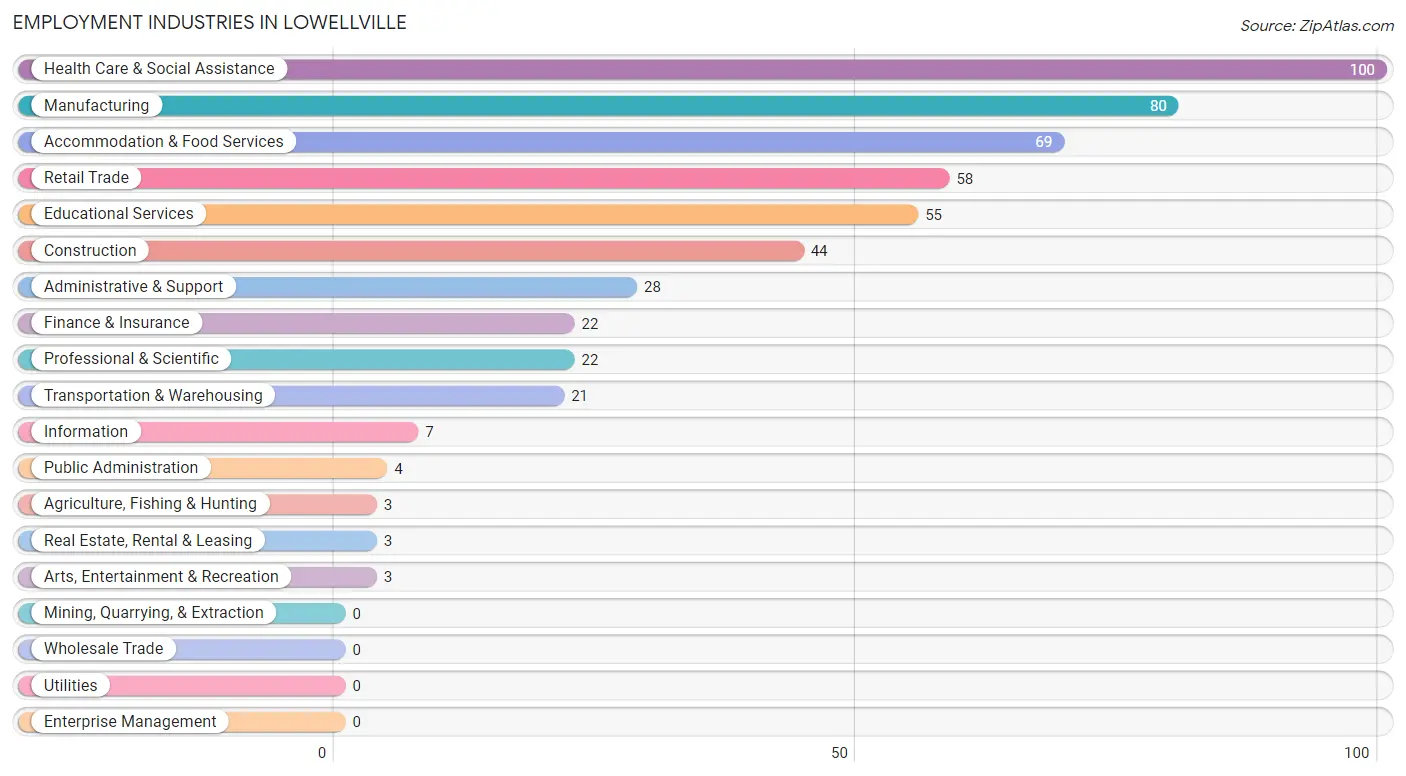
Employment Industries in Lowellville
The major employment industries in Lowellville include Health Care & Social Assistance (100 | 18.7%), Manufacturing (80 | 14.9%), Accommodation & Food Services (69 | 12.9%), Retail Trade (58 | 10.8%), and Educational Services (55 | 10.3%).
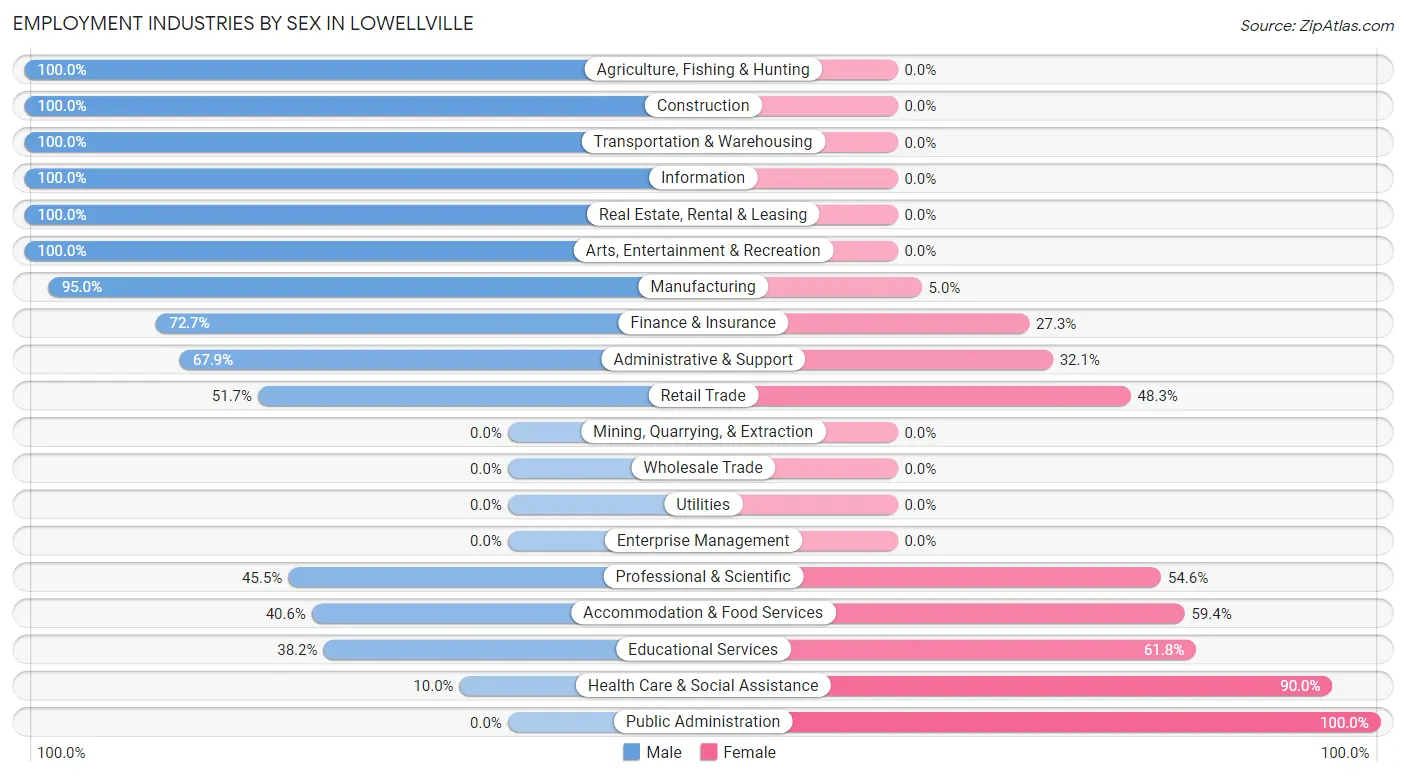
Employment Industries by Sex in Lowellville
The Lowellville industries that see more men than women are Agriculture, Fishing & Hunting (100.0%), Construction (100.0%), and Transportation & Warehousing (100.0%), whereas the industries that tend to have a higher number of women are Public Administration (100.0%), Health Care & Social Assistance (90.0%), and Educational Services (61.8%).
| Industry | Male | Female |
| Agriculture, Fishing & Hunting | 3 (100.0%) | 0 (0.0%) |
| Mining, Quarrying, & Extraction | 0 (0.0%) | 0 (0.0%) |
| Construction | 44 (100.0%) | 0 (0.0%) |
| Manufacturing | 76 (95.0%) | 4 (5.0%) |
| Wholesale Trade | 0 (0.0%) | 0 (0.0%) |
| Retail Trade | 30 (51.7%) | 28 (48.3%) |
| Transportation & Warehousing | 21 (100.0%) | 0 (0.0%) |
| Utilities | 0 (0.0%) | 0 (0.0%) |
| Information | 7 (100.0%) | 0 (0.0%) |
| Finance & Insurance | 16 (72.7%) | 6 (27.3%) |
| Real Estate, Rental & Leasing | 3 (100.0%) | 0 (0.0%) |
| Professional & Scientific | 10 (45.5%) | 12 (54.5%) |
| Enterprise Management | 0 (0.0%) | 0 (0.0%) |
| Administrative & Support | 19 (67.9%) | 9 (32.1%) |
| Educational Services | 21 (38.2%) | 34 (61.8%) |
| Health Care & Social Assistance | 10 (10.0%) | 90 (90.0%) |
| Arts, Entertainment & Recreation | 3 (100.0%) | 0 (0.0%) |
| Accommodation & Food Services | 28 (40.6%) | 41 (59.4%) |
| Public Administration | 0 (0.0%) | 4 (100.0%) |
| Total | 294 (54.9%) | 241 (45.1%) |
Education in Lowellville
School Enrollment in Lowellville
The most common levels of schooling among the 170 students in Lowellville are college / undergraduate (49 | 28.8%), middle school (45 | 26.5%), and graduate / professional (24 | 14.1%).
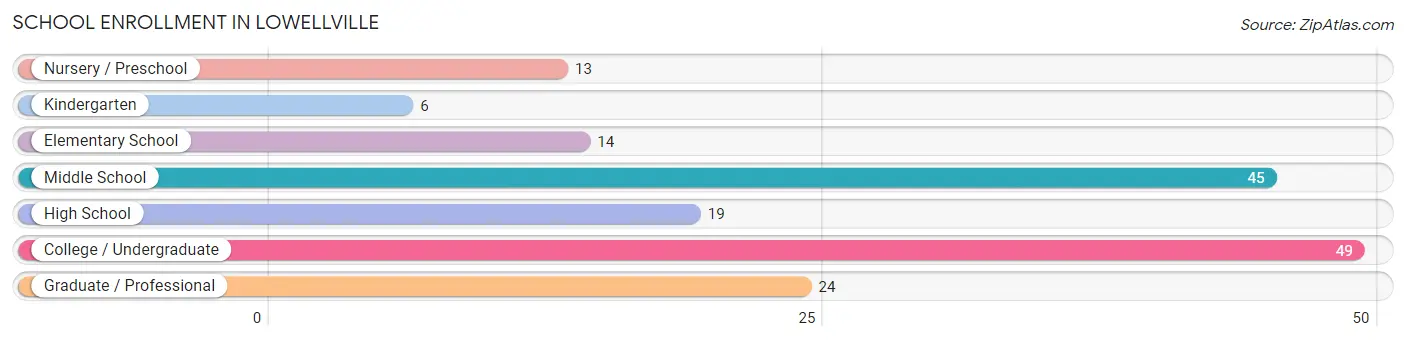
| School Level | # Students | % Students |
| Nursery / Preschool | 13 | 7.6% |
| Kindergarten | 6 | 3.5% |
| Elementary School | 14 | 8.2% |
| Middle School | 45 | 26.5% |
| High School | 19 | 11.2% |
| College / Undergraduate | 49 | 28.8% |
| Graduate / Professional | 24 | 14.1% |
| Total | 170 | 100.0% |
School Enrollment by Age by Funding Source in Lowellville
Out of a total of 170 students who are enrolled in schools in Lowellville, 26 (15.3%) attend a private institution, while the remaining 144 (84.7%) are enrolled in public schools. The age group of 25 to 34 year olds has the highest likelihood of being enrolled in private schools, with 20 (62.5% in the age bracket) enrolled. Conversely, the age group of 3 to 4 year olds has the lowest likelihood of being enrolled in a private school, with 13 (100.0% in the age bracket) attending a public institution.
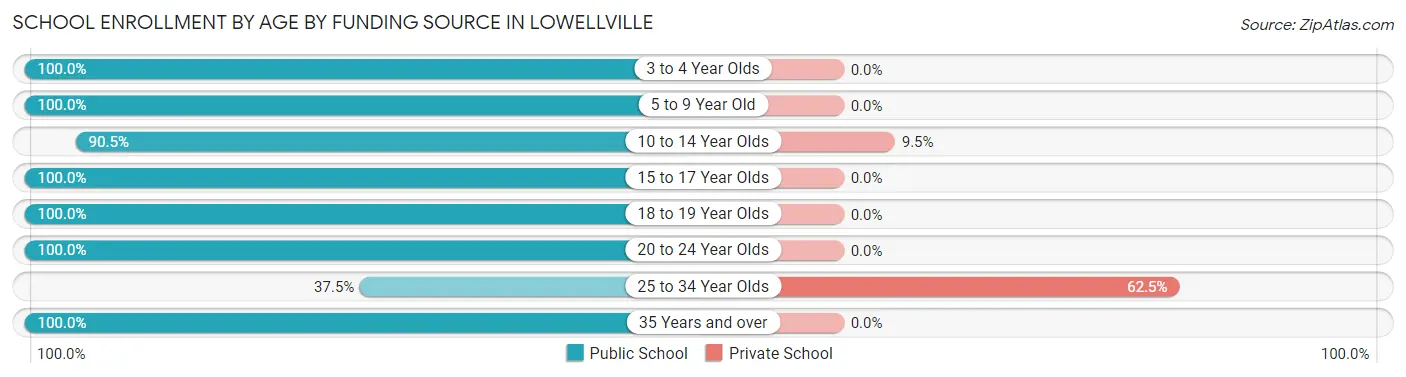
| Age Bracket | Public School | Private School |
| 3 to 4 Year Olds | 13 (100.0%) | 0 (0.0%) |
| 5 to 9 Year Old | 9 (100.0%) | 0 (0.0%) |
| 10 to 14 Year Olds | 57 (90.5%) | 6 (9.5%) |
| 15 to 17 Year Olds | 9 (100.0%) | 0 (0.0%) |
| 18 to 19 Year Olds | 17 (100.0%) | 0 (0.0%) |
| 20 to 24 Year Olds | 24 (100.0%) | 0 (0.0%) |
| 25 to 34 Year Olds | 12 (37.5%) | 20 (62.5%) |
| 35 Years and over | 3 (100.0%) | 0 (0.0%) |
| Total | 144 (84.7%) | 26 (15.3%) |
Educational Attainment by Field of Study in Lowellville
Business (65 | 42.5%), education (42 | 27.5%), science & technology (21 | 13.7%), arts & humanities (12 | 7.8%), and computers & mathematics (10 | 6.5%) are the most common fields of study among 153 individuals in Lowellville who have obtained a bachelor's degree or higher.
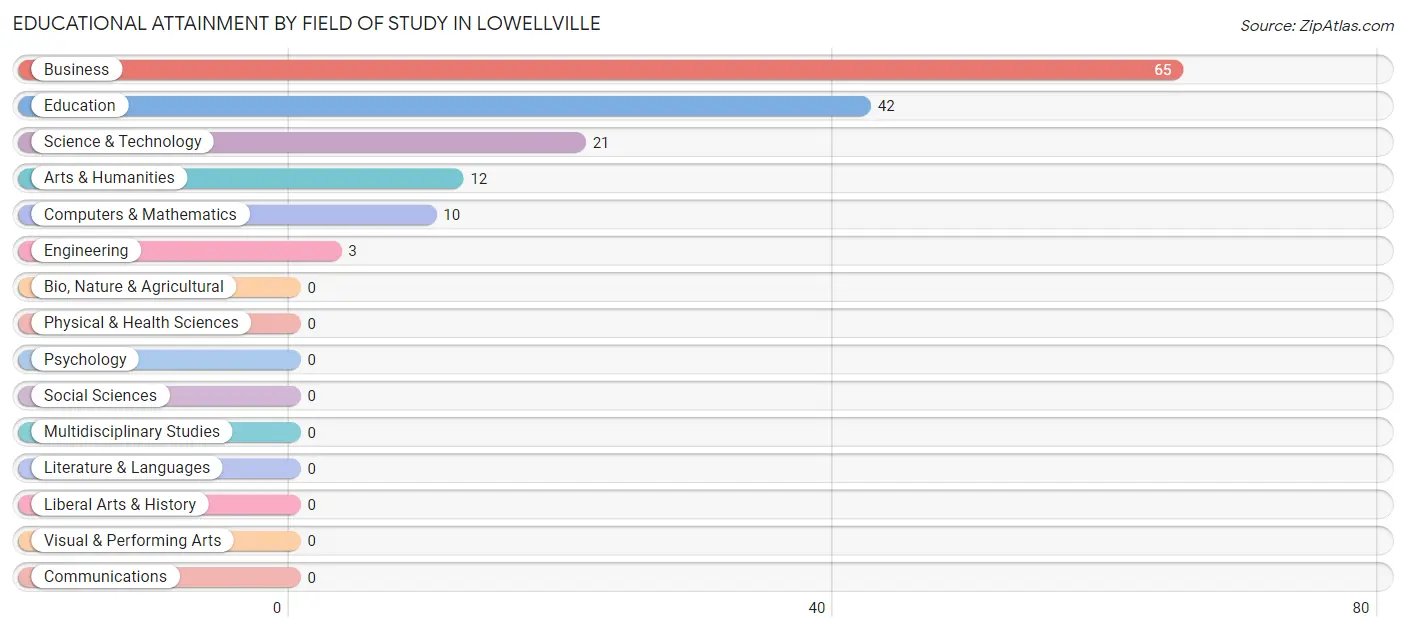
| Field of Study | # Graduates | % Graduates |
| Computers & Mathematics | 10 | 6.5% |
| Bio, Nature & Agricultural | 0 | 0.0% |
| Physical & Health Sciences | 0 | 0.0% |
| Psychology | 0 | 0.0% |
| Social Sciences | 0 | 0.0% |
| Engineering | 3 | 2.0% |
| Multidisciplinary Studies | 0 | 0.0% |
| Science & Technology | 21 | 13.7% |
| Business | 65 | 42.5% |
| Education | 42 | 27.5% |
| Literature & Languages | 0 | 0.0% |
| Liberal Arts & History | 0 | 0.0% |
| Visual & Performing Arts | 0 | 0.0% |
| Communications | 0 | 0.0% |
| Arts & Humanities | 12 | 7.8% |
| Total | 153 | 100.0% |
Transportation & Commute in Lowellville
Vehicle Availability by Sex in Lowellville
The most prevalent vehicle ownership categories in Lowellville are males with 2 vehicles (102, accounting for 34.7%) and females with 2 vehicles (87, making up 43.2%).
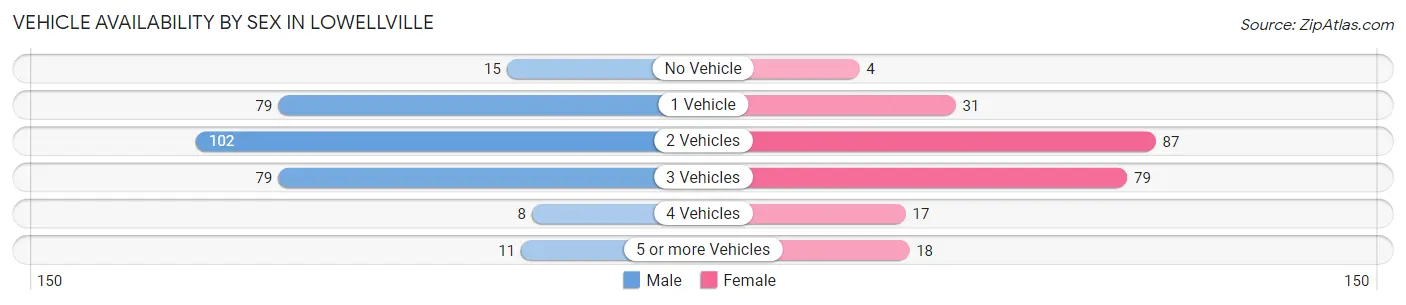
| Vehicles Available | Male | Female |
| No Vehicle | 15 (5.1%) | 4 (1.7%) |
| 1 Vehicle | 79 (26.9%) | 31 (13.1%) |
| 2 Vehicles | 102 (34.7%) | 87 (36.9%) |
| 3 Vehicles | 79 (26.9%) | 79 (33.5%) |
| 4 Vehicles | 8 (2.7%) | 17 (7.2%) |
| 5 or more Vehicles | 11 (3.7%) | 18 (7.6%) |
| Total | 294 (100.0%) | 236 (100.0%) |
Commute Time in Lowellville
The most frequently occuring commute durations in Lowellville are 15 to 19 minutes (127 commuters, 25.0%), 30 to 34 minutes (104 commuters, 20.5%), and 20 to 24 minutes (65 commuters, 12.8%).
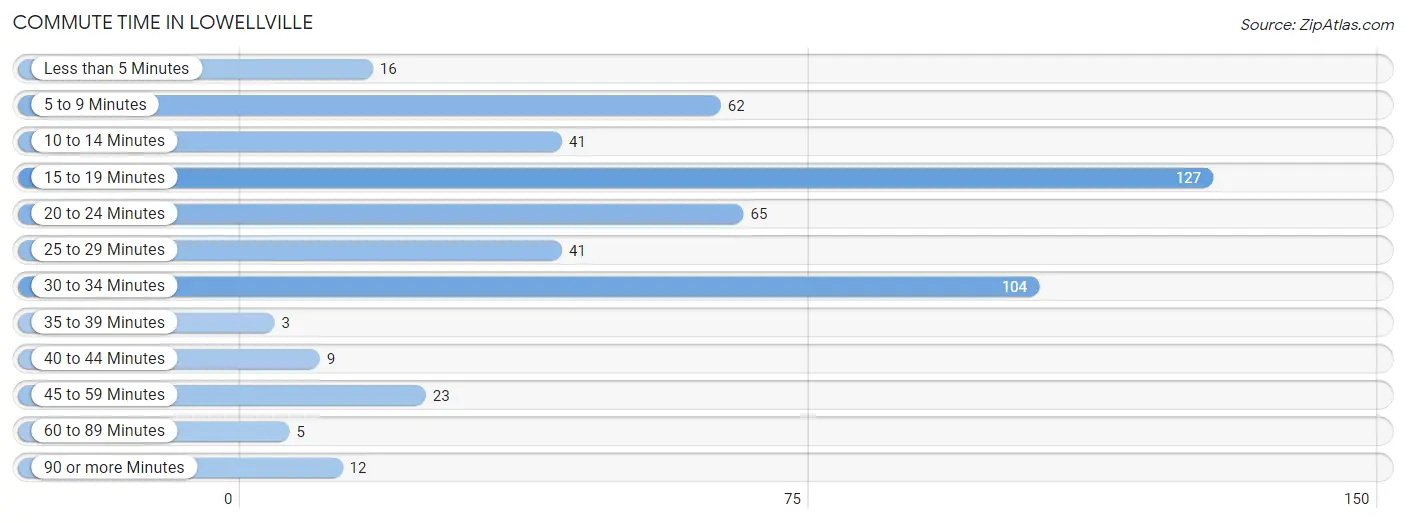
| Commute Time | # Commuters | % Commuters |
| Less than 5 Minutes | 16 | 3.2% |
| 5 to 9 Minutes | 62 | 12.2% |
| 10 to 14 Minutes | 41 | 8.1% |
| 15 to 19 Minutes | 127 | 25.0% |
| 20 to 24 Minutes | 65 | 12.8% |
| 25 to 29 Minutes | 41 | 8.1% |
| 30 to 34 Minutes | 104 | 20.5% |
| 35 to 39 Minutes | 3 | 0.6% |
| 40 to 44 Minutes | 9 | 1.8% |
| 45 to 59 Minutes | 23 | 4.5% |
| 60 to 89 Minutes | 5 | 1.0% |
| 90 or more Minutes | 12 | 2.4% |
Commute Time by Sex in Lowellville
The most common commute times in Lowellville are 15 to 19 minutes (81 commuters, 28.8%) for males and 20 to 24 minutes (47 commuters, 20.7%) for females.
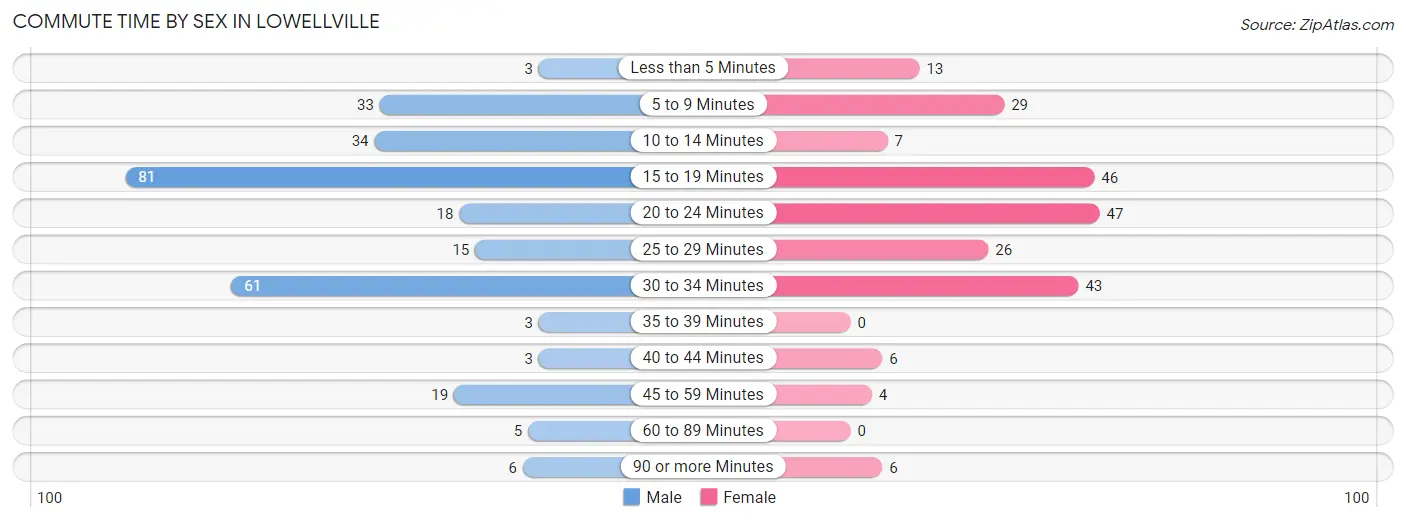
| Commute Time | Male | Female |
| Less than 5 Minutes | 3 (1.1%) | 13 (5.7%) |
| 5 to 9 Minutes | 33 (11.7%) | 29 (12.8%) |
| 10 to 14 Minutes | 34 (12.1%) | 7 (3.1%) |
| 15 to 19 Minutes | 81 (28.8%) | 46 (20.3%) |
| 20 to 24 Minutes | 18 (6.4%) | 47 (20.7%) |
| 25 to 29 Minutes | 15 (5.3%) | 26 (11.5%) |
| 30 to 34 Minutes | 61 (21.7%) | 43 (18.9%) |
| 35 to 39 Minutes | 3 (1.1%) | 0 (0.0%) |
| 40 to 44 Minutes | 3 (1.1%) | 6 (2.6%) |
| 45 to 59 Minutes | 19 (6.8%) | 4 (1.8%) |
| 60 to 89 Minutes | 5 (1.8%) | 0 (0.0%) |
| 90 or more Minutes | 6 (2.1%) | 6 (2.6%) |
Time of Departure to Work by Sex in Lowellville
The most frequent times of departure to work in Lowellville are 6:30 AM to 6:59 AM (45, 16.0%) for males and 7:00 AM to 7:29 AM (46, 20.3%) for females.
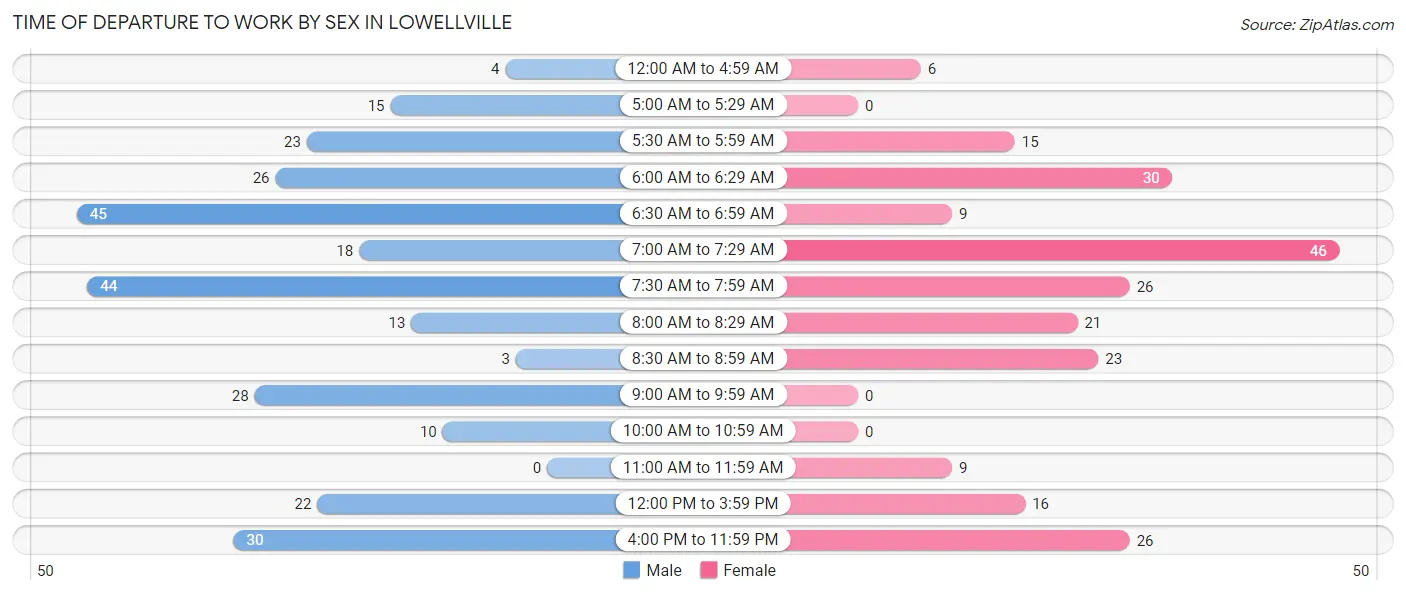
| Time of Departure | Male | Female |
| 12:00 AM to 4:59 AM | 4 (1.4%) | 6 (2.6%) |
| 5:00 AM to 5:29 AM | 15 (5.3%) | 0 (0.0%) |
| 5:30 AM to 5:59 AM | 23 (8.2%) | 15 (6.6%) |
| 6:00 AM to 6:29 AM | 26 (9.2%) | 30 (13.2%) |
| 6:30 AM to 6:59 AM | 45 (16.0%) | 9 (4.0%) |
| 7:00 AM to 7:29 AM | 18 (6.4%) | 46 (20.3%) |
| 7:30 AM to 7:59 AM | 44 (15.7%) | 26 (11.5%) |
| 8:00 AM to 8:29 AM | 13 (4.6%) | 21 (9.2%) |
| 8:30 AM to 8:59 AM | 3 (1.1%) | 23 (10.1%) |
| 9:00 AM to 9:59 AM | 28 (10.0%) | 0 (0.0%) |
| 10:00 AM to 10:59 AM | 10 (3.6%) | 0 (0.0%) |
| 11:00 AM to 11:59 AM | 0 (0.0%) | 9 (4.0%) |
| 12:00 PM to 3:59 PM | 22 (7.8%) | 16 (7.0%) |
| 4:00 PM to 11:59 PM | 30 (10.7%) | 26 (11.5%) |
| Total | 281 (100.0%) | 227 (100.0%) |
Housing Occupancy in Lowellville
Occupancy by Ownership in Lowellville
Of the total 489 dwellings in Lowellville, owner-occupied units account for 327 (66.9%), while renter-occupied units make up 162 (33.1%).
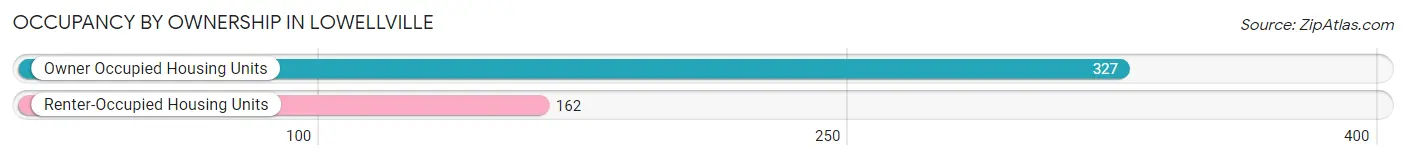
| Occupancy | # Housing Units | % Housing Units |
| Owner Occupied Housing Units | 327 | 66.9% |
| Renter-Occupied Housing Units | 162 | 33.1% |
| Total Occupied Housing Units | 489 | 100.0% |
Occupancy by Household Size in Lowellville
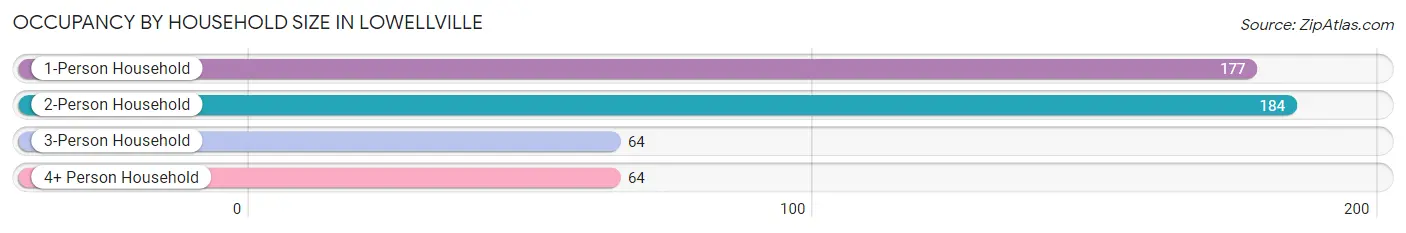
| Household Size | # Housing Units | % Housing Units |
| 1-Person Household | 177 | 36.2% |
| 2-Person Household | 184 | 37.6% |
| 3-Person Household | 64 | 13.1% |
| 4+ Person Household | 64 | 13.1% |
| Total Housing Units | 489 | 100.0% |
Occupancy by Ownership by Household Size in Lowellville
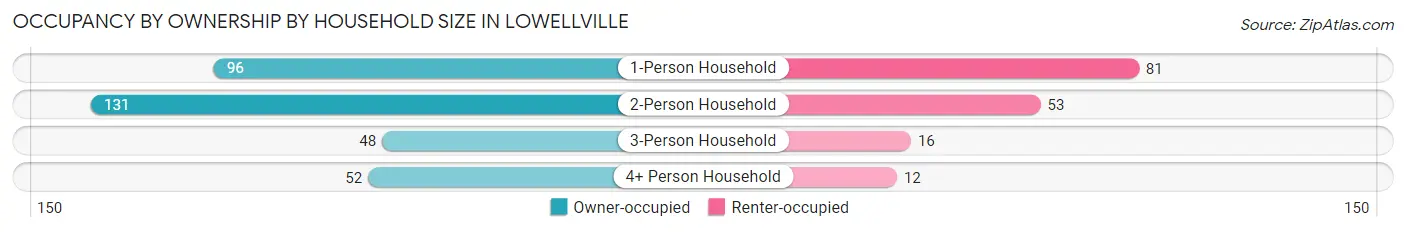
| Household Size | Owner-occupied | Renter-occupied |
| 1-Person Household | 96 (54.2%) | 81 (45.8%) |
| 2-Person Household | 131 (71.2%) | 53 (28.8%) |
| 3-Person Household | 48 (75.0%) | 16 (25.0%) |
| 4+ Person Household | 52 (81.2%) | 12 (18.8%) |
| Total Housing Units | 327 (66.9%) | 162 (33.1%) |
Occupancy by Educational Attainment in Lowellville
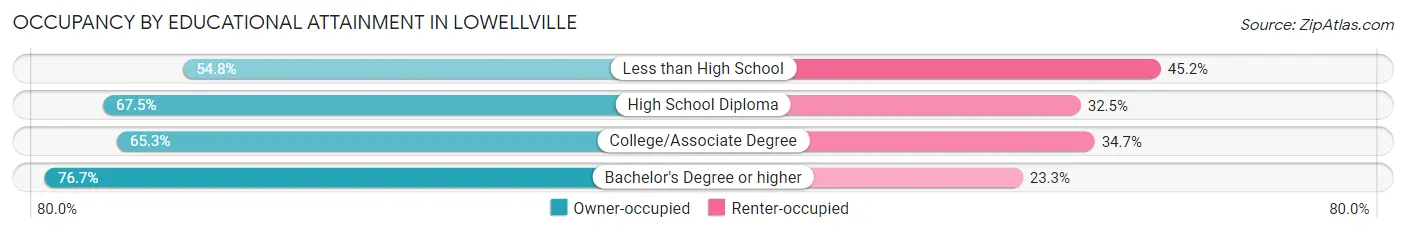
| Household Size | Owner-occupied | Renter-occupied |
| Less than High School | 34 (54.8%) | 28 (45.2%) |
| High School Diploma | 129 (67.5%) | 62 (32.5%) |
| College/Associate Degree | 98 (65.3%) | 52 (34.7%) |
| Bachelor's Degree or higher | 66 (76.7%) | 20 (23.3%) |
Occupancy by Age of Householder in Lowellville
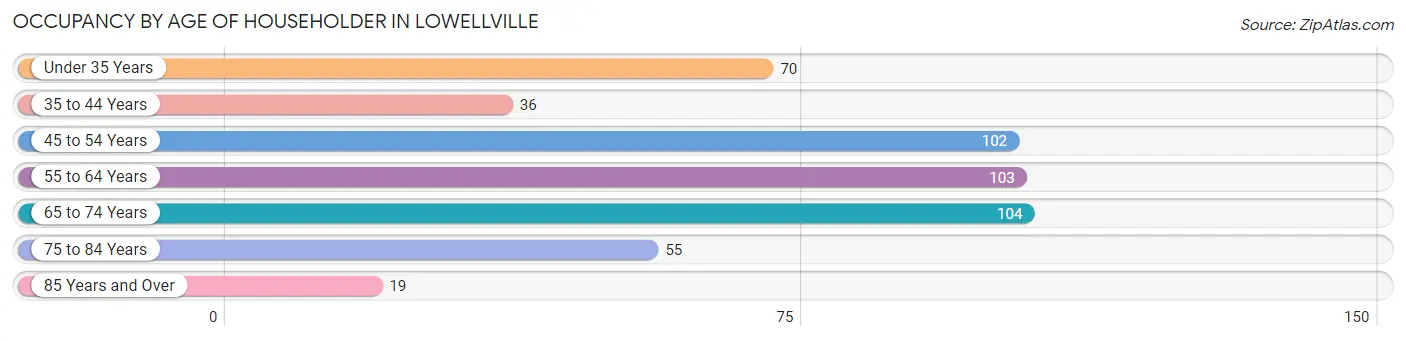
| Age Bracket | # Households | % Households |
| Under 35 Years | 70 | 14.3% |
| 35 to 44 Years | 36 | 7.4% |
| 45 to 54 Years | 102 | 20.9% |
| 55 to 64 Years | 103 | 21.1% |
| 65 to 74 Years | 104 | 21.3% |
| 75 to 84 Years | 55 | 11.3% |
| 85 Years and Over | 19 | 3.9% |
| Total | 489 | 100.0% |
Housing Finances in Lowellville
Median Income by Occupancy in Lowellville
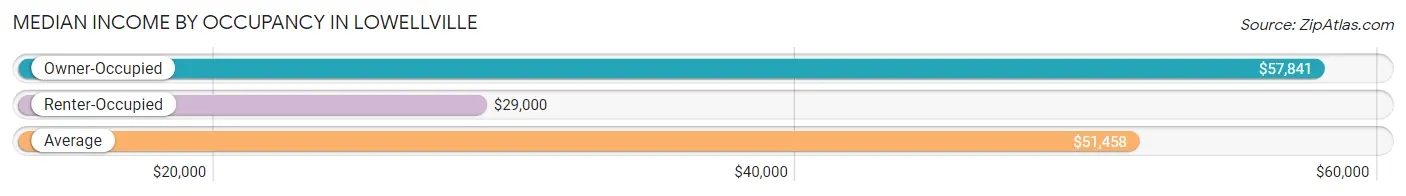
| Occupancy Type | # Households | Median Income |
| Owner-Occupied | 327 (66.9%) | $57,841 |
| Renter-Occupied | 162 (33.1%) | $29,000 |
| Average | 489 (100.0%) | $51,458 |
Occupancy by Householder Income Bracket in Lowellville
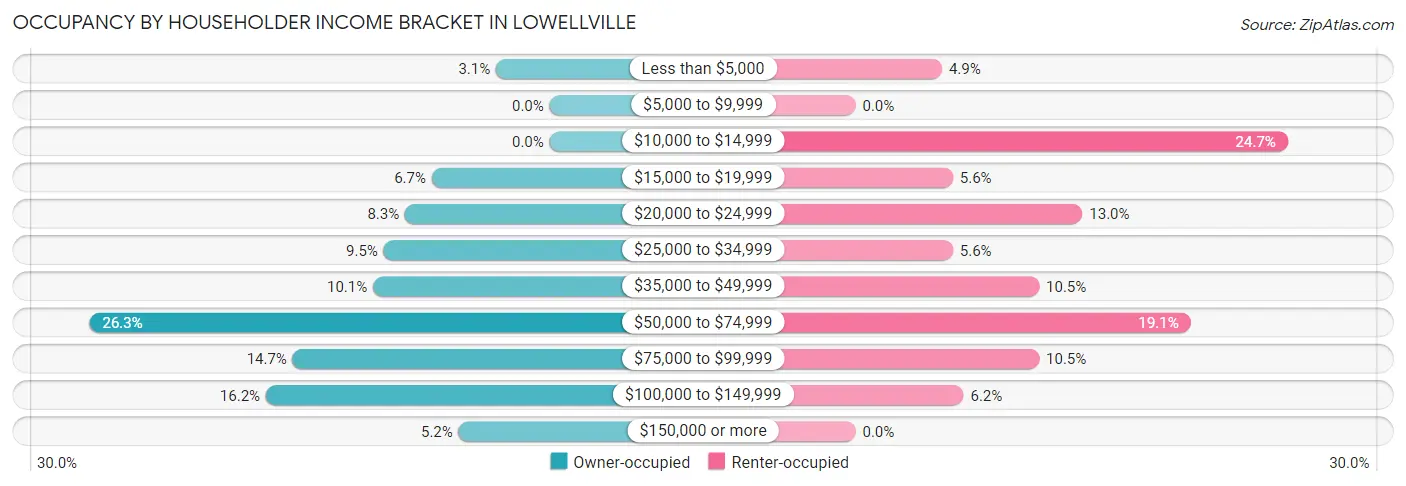
| Income Bracket | Owner-occupied | Renter-occupied |
| Less than $5,000 | 10 (3.1%) | 8 (4.9%) |
| $5,000 to $9,999 | 0 (0.0%) | 0 (0.0%) |
| $10,000 to $14,999 | 0 (0.0%) | 40 (24.7%) |
| $15,000 to $19,999 | 22 (6.7%) | 9 (5.6%) |
| $20,000 to $24,999 | 27 (8.3%) | 21 (13.0%) |
| $25,000 to $34,999 | 31 (9.5%) | 9 (5.6%) |
| $35,000 to $49,999 | 33 (10.1%) | 17 (10.5%) |
| $50,000 to $74,999 | 86 (26.3%) | 31 (19.1%) |
| $75,000 to $99,999 | 48 (14.7%) | 17 (10.5%) |
| $100,000 to $149,999 | 53 (16.2%) | 10 (6.2%) |
| $150,000 or more | 17 (5.2%) | 0 (0.0%) |
| Total | 327 (100.0%) | 162 (100.0%) |
Monthly Housing Cost Tiers in Lowellville
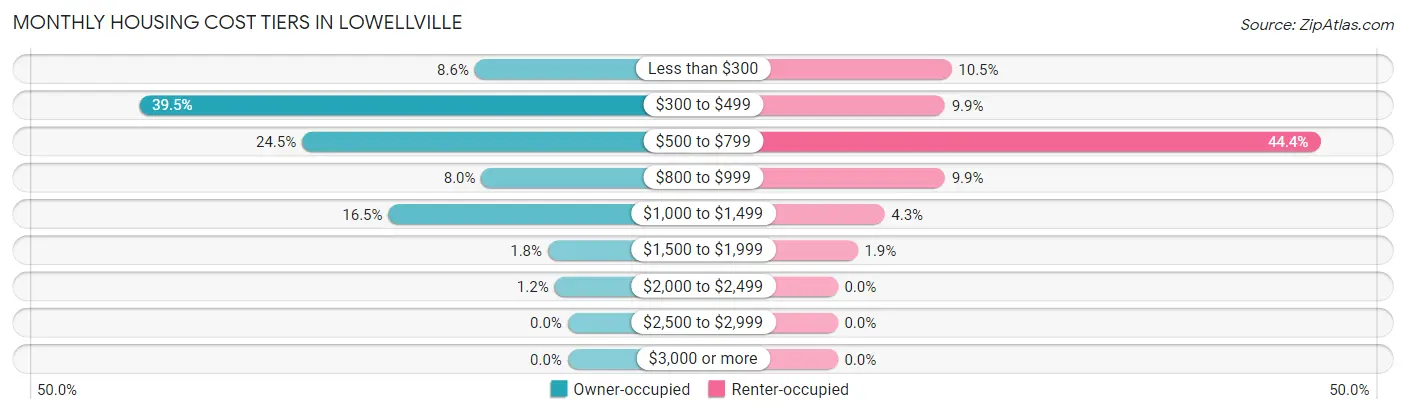
| Monthly Cost | Owner-occupied | Renter-occupied |
| Less than $300 | 28 (8.6%) | 17 (10.5%) |
| $300 to $499 | 129 (39.5%) | 16 (9.9%) |
| $500 to $799 | 80 (24.5%) | 72 (44.4%) |
| $800 to $999 | 26 (8.0%) | 16 (9.9%) |
| $1,000 to $1,499 | 54 (16.5%) | 7 (4.3%) |
| $1,500 to $1,999 | 6 (1.8%) | 3 (1.8%) |
| $2,000 to $2,499 | 4 (1.2%) | 0 (0.0%) |
| $2,500 to $2,999 | 0 (0.0%) | 0 (0.0%) |
| $3,000 or more | 0 (0.0%) | 0 (0.0%) |
| Total | 327 (100.0%) | 162 (100.0%) |
Physical Housing Characteristics in Lowellville
Housing Structures in Lowellville
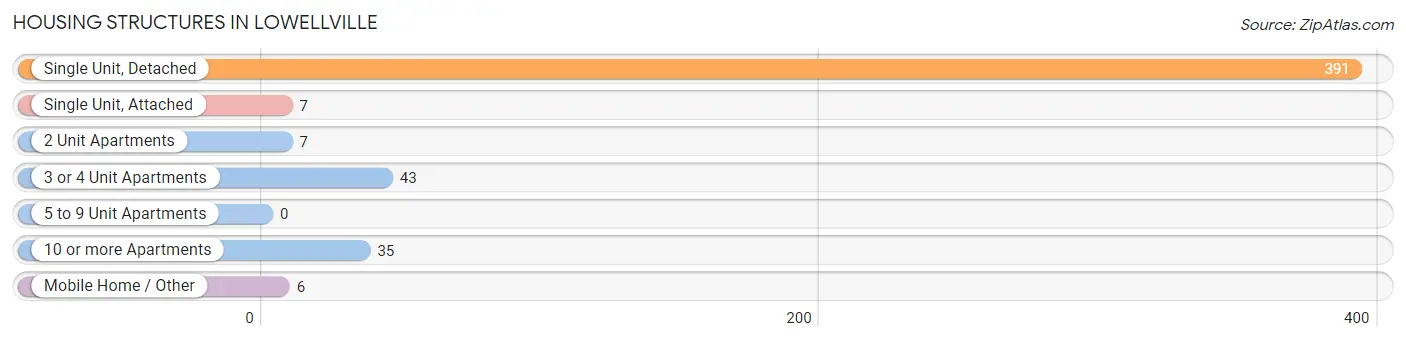
| Structure Type | # Housing Units | % Housing Units |
| Single Unit, Detached | 391 | 80.0% |
| Single Unit, Attached | 7 | 1.4% |
| 2 Unit Apartments | 7 | 1.4% |
| 3 or 4 Unit Apartments | 43 | 8.8% |
| 5 to 9 Unit Apartments | 0 | 0.0% |
| 10 or more Apartments | 35 | 7.2% |
| Mobile Home / Other | 6 | 1.2% |
| Total | 489 | 100.0% |
Housing Structures by Occupancy in Lowellville
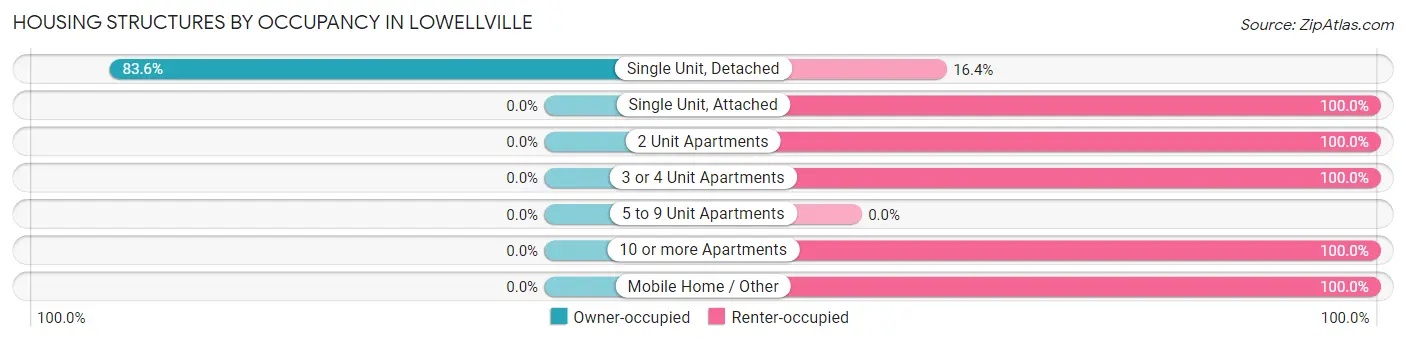
| Structure Type | Owner-occupied | Renter-occupied |
| Single Unit, Detached | 327 (83.6%) | 64 (16.4%) |
| Single Unit, Attached | 0 (0.0%) | 7 (100.0%) |
| 2 Unit Apartments | 0 (0.0%) | 7 (100.0%) |
| 3 or 4 Unit Apartments | 0 (0.0%) | 43 (100.0%) |
| 5 to 9 Unit Apartments | 0 (0.0%) | 0 (0.0%) |
| 10 or more Apartments | 0 (0.0%) | 35 (100.0%) |
| Mobile Home / Other | 0 (0.0%) | 6 (100.0%) |
| Total | 327 (66.9%) | 162 (33.1%) |
Housing Structures by Number of Rooms in Lowellville
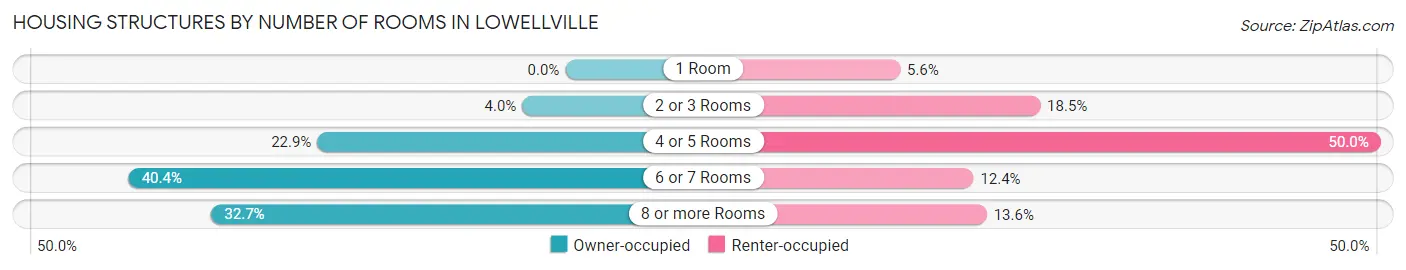
| Number of Rooms | Owner-occupied | Renter-occupied |
| 1 Room | 0 (0.0%) | 9 (5.6%) |
| 2 or 3 Rooms | 13 (4.0%) | 30 (18.5%) |
| 4 or 5 Rooms | 75 (22.9%) | 81 (50.0%) |
| 6 or 7 Rooms | 132 (40.4%) | 20 (12.3%) |
| 8 or more Rooms | 107 (32.7%) | 22 (13.6%) |
| Total | 327 (100.0%) | 162 (100.0%) |
Housing Structure by Heating Type in Lowellville
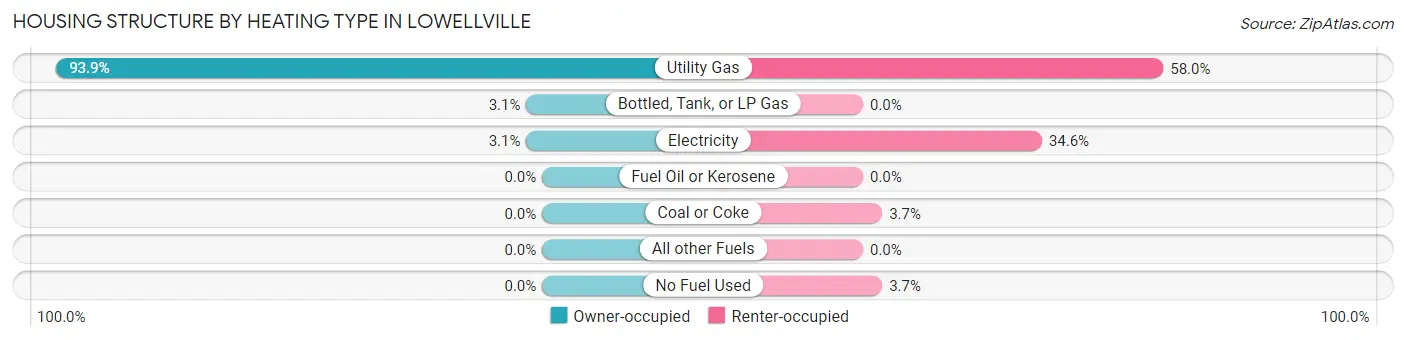
| Heating Type | Owner-occupied | Renter-occupied |
| Utility Gas | 307 (93.9%) | 94 (58.0%) |
| Bottled, Tank, or LP Gas | 10 (3.1%) | 0 (0.0%) |
| Electricity | 10 (3.1%) | 56 (34.6%) |
| Fuel Oil or Kerosene | 0 (0.0%) | 0 (0.0%) |
| Coal or Coke | 0 (0.0%) | 6 (3.7%) |
| All other Fuels | 0 (0.0%) | 0 (0.0%) |
| No Fuel Used | 0 (0.0%) | 6 (3.7%) |
| Total | 327 (100.0%) | 162 (100.0%) |
Household Vehicle Usage in Lowellville
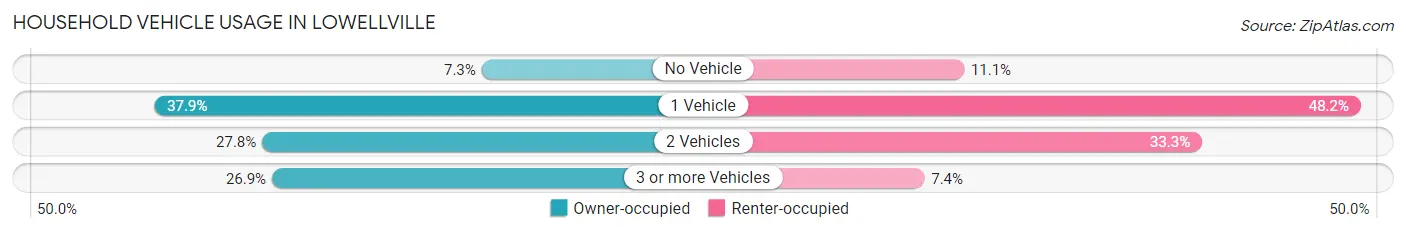
| Vehicles per Household | Owner-occupied | Renter-occupied |
| No Vehicle | 24 (7.3%) | 18 (11.1%) |
| 1 Vehicle | 124 (37.9%) | 78 (48.1%) |
| 2 Vehicles | 91 (27.8%) | 54 (33.3%) |
| 3 or more Vehicles | 88 (26.9%) | 12 (7.4%) |
| Total | 327 (100.0%) | 162 (100.0%) |
Real Estate & Mortgages in Lowellville
Real Estate and Mortgage Overview in Lowellville
| Characteristic | Without Mortgage | With Mortgage |
| Housing Units | 183 | 144 |
| Median Property Value | $73,500 | $92,900 |
| Median Household Income | $51,597 | $17 |
| Monthly Housing Costs | $378 | $0 |
| Real Estate Taxes | $839 | $10 |
Property Value by Mortgage Status in Lowellville
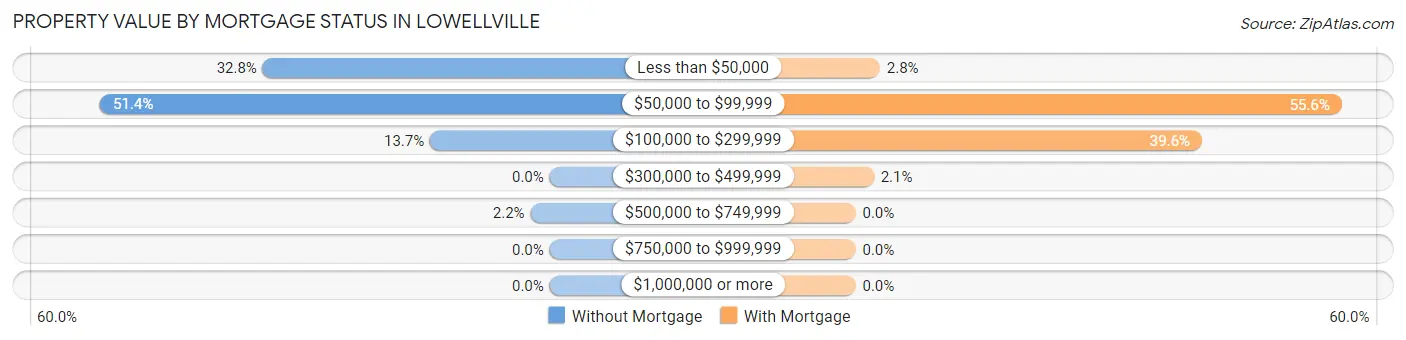
| Property Value | Without Mortgage | With Mortgage |
| Less than $50,000 | 60 (32.8%) | 4 (2.8%) |
| $50,000 to $99,999 | 94 (51.4%) | 80 (55.6%) |
| $100,000 to $299,999 | 25 (13.7%) | 57 (39.6%) |
| $300,000 to $499,999 | 0 (0.0%) | 3 (2.1%) |
| $500,000 to $749,999 | 4 (2.2%) | 0 (0.0%) |
| $750,000 to $999,999 | 0 (0.0%) | 0 (0.0%) |
| $1,000,000 or more | 0 (0.0%) | 0 (0.0%) |
| Total | 183 (100.0%) | 144 (100.0%) |
Household Income by Mortgage Status in Lowellville
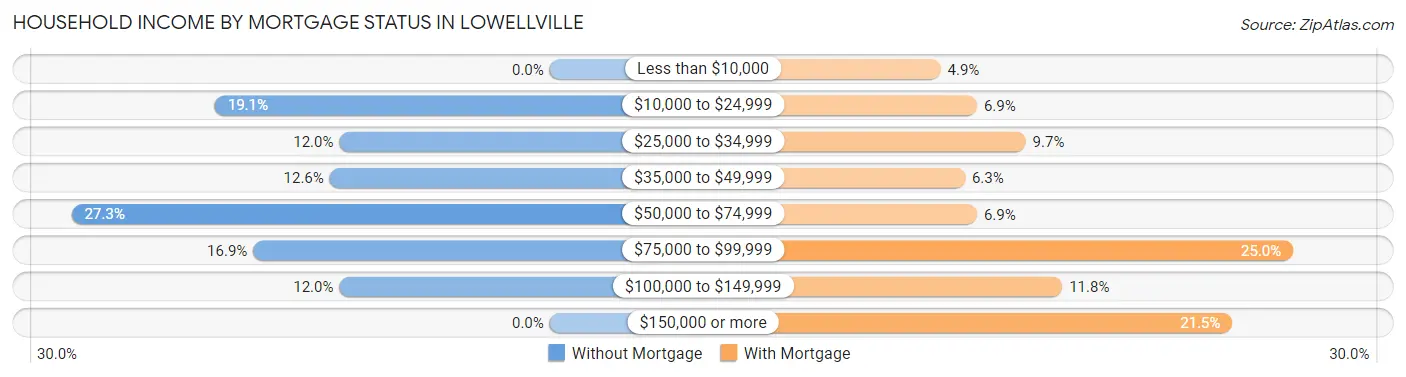
| Household Income | Without Mortgage | With Mortgage |
| Less than $10,000 | 0 (0.0%) | 7 (4.9%) |
| $10,000 to $24,999 | 35 (19.1%) | 10 (6.9%) |
| $25,000 to $34,999 | 22 (12.0%) | 14 (9.7%) |
| $35,000 to $49,999 | 23 (12.6%) | 9 (6.2%) |
| $50,000 to $74,999 | 50 (27.3%) | 10 (6.9%) |
| $75,000 to $99,999 | 31 (16.9%) | 36 (25.0%) |
| $100,000 to $149,999 | 22 (12.0%) | 17 (11.8%) |
| $150,000 or more | 0 (0.0%) | 31 (21.5%) |
| Total | 183 (100.0%) | 144 (100.0%) |
Property Value to Household Income Ratio in Lowellville
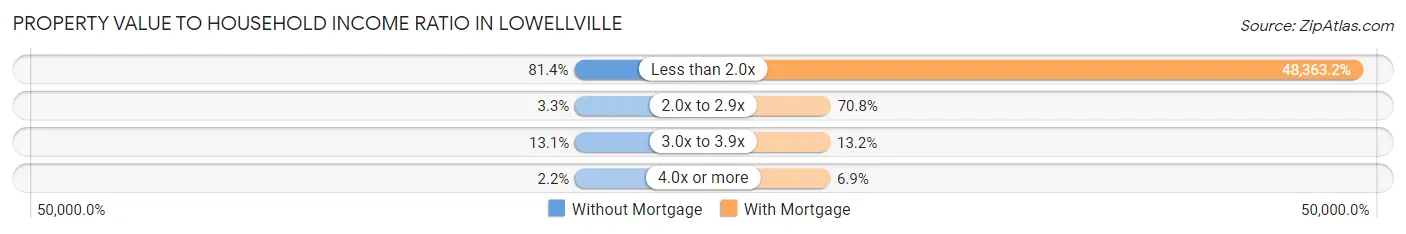
| Value-to-Income Ratio | Without Mortgage | With Mortgage |
| Less than 2.0x | 149 (81.4%) | 69,643 (48,363.2%) |
| 2.0x to 2.9x | 6 (3.3%) | 102 (70.8%) |
| 3.0x to 3.9x | 24 (13.1%) | 19 (13.2%) |
| 4.0x or more | 4 (2.2%) | 10 (6.9%) |
| Total | 183 (100.0%) | 144 (100.0%) |
Real Estate Taxes by Mortgage Status in Lowellville
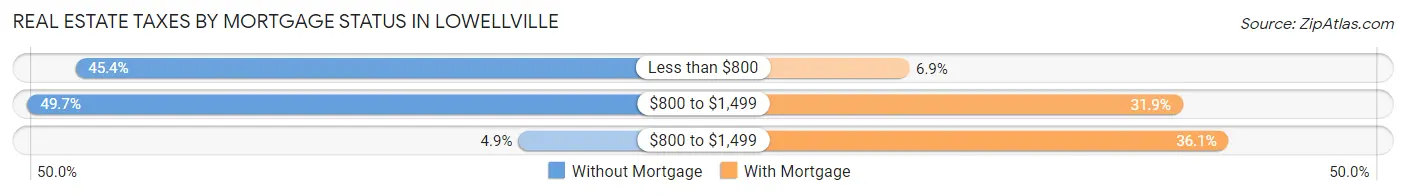
| Property Taxes | Without Mortgage | With Mortgage |
| Less than $800 | 83 (45.4%) | 10 (6.9%) |
| $800 to $1,499 | 91 (49.7%) | 46 (31.9%) |
| $800 to $1,499 | 9 (4.9%) | 52 (36.1%) |
| Total | 183 (100.0%) | 144 (100.0%) |
Health & Disability in Lowellville
Health Insurance Coverage by Age in Lowellville
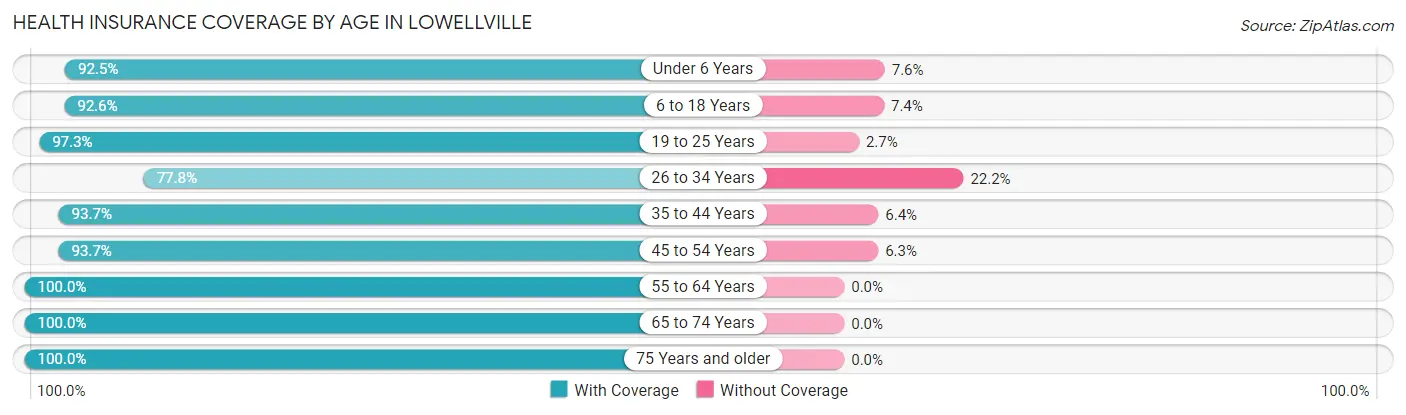
| Age Bracket | With Coverage | Without Coverage |
| Under 6 Years | 49 (92.4%) | 4 (7.5%) |
| 6 to 18 Years | 75 (92.6%) | 6 (7.4%) |
| 19 to 25 Years | 107 (97.3%) | 3 (2.7%) |
| 26 to 34 Years | 140 (77.8%) | 40 (22.2%) |
| 35 to 44 Years | 59 (93.6%) | 4 (6.4%) |
| 45 to 54 Years | 163 (93.7%) | 11 (6.3%) |
| 55 to 64 Years | 194 (100.0%) | 0 (0.0%) |
| 65 to 74 Years | 145 (100.0%) | 0 (0.0%) |
| 75 Years and older | 102 (100.0%) | 0 (0.0%) |
| Total | 1,034 (93.8%) | 68 (6.2%) |
Health Insurance Coverage by Citizenship Status in Lowellville
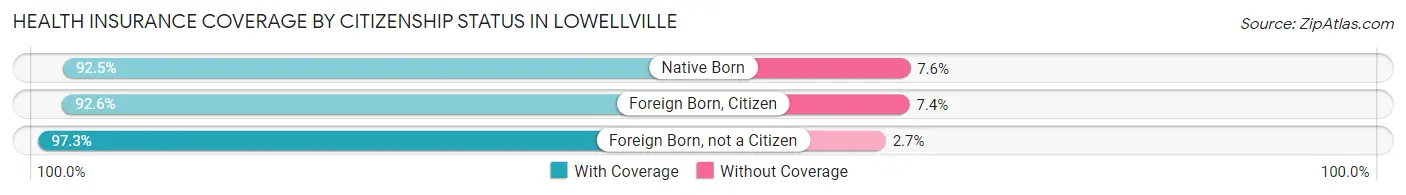
| Citizenship Status | With Coverage | Without Coverage |
| Native Born | 49 (92.4%) | 4 (7.5%) |
| Foreign Born, Citizen | 75 (92.6%) | 6 (7.4%) |
| Foreign Born, not a Citizen | 107 (97.3%) | 3 (2.7%) |
Health Insurance Coverage by Household Income in Lowellville
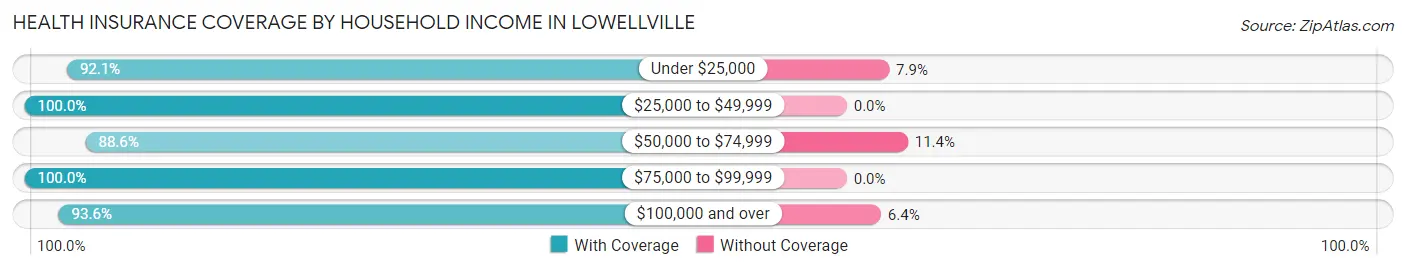
| Household Income | With Coverage | Without Coverage |
| Under $25,000 | 255 (92.1%) | 22 (7.9%) |
| $25,000 to $49,999 | 180 (100.0%) | 0 (0.0%) |
| $50,000 to $74,999 | 248 (88.6%) | 32 (11.4%) |
| $75,000 to $99,999 | 146 (100.0%) | 0 (0.0%) |
| $100,000 and over | 205 (93.6%) | 14 (6.4%) |
Public vs Private Health Insurance Coverage by Age in Lowellville
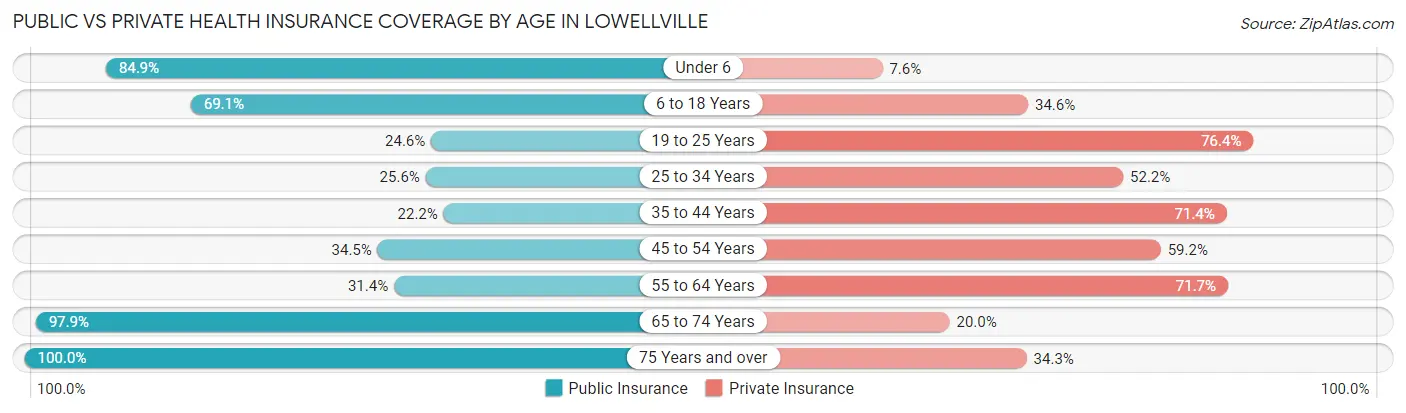
| Age Bracket | Public Insurance | Private Insurance |
| Under 6 | 45 (84.9%) | 4 (7.5%) |
| 6 to 18 Years | 56 (69.1%) | 28 (34.6%) |
| 19 to 25 Years | 27 (24.5%) | 84 (76.4%) |
| 25 to 34 Years | 46 (25.6%) | 94 (52.2%) |
| 35 to 44 Years | 14 (22.2%) | 45 (71.4%) |
| 45 to 54 Years | 60 (34.5%) | 103 (59.2%) |
| 55 to 64 Years | 61 (31.4%) | 139 (71.7%) |
| 65 to 74 Years | 142 (97.9%) | 29 (20.0%) |
| 75 Years and over | 102 (100.0%) | 35 (34.3%) |
| Total | 553 (50.2%) | 561 (50.9%) |
Disability Status by Sex by Age in Lowellville
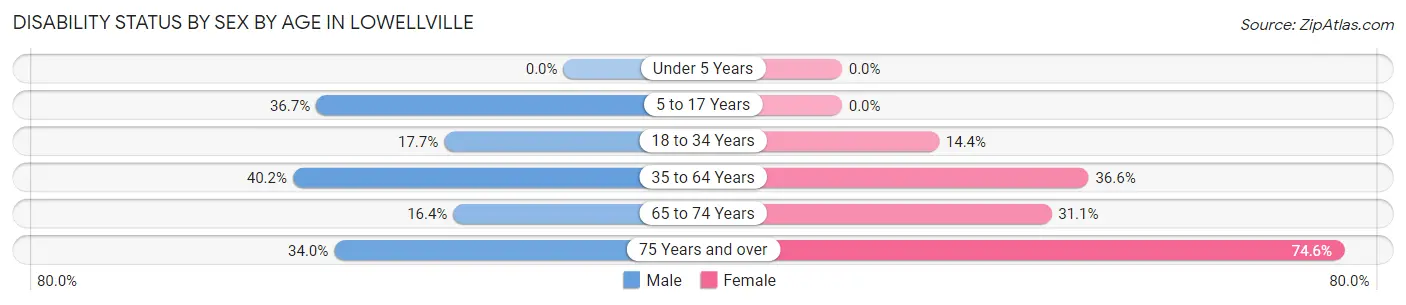
| Age Bracket | Male | Female |
| Under 5 Years | 0 (0.0%) | 0 (0.0%) |
| 5 to 17 Years | 18 (36.7%) | 0 (0.0%) |
| 18 to 34 Years | 31 (17.7%) | 17 (14.4%) |
| 35 to 64 Years | 92 (40.2%) | 74 (36.6%) |
| 65 to 74 Years | 9 (16.4%) | 28 (31.1%) |
| 75 Years and over | 16 (34.0%) | 41 (74.6%) |
Disability Class by Sex by Age in Lowellville
Disability Class: Hearing Difficulty
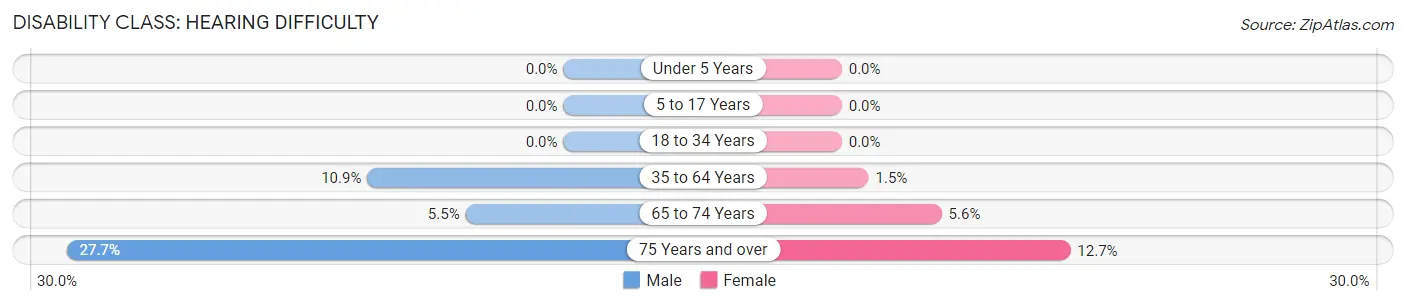
| Age Bracket | Male | Female |
| Under 5 Years | 0 (0.0%) | 0 (0.0%) |
| 5 to 17 Years | 0 (0.0%) | 0 (0.0%) |
| 18 to 34 Years | 0 (0.0%) | 0 (0.0%) |
| 35 to 64 Years | 25 (10.9%) | 3 (1.5%) |
| 65 to 74 Years | 3 (5.4%) | 5 (5.6%) |
| 75 Years and over | 13 (27.7%) | 7 (12.7%) |
Disability Class: Vision Difficulty
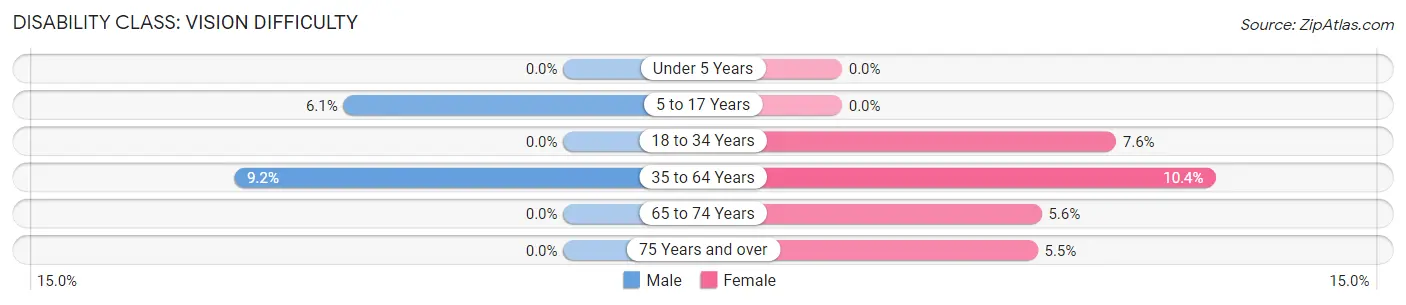
| Age Bracket | Male | Female |
| Under 5 Years | 0 (0.0%) | 0 (0.0%) |
| 5 to 17 Years | 3 (6.1%) | 0 (0.0%) |
| 18 to 34 Years | 0 (0.0%) | 9 (7.6%) |
| 35 to 64 Years | 21 (9.2%) | 21 (10.4%) |
| 65 to 74 Years | 0 (0.0%) | 5 (5.6%) |
| 75 Years and over | 0 (0.0%) | 3 (5.4%) |
Disability Class: Cognitive Difficulty
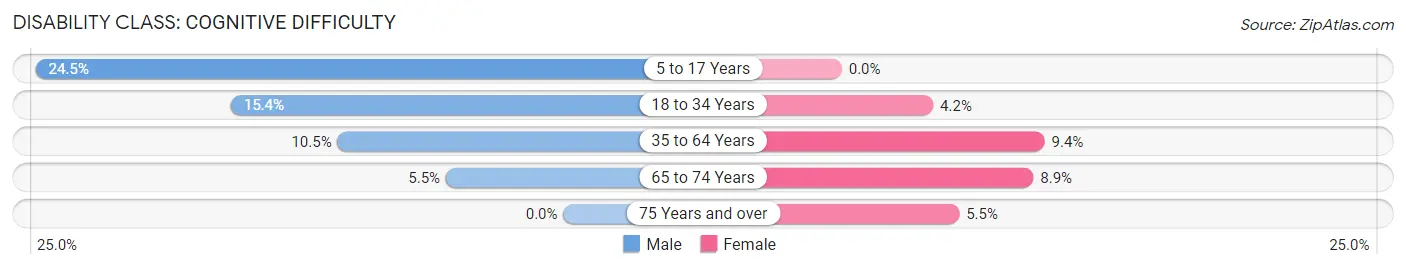
| Age Bracket | Male | Female |
| 5 to 17 Years | 12 (24.5%) | 0 (0.0%) |
| 18 to 34 Years | 27 (15.4%) | 5 (4.2%) |
| 35 to 64 Years | 24 (10.5%) | 19 (9.4%) |
| 65 to 74 Years | 3 (5.4%) | 8 (8.9%) |
| 75 Years and over | 0 (0.0%) | 3 (5.4%) |
Disability Class: Ambulatory Difficulty
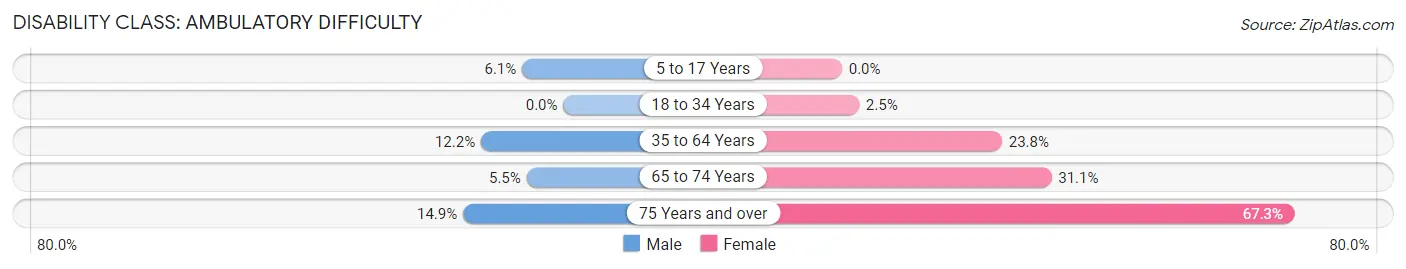
| Age Bracket | Male | Female |
| 5 to 17 Years | 3 (6.1%) | 0 (0.0%) |
| 18 to 34 Years | 0 (0.0%) | 3 (2.5%) |
| 35 to 64 Years | 28 (12.2%) | 48 (23.8%) |
| 65 to 74 Years | 3 (5.4%) | 28 (31.1%) |
| 75 Years and over | 7 (14.9%) | 37 (67.3%) |
Disability Class: Self-Care Difficulty
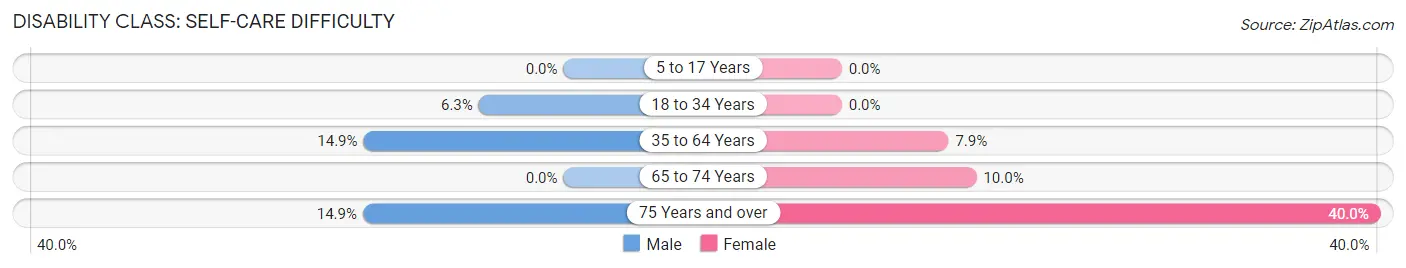
| Age Bracket | Male | Female |
| 5 to 17 Years | 0 (0.0%) | 0 (0.0%) |
| 18 to 34 Years | 11 (6.3%) | 0 (0.0%) |
| 35 to 64 Years | 34 (14.8%) | 16 (7.9%) |
| 65 to 74 Years | 0 (0.0%) | 9 (10.0%) |
| 75 Years and over | 7 (14.9%) | 22 (40.0%) |
Technology Access in Lowellville
Computing Device Access in Lowellville
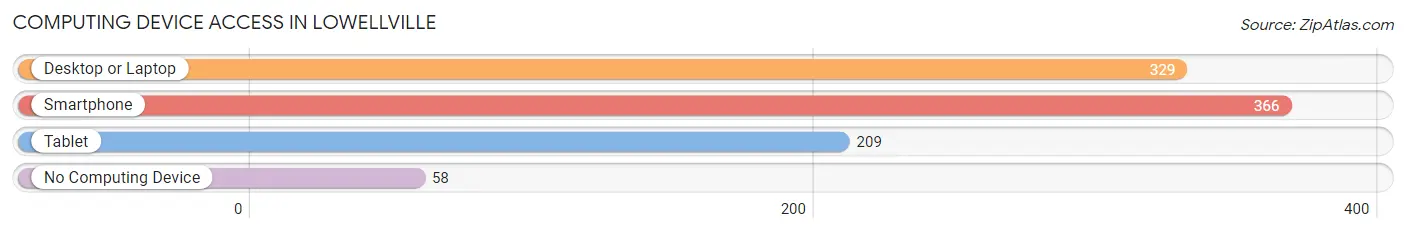
| Device Type | # Households | % Households |
| Desktop or Laptop | 329 | 67.3% |
| Smartphone | 366 | 74.9% |
| Tablet | 209 | 42.7% |
| No Computing Device | 58 | 11.9% |
| Total | 489 | 100.0% |
Internet Access in Lowellville
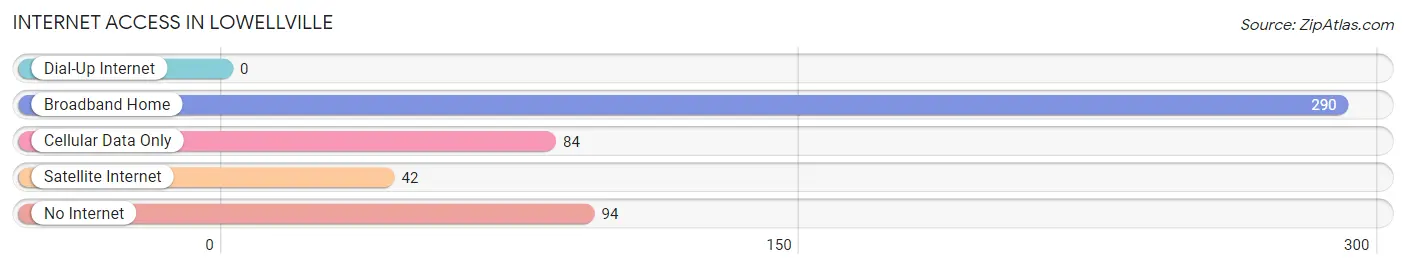
| Internet Type | # Households | % Households |
| Dial-Up Internet | 0 | 0.0% |
| Broadband Home | 290 | 59.3% |
| Cellular Data Only | 84 | 17.2% |
| Satellite Internet | 42 | 8.6% |
| No Internet | 94 | 19.2% |
| Total | 489 | 100.0% |
Lowellville Summary
Lowellville, Ohio is a small village located in Mahoning County, Ohio. It is situated along the Mahoning River, approximately 20 miles southeast of Youngstown. The village has a population of 1,068 as of the 2010 census.
History
Lowellville was founded in 1802 by John Lowell, a Revolutionary War veteran. The village was originally known as Lowell's Mills, and was the first settlement in Mahoning County. The village was incorporated in 1837.
In the early 19th century, Lowellville was a major center for the production of woolen goods. The village was home to several mills, including the Lowellville Woolen Mill, which was established in 1820. The mill was destroyed by fire in 1845, but was rebuilt and continued to operate until the early 20th century.
In the late 19th century, Lowellville was a major center for the production of iron and steel. The village was home to several steel mills, including the Lowellville Iron and Steel Company, which was established in 1883. The company was later acquired by the Youngstown Sheet and Tube Company in the early 20th century.
Geography
Lowellville is located at 41°10'N 80°41'W (41.17, -80.68). The village has a total area of 0.9 square miles, all of which is land.
The village is situated along the Mahoning River, which flows through the village from north to south. The village is located in the Appalachian Plateau region of Ohio.
Economy
The economy of Lowellville is largely based on agriculture and manufacturing. The village is home to several small businesses, including a grocery store, a hardware store, and a restaurant.
The village is also home to several manufacturing companies, including the Lowellville Iron and Steel Company, which produces steel products. The village is also home to several small farms, which produce a variety of crops, including corn, soybeans, and wheat.
Demographics
As of the 2010 census, the population of Lowellville was 1,068. The racial makeup of the village was 97.2% White, 0.7% African American, 0.2% Native American, 0.2% Asian, 0.2% from other races, and 1.7% from two or more races. Hispanic or Latino of any race were 0.9% of the population.
The median household income in Lowellville was $41,250, and the median family income was $48,750. The per capita income for the village was $19,945. About 8.2% of families and 10.2% of the population were below the poverty line, including 14.3% of those under age 18 and 6.3% of those age 65 or over.
Common Questions
What is Per Capita Income in Lowellville?
Per Capita income in Lowellville is $28,381.
What is the Median Family Income in Lowellville?
Median Family Income in Lowellville is $58,750.
What is the Median Household income in Lowellville?
Median Household Income in Lowellville is $51,458.
What is Income or Wage Gap in Lowellville?
Income or Wage Gap in Lowellville is 48.7%.
Women in Lowellville earn 51.3 cents for every dollar earned by a man.
What is Family Income Deficit in Lowellville?
Family Income Deficit in Lowellville is $18,810.
Families that are below poverty line in Lowellville earn $18,810 less on average than the poverty threshold level.
What is Inequality or Gini Index in Lowellville?
Inequality or Gini Index in Lowellville is 0.40.
What is the Total Population of Lowellville?
Total Population of Lowellville is 1,102.
What is the Total Male Population of Lowellville?
Total Male Population of Lowellville is 584.
What is the Total Female Population of Lowellville?
Total Female Population of Lowellville is 518.
What is the Ratio of Males per 100 Females in Lowellville?
There are 112.74 Males per 100 Females in Lowellville.
What is the Ratio of Females per 100 Males in Lowellville?
There are 88.70 Females per 100 Males in Lowellville.
What is the Median Population Age in Lowellville?
Median Population Age in Lowellville is 48.6 Years.
What is the Average Family Size in Lowellville
Average Family Size in Lowellville is 2.9 People.
What is the Average Household Size in Lowellville
Average Household Size in Lowellville is 2.2 People.
How Large is the Labor Force in Lowellville?
There are 559 People in the Labor Forcein in Lowellville.
What is the Percentage of People in the Labor Force in Lowellville?
57.0% of People are in the Labor Force in Lowellville.
What is the Unemployment Rate in Lowellville?
Unemployment Rate in Lowellville is 4.3%.