Lodi, OH Map & Demographics
Lodi Map
Lodi Overview
$27,735
PER CAPITA INCOME
$65,057
AVG FAMILY INCOME
$55,284
AVG HOUSEHOLD INCOME
32.9%
WAGE / INCOME GAP [ % ]
67.1¢/ $1
WAGE / INCOME GAP [ $ ]
0.33
INEQUALITY / GINI INDEX
2,764
TOTAL POPULATION
1,347
MALE POPULATION
1,417
FEMALE POPULATION
95.06
MALES / 100 FEMALES
105.20
FEMALES / 100 MALES
40.6
MEDIAN AGE
2.8
AVG FAMILY SIZE
2.2
AVG HOUSEHOLD SIZE
1,555
LABOR FORCE [ PEOPLE ]
69.0%
PERCENT IN LABOR FORCE
3.7%
UNEMPLOYMENT RATE
Lodi Zip Codes
Income in Lodi
Income Overview in Lodi
Per Capita Income in Lodi is $27,735, while median incomes of families and households are $65,057 and $55,284 respectively.
| Characteristic | Number | Measure |
| Per Capita Income | 2,764 | $27,735 |
| Median Family Income | 717 | $65,057 |
| Mean Family Income | 717 | $73,408 |
| Median Household Income | 1,226 | $55,284 |
| Mean Household Income | 1,226 | $61,722 |
| Income Deficit | 717 | $0 |
| Wage / Income Gap (%) | 2,764 | 32.86% |
| Wage / Income Gap ($) | 2,764 | 67.14¢ per $1 |
| Gini / Inequality Index | 2,764 | 0.33 |
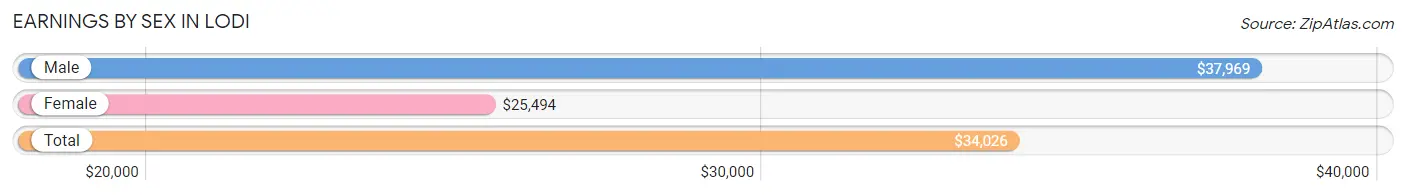
Earnings by Sex in Lodi
Average Earnings in Lodi are $34,026, $37,969 for men and $25,494 for women, a difference of 32.9%.
| Sex | Number | Average Earnings |
| Male | 911 (58.5%) | $37,969 |
| Female | 647 (41.5%) | $25,494 |
| Total | 1,558 (100.0%) | $34,026 |
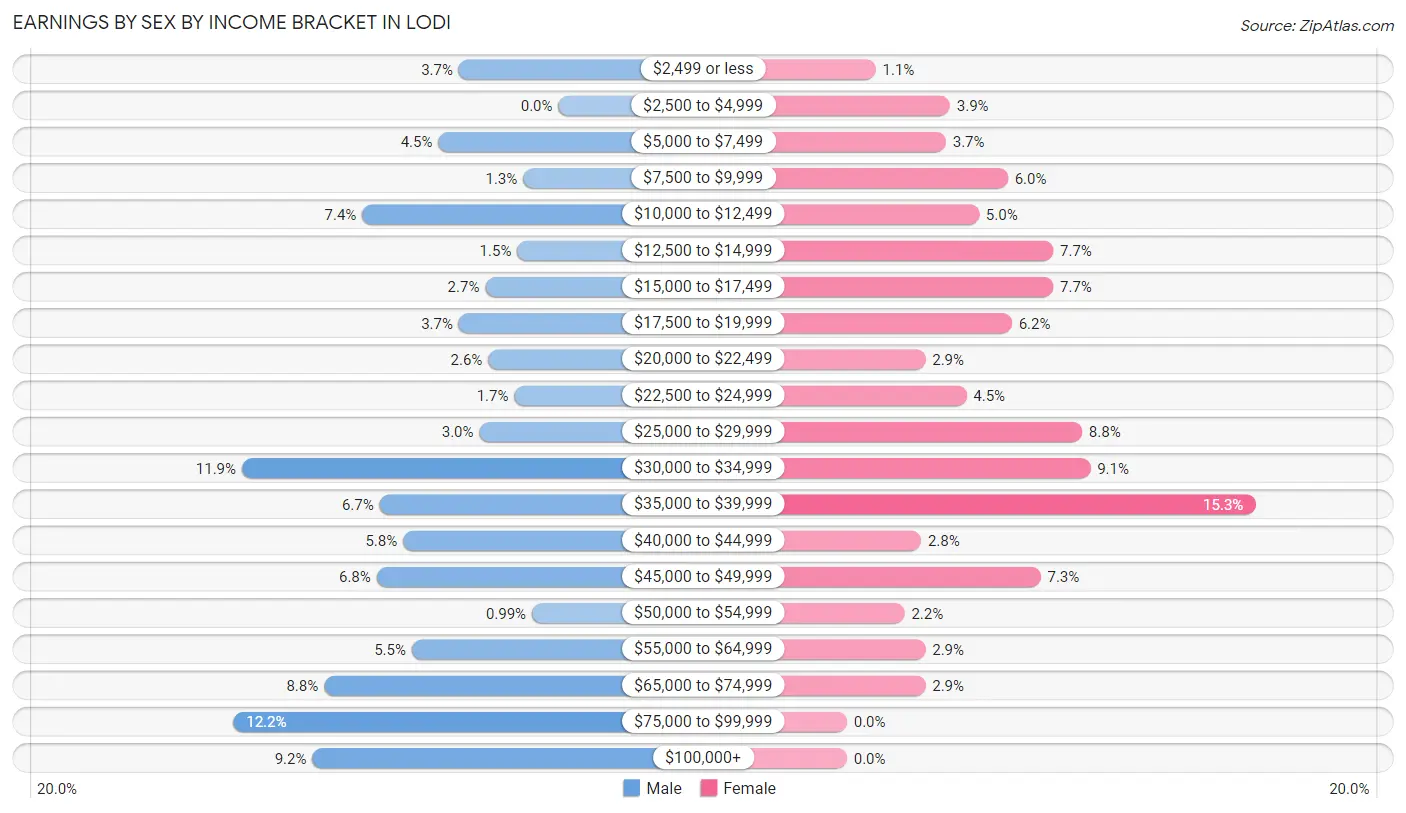
Earnings by Sex by Income Bracket in Lodi
The most common earnings brackets in Lodi are $75,000 to $99,999 for men (111 | 12.2%) and $35,000 to $39,999 for women (99 | 15.3%).
| Income | Male | Female |
| $2,499 or less | 34 (3.7%) | 7 (1.1%) |
| $2,500 to $4,999 | 0 (0.0%) | 25 (3.9%) |
| $5,000 to $7,499 | 41 (4.5%) | 24 (3.7%) |
| $7,500 to $9,999 | 12 (1.3%) | 39 (6.0%) |
| $10,000 to $12,499 | 67 (7.3%) | 32 (5.0%) |
| $12,500 to $14,999 | 14 (1.5%) | 50 (7.7%) |
| $15,000 to $17,499 | 25 (2.7%) | 50 (7.7%) |
| $17,500 to $19,999 | 34 (3.7%) | 40 (6.2%) |
| $20,000 to $22,499 | 24 (2.6%) | 19 (2.9%) |
| $22,500 to $24,999 | 15 (1.7%) | 29 (4.5%) |
| $25,000 to $29,999 | 27 (3.0%) | 57 (8.8%) |
| $30,000 to $34,999 | 108 (11.9%) | 59 (9.1%) |
| $35,000 to $39,999 | 61 (6.7%) | 99 (15.3%) |
| $40,000 to $44,999 | 53 (5.8%) | 18 (2.8%) |
| $45,000 to $49,999 | 62 (6.8%) | 47 (7.3%) |
| $50,000 to $54,999 | 9 (1.0%) | 14 (2.2%) |
| $55,000 to $64,999 | 50 (5.5%) | 19 (2.9%) |
| $65,000 to $74,999 | 80 (8.8%) | 19 (2.9%) |
| $75,000 to $99,999 | 111 (12.2%) | 0 (0.0%) |
| $100,000+ | 84 (9.2%) | 0 (0.0%) |
| Total | 911 (100.0%) | 647 (100.0%) |
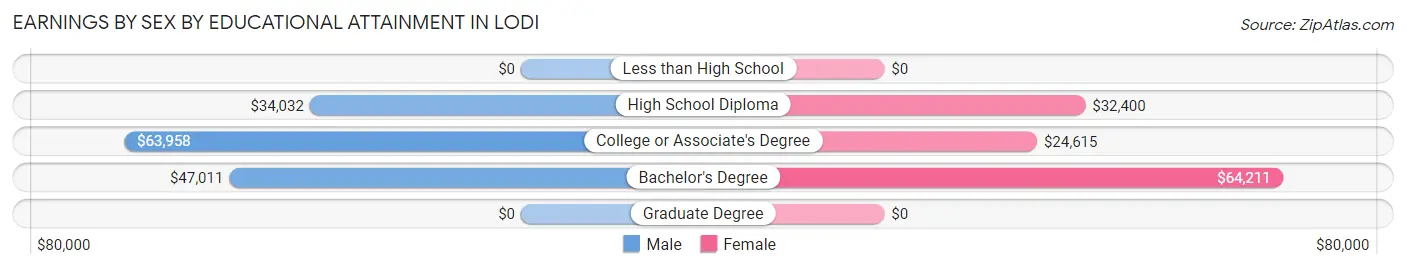
Earnings by Sex by Educational Attainment in Lodi
Average earnings in Lodi are $40,896 for men and $31,450 for women, a difference of 23.1%. Men with an educational attainment of college or associate's degree enjoy the highest average annual earnings of $63,958, while those with high school diploma education earn the least with $34,032. Women with an educational attainment of bachelor's degree earn the most with the average annual earnings of $64,211, while those with college or associate's degree education have the smallest earnings of $24,615.
| Educational Attainment | Male Income | Female Income |
| Less than High School | - | - |
| High School Diploma | $34,032 | $32,400 |
| College or Associate's Degree | $63,958 | $24,615 |
| Bachelor's Degree | $47,011 | $64,211 |
| Graduate Degree | - | - |
| Total | $40,896 | $31,450 |
Family Income in Lodi
Family Income Brackets in Lodi
According to the Lodi family income data, there are 215 families falling into the $50,000 to $74,999 income range, which is the most common income bracket and makes up 30.0% of all families.
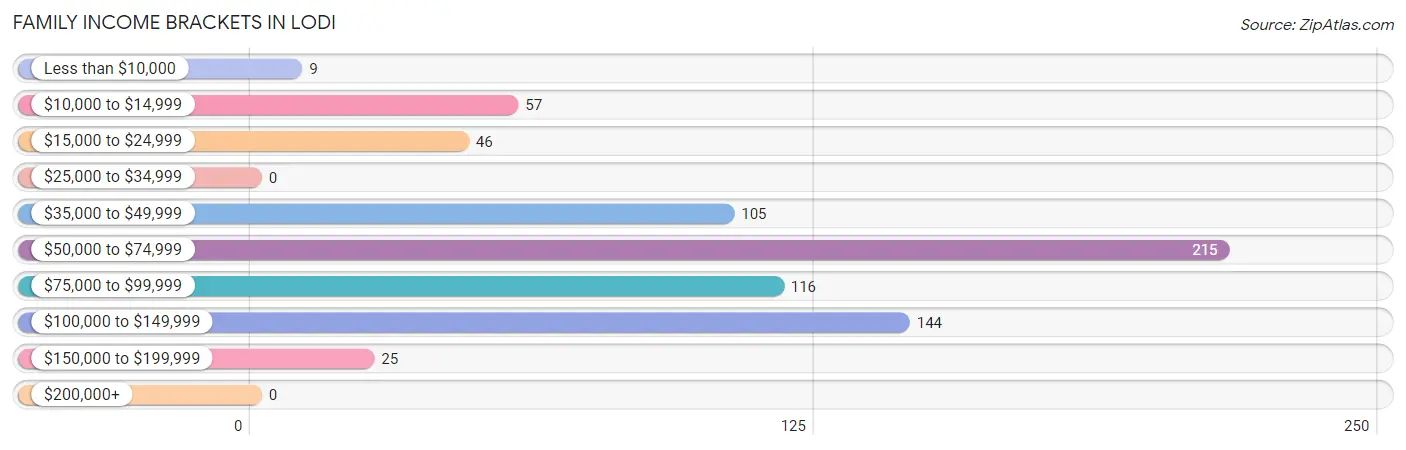
| Income Bracket | # Families | % Families |
| Less than $10,000 | 9 | 1.3% |
| $10,000 to $14,999 | 57 | 7.9% |
| $15,000 to $24,999 | 46 | 6.4% |
| $25,000 to $34,999 | 0 | 0.0% |
| $35,000 to $49,999 | 105 | 14.6% |
| $50,000 to $74,999 | 215 | 30.0% |
| $75,000 to $99,999 | 116 | 16.2% |
| $100,000 to $149,999 | 144 | 20.1% |
| $150,000 to $199,999 | 25 | 3.5% |
| $200,000+ | 0 | 0.0% |
Family Income by Famaliy Size in Lodi
4-person families (135 | 18.8%) account for the highest median family income in Lodi with $116,827 per family, while 2-person families (380 | 53.0%) have the highest median income of $31,406 per family member.
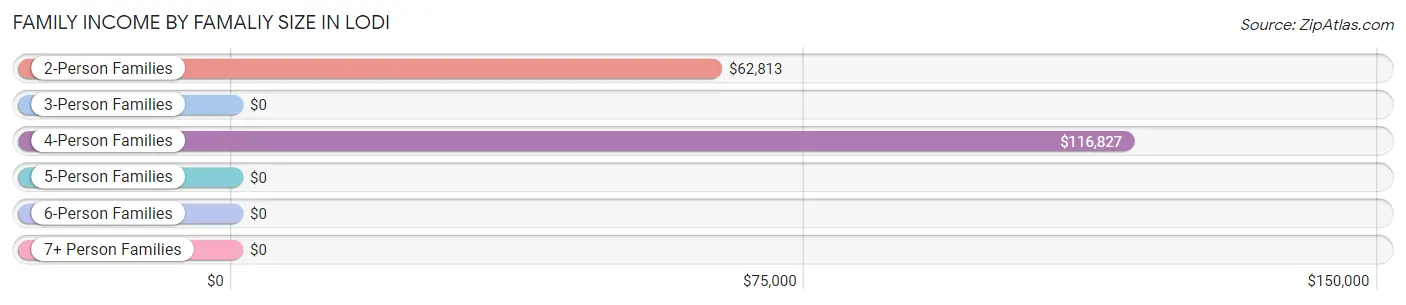
| Income Bracket | # Families | Median Income |
| 2-Person Families | 380 (53.0%) | $62,813 |
| 3-Person Families | 146 (20.4%) | $0 |
| 4-Person Families | 135 (18.8%) | $116,827 |
| 5-Person Families | 56 (7.8%) | $0 |
| 6-Person Families | 0 (0.0%) | $0 |
| 7+ Person Families | 0 (0.0%) | $0 |
| Total | 717 (100.0%) | $65,057 |
Family Income by Number of Earners in Lodi
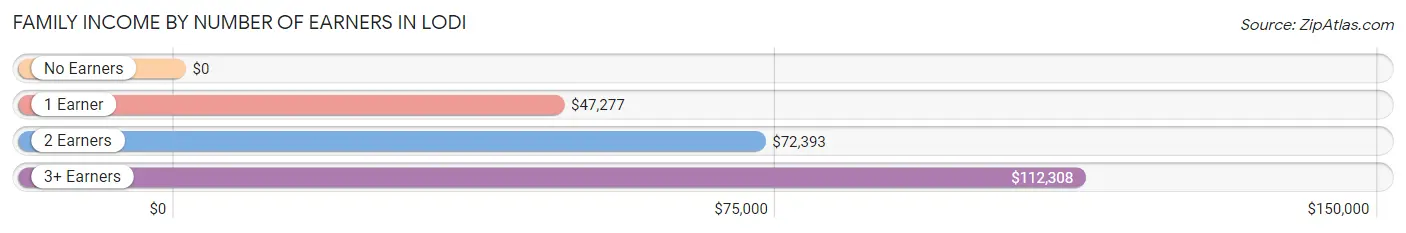
| Number of Earners | # Families | Median Income |
| No Earners | 129 (18.0%) | $0 |
| 1 Earner | 195 (27.2%) | $47,277 |
| 2 Earners | 323 (45.1%) | $72,393 |
| 3+ Earners | 70 (9.8%) | $112,308 |
| Total | 717 (100.0%) | $65,057 |
Household Income in Lodi
Household Income Brackets in Lodi
With 337 households falling in the category, the $50,000 to $74,999 income range is the most frequent in Lodi, accounting for 27.5% of all households.
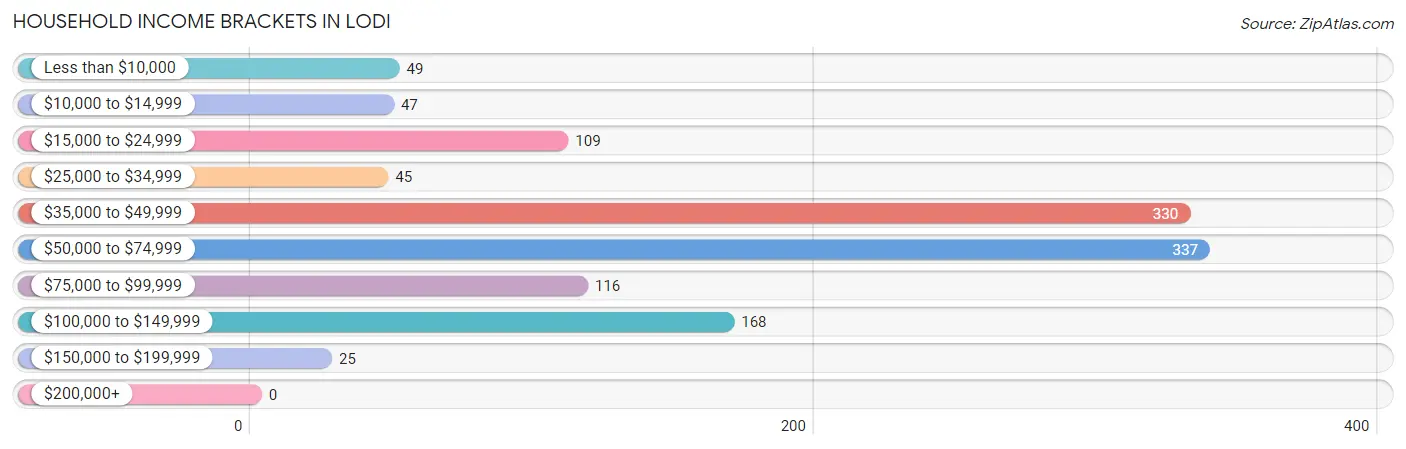
| Income Bracket | # Households | % Households |
| Less than $10,000 | 49 | 4.0% |
| $10,000 to $14,999 | 47 | 3.8% |
| $15,000 to $24,999 | 109 | 8.9% |
| $25,000 to $34,999 | 45 | 3.7% |
| $35,000 to $49,999 | 330 | 26.9% |
| $50,000 to $74,999 | 337 | 27.5% |
| $75,000 to $99,999 | 116 | 9.5% |
| $100,000 to $149,999 | 168 | 13.7% |
| $150,000 to $199,999 | 25 | 2.0% |
| $200,000+ | 0 | 0.0% |
Household Income by Householder Age in Lodi
The median household income in Lodi is $55,284, with the highest median household income of $65,000 found in the 25 to 44 years age bracket for the primary householder. A total of 444 households (36.2%) fall into this category. Meanwhile, the 15 to 24 years age bracket for the primary householder has the lowest median household income of $0, with 36 households (2.9%) in this group.
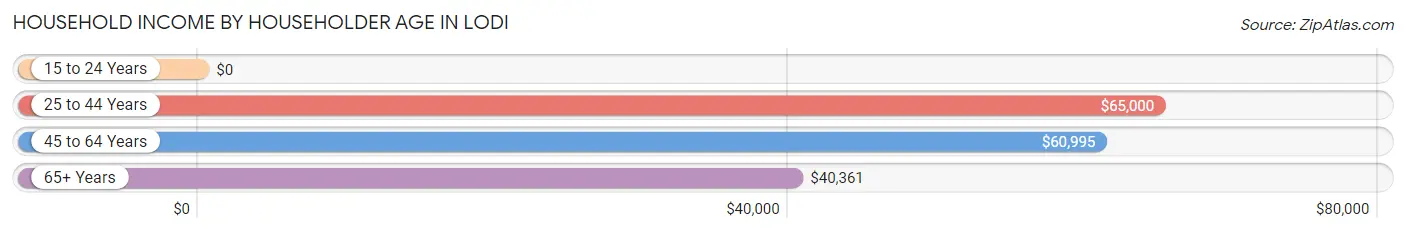
| Income Bracket | # Households | Median Income |
| 15 to 24 Years | 36 (2.9%) | $0 |
| 25 to 44 Years | 444 (36.2%) | $65,000 |
| 45 to 64 Years | 433 (35.3%) | $60,995 |
| 65+ Years | 313 (25.5%) | $40,361 |
| Total | 1,226 (100.0%) | $55,284 |
Poverty in Lodi
Income Below Poverty by Sex and Age in Lodi
With 7.3% poverty level for males and 16.0% for females among the residents of Lodi, 6 to 11 year old males and 6 to 11 year old females are the most vulnerable to poverty, with 53 males (86.9%) and 59 females (36.6%) in their respective age groups living below the poverty level.
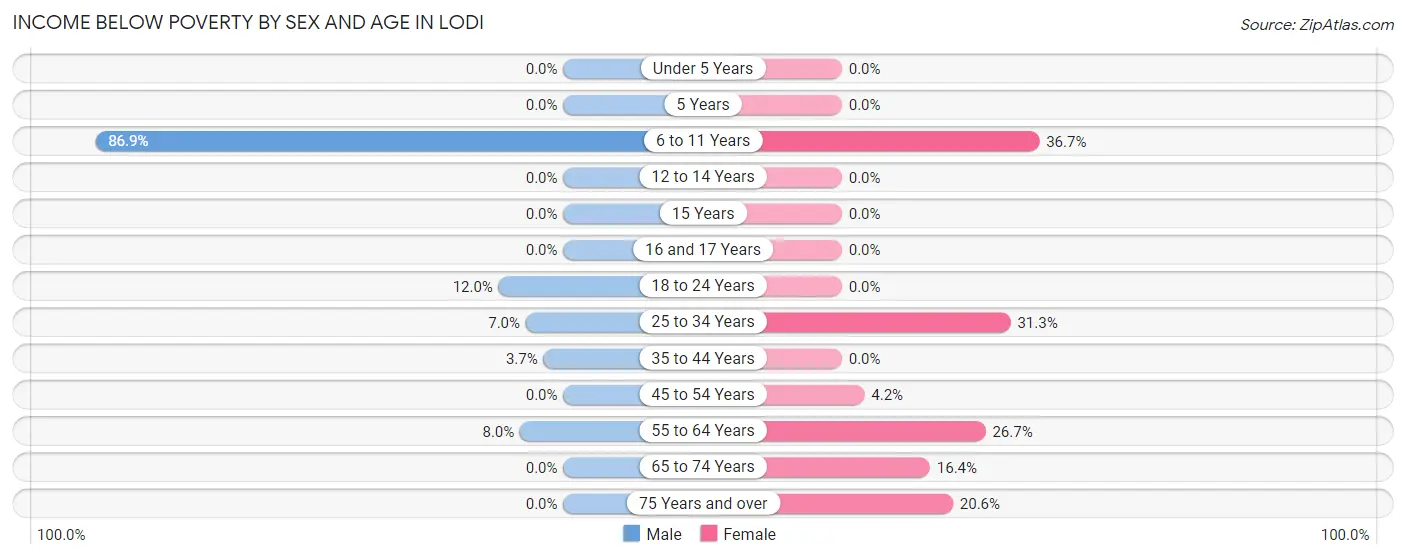
| Age Bracket | Male | Female |
| Under 5 Years | 0 (0.0%) | 0 (0.0%) |
| 5 Years | 0 (0.0%) | 0 (0.0%) |
| 6 to 11 Years | 53 (86.9%) | 59 (36.6%) |
| 12 to 14 Years | 0 (0.0%) | 0 (0.0%) |
| 15 Years | 0 (0.0%) | 0 (0.0%) |
| 16 and 17 Years | 0 (0.0%) | 0 (0.0%) |
| 18 to 24 Years | 6 (12.0%) | 0 (0.0%) |
| 25 to 34 Years | 11 (7.0%) | 62 (31.3%) |
| 35 to 44 Years | 12 (3.7%) | 0 (0.0%) |
| 45 to 54 Years | 0 (0.0%) | 9 (4.2%) |
| 55 to 64 Years | 17 (8.0%) | 44 (26.7%) |
| 65 to 74 Years | 0 (0.0%) | 26 (16.4%) |
| 75 Years and over | 0 (0.0%) | 27 (20.6%) |
| Total | 99 (7.3%) | 227 (16.0%) |
Income Above Poverty by Sex and Age in Lodi
According to the poverty statistics in Lodi, males aged under 5 years and females aged under 5 years are the age groups that are most secure financially, with 100.0% of males and 100.0% of females in these age groups living above the poverty line.
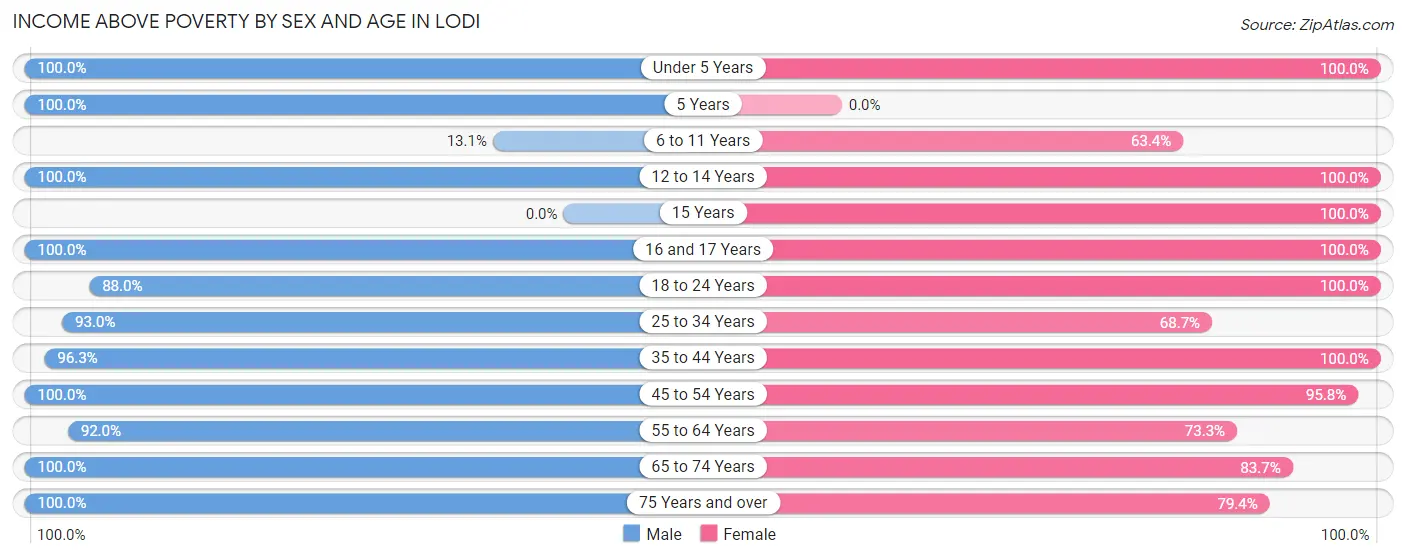
| Age Bracket | Male | Female |
| Under 5 Years | 89 (100.0%) | 101 (100.0%) |
| 5 Years | 29 (100.0%) | 0 (0.0%) |
| 6 to 11 Years | 8 (13.1%) | 102 (63.3%) |
| 12 to 14 Years | 29 (100.0%) | 27 (100.0%) |
| 15 Years | 0 (0.0%) | 13 (100.0%) |
| 16 and 17 Years | 57 (100.0%) | 15 (100.0%) |
| 18 to 24 Years | 44 (88.0%) | 123 (100.0%) |
| 25 to 34 Years | 147 (93.0%) | 136 (68.7%) |
| 35 to 44 Years | 314 (96.3%) | 109 (100.0%) |
| 45 to 54 Years | 185 (100.0%) | 206 (95.8%) |
| 55 to 64 Years | 195 (92.0%) | 121 (73.3%) |
| 65 to 74 Years | 121 (100.0%) | 133 (83.7%) |
| 75 Years and over | 30 (100.0%) | 104 (79.4%) |
| Total | 1,248 (92.6%) | 1,190 (84.0%) |
Income Below Poverty Among Married-Couple Families in Lodi
The poverty statistics for married-couple families in Lodi show that 1.8% or 9 of the total 501 families live below the poverty line. Families with no children have the highest poverty rate of 2.8%, comprising of 9 families. On the other hand, families with 1 or 2 children have the lowest poverty rate of 0.0%, which includes 0 families.
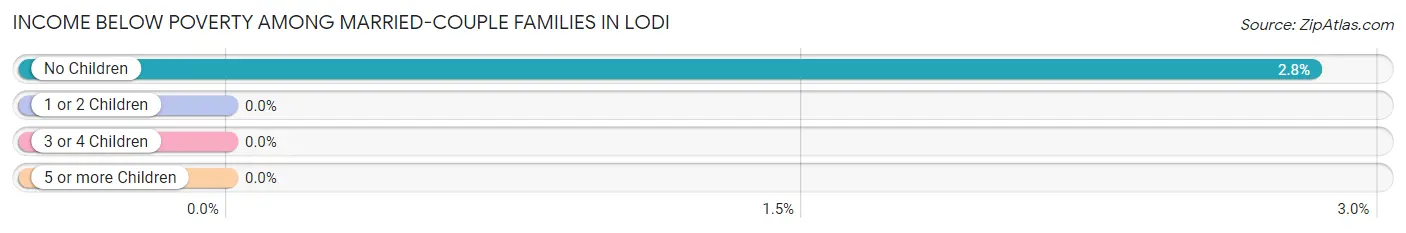
| Children | Above Poverty | Below Poverty |
| No Children | 309 (97.2%) | 9 (2.8%) |
| 1 or 2 Children | 127 (100.0%) | 0 (0.0%) |
| 3 or 4 Children | 56 (100.0%) | 0 (0.0%) |
| 5 or more Children | 0 (0.0%) | 0 (0.0%) |
| Total | 492 (98.2%) | 9 (1.8%) |
Income Below Poverty Among Single-Parent Households in Lodi
According to the poverty data in Lodi, 10.1% or 7 single-father households and 38.8% or 57 single-mother households are living below the poverty line. Among single-father households, those with 1 or 2 children have the highest poverty rate, with 7 households (21.2%) experiencing poverty. Likewise, among single-mother households, those with no children have the highest poverty rate, with 9 households (39.1%) falling below the poverty line.
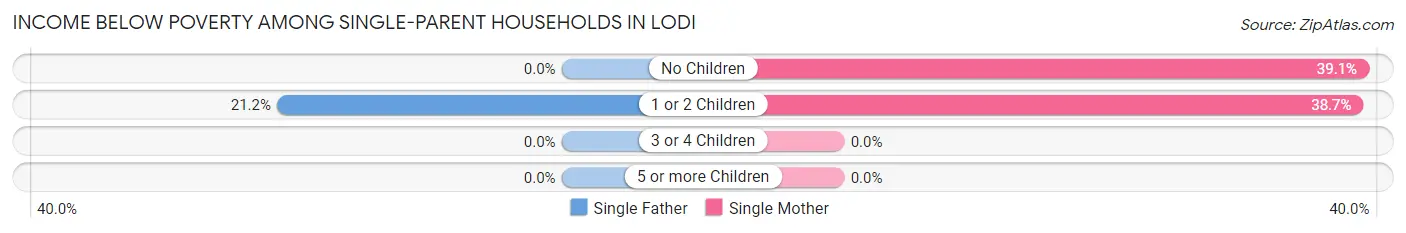
| Children | Single Father | Single Mother |
| No Children | 0 (0.0%) | 9 (39.1%) |
| 1 or 2 Children | 7 (21.2%) | 48 (38.7%) |
| 3 or 4 Children | 0 (0.0%) | 0 (0.0%) |
| 5 or more Children | 0 (0.0%) | 0 (0.0%) |
| Total | 7 (10.1%) | 57 (38.8%) |
Income Below Poverty Among Married-Couple vs Single-Parent Households in Lodi
The poverty data for Lodi shows that 9 of the married-couple family households (1.8%) and 64 of the single-parent households (29.6%) are living below the poverty level. Within the married-couple family households, those with no children have the highest poverty rate, with 9 households (2.8%) falling below the poverty line. Among the single-parent households, those with 1 or 2 children have the highest poverty rate, with 55 household (35.0%) living below poverty.
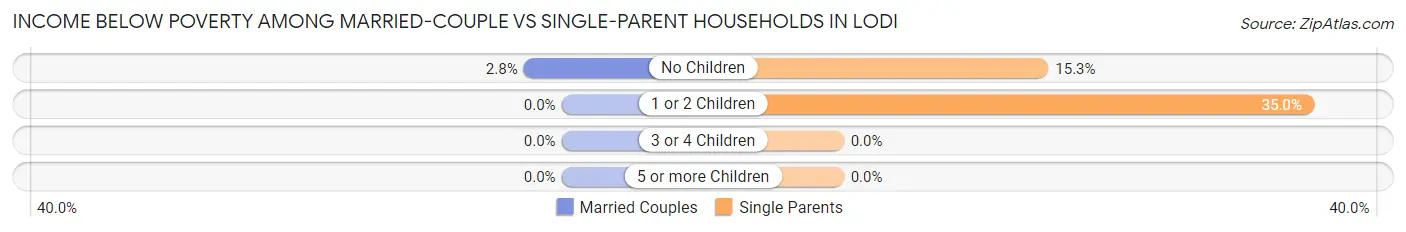
| Children | Married-Couple Families | Single-Parent Households |
| No Children | 9 (2.8%) | 9 (15.2%) |
| 1 or 2 Children | 0 (0.0%) | 55 (35.0%) |
| 3 or 4 Children | 0 (0.0%) | 0 (0.0%) |
| 5 or more Children | 0 (0.0%) | 0 (0.0%) |
| Total | 9 (1.8%) | 64 (29.6%) |
Race in Lodi
The most populous races in Lodi are White / Caucasian (2,617 | 94.7%), Asian (66 | 2.4%), and Hispanic or Latino (57 | 2.1%).
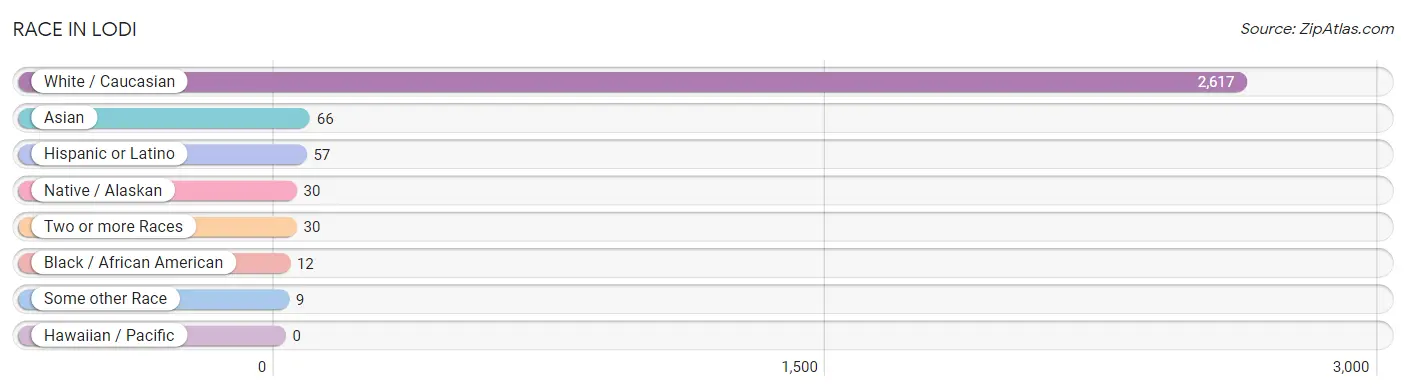
| Race | # Population | % Population |
| Asian | 66 | 2.4% |
| Black / African American | 12 | 0.4% |
| Hawaiian / Pacific | 0 | 0.0% |
| Hispanic or Latino | 57 | 2.1% |
| Native / Alaskan | 30 | 1.1% |
| White / Caucasian | 2,617 | 94.7% |
| Two or more Races | 30 | 1.1% |
| Some other Race | 9 | 0.3% |
| Total | 2,764 | 100.0% |
Ancestry in Lodi
The most populous ancestries reported in Lodi are German (635 | 23.0%), Irish (413 | 14.9%), English (323 | 11.7%), Polish (263 | 9.5%), and American (190 | 6.9%), together accounting for 66.0% of all Lodi residents.
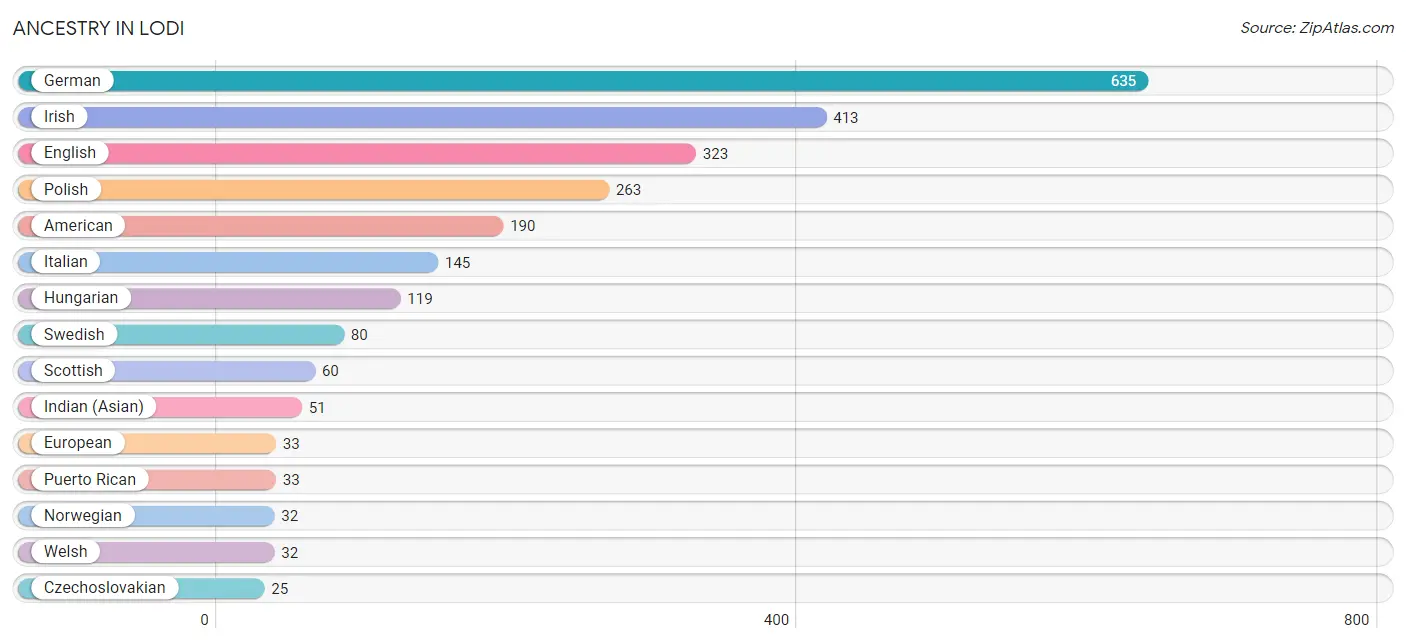
| Ancestry | # Population | % Population |
| American | 190 | 6.9% |
| Cherokee | 5 | 0.2% |
| Cuban | 15 | 0.5% |
| Czech | 7 | 0.3% |
| Czechoslovakian | 25 | 0.9% |
| English | 323 | 11.7% |
| European | 33 | 1.2% |
| French | 23 | 0.8% |
| German | 635 | 23.0% |
| Greek | 7 | 0.3% |
| Hungarian | 119 | 4.3% |
| Indian (Asian) | 51 | 1.8% |
| Irish | 413 | 14.9% |
| Italian | 145 | 5.2% |
| Korean | 25 | 0.9% |
| Mexican | 9 | 0.3% |
| Norwegian | 32 | 1.2% |
| Polish | 263 | 9.5% |
| Puerto Rican | 33 | 1.2% |
| Scotch-Irish | 14 | 0.5% |
| Scottish | 60 | 2.2% |
| Slovak | 6 | 0.2% |
| Swedish | 80 | 2.9% |
| Welsh | 32 | 1.2% |
| Yugoslavian | 24 | 0.9% | View All 25 Rows |
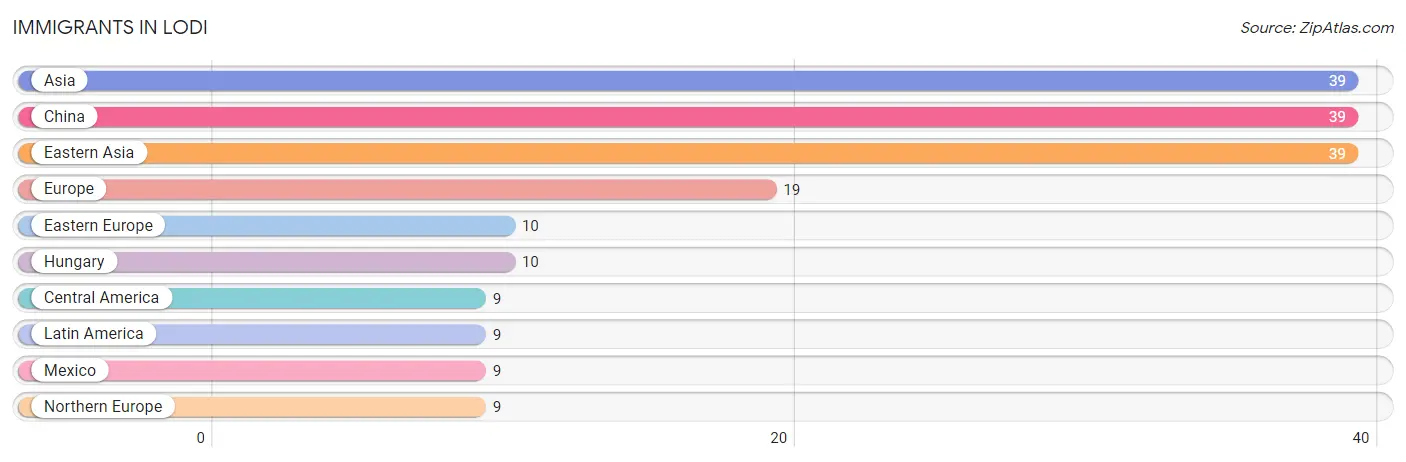
Immigrants in Lodi
The most numerous immigrant groups reported in Lodi came from Asia (39 | 1.4%), China (39 | 1.4%), Eastern Asia (39 | 1.4%), Europe (19 | 0.7%), and Eastern Europe (10 | 0.4%), together accounting for 5.3% of all Lodi residents.
| Immigration Origin | # Population | % Population |
| Asia | 39 | 1.4% |
| Central America | 9 | 0.3% |
| China | 39 | 1.4% |
| Eastern Asia | 39 | 1.4% |
| Eastern Europe | 10 | 0.4% |
| Europe | 19 | 0.7% |
| Hungary | 10 | 0.4% |
| Latin America | 9 | 0.3% |
| Mexico | 9 | 0.3% |
| Northern Europe | 9 | 0.3% | View All 10 Rows |
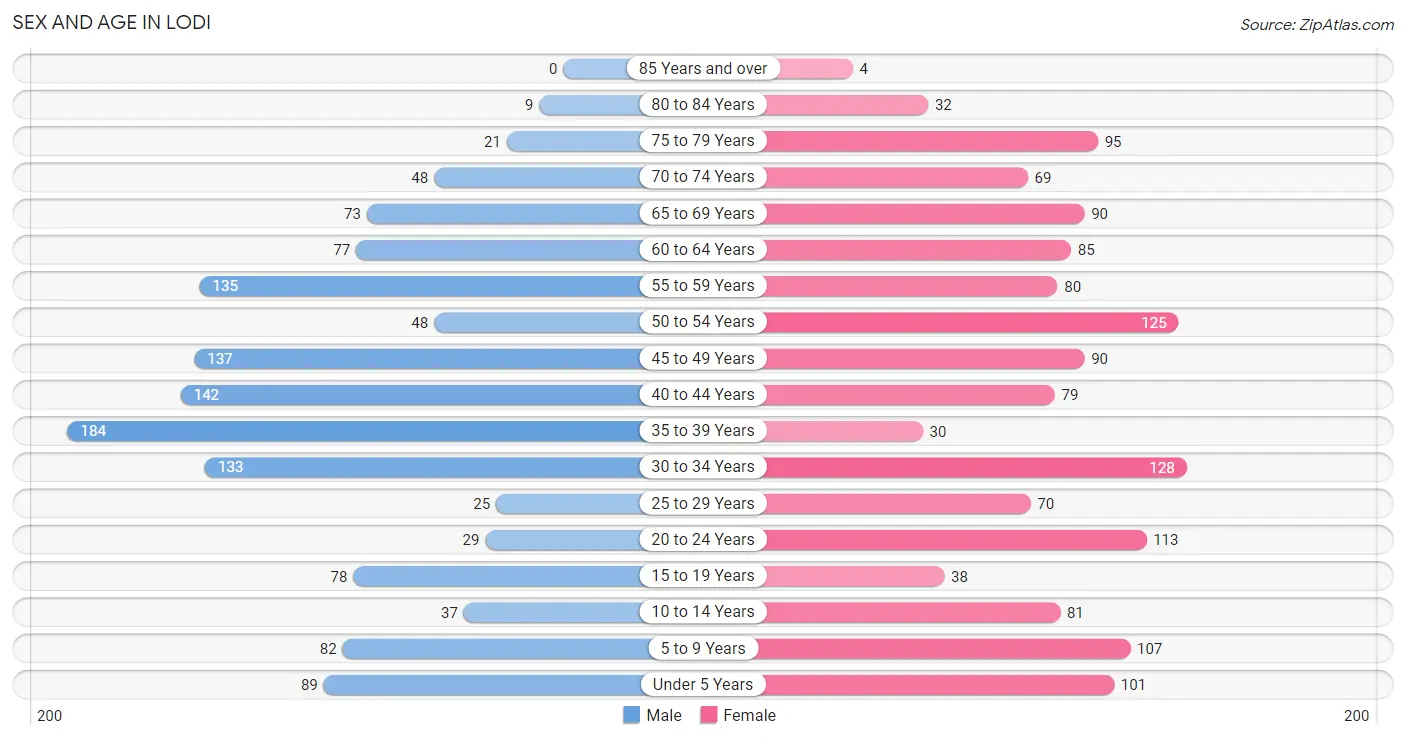
Sex and Age in Lodi
Sex and Age in Lodi
The most populous age groups in Lodi are 35 to 39 Years (184 | 13.7%) for men and 30 to 34 Years (128 | 9.0%) for women.
| Age Bracket | Male | Female |
| Under 5 Years | 89 (6.6%) | 101 (7.1%) |
| 5 to 9 Years | 82 (6.1%) | 107 (7.5%) |
| 10 to 14 Years | 37 (2.8%) | 81 (5.7%) |
| 15 to 19 Years | 78 (5.8%) | 38 (2.7%) |
| 20 to 24 Years | 29 (2.1%) | 113 (8.0%) |
| 25 to 29 Years | 25 (1.9%) | 70 (4.9%) |
| 30 to 34 Years | 133 (9.9%) | 128 (9.0%) |
| 35 to 39 Years | 184 (13.7%) | 30 (2.1%) |
| 40 to 44 Years | 142 (10.5%) | 79 (5.6%) |
| 45 to 49 Years | 137 (10.2%) | 90 (6.4%) |
| 50 to 54 Years | 48 (3.6%) | 125 (8.8%) |
| 55 to 59 Years | 135 (10.0%) | 80 (5.7%) |
| 60 to 64 Years | 77 (5.7%) | 85 (6.0%) |
| 65 to 69 Years | 73 (5.4%) | 90 (6.4%) |
| 70 to 74 Years | 48 (3.6%) | 69 (4.9%) |
| 75 to 79 Years | 21 (1.6%) | 95 (6.7%) |
| 80 to 84 Years | 9 (0.7%) | 32 (2.3%) |
| 85 Years and over | 0 (0.0%) | 4 (0.3%) |
| Total | 1,347 (100.0%) | 1,417 (100.0%) |
Families and Households in Lodi
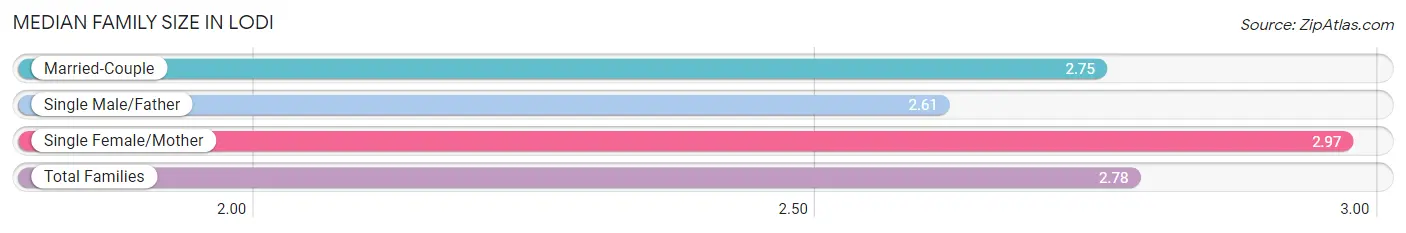
Median Family Size in Lodi
The median family size in Lodi is 2.78 persons per family, with single female/mother families (147 | 20.5%) accounting for the largest median family size of 2.97 persons per family. On the other hand, single male/father families (69 | 9.6%) represent the smallest median family size with 2.61 persons per family.
| Family Type | # Families | Family Size |
| Married-Couple | 501 (69.9%) | 2.75 |
| Single Male/Father | 69 (9.6%) | 2.61 |
| Single Female/Mother | 147 (20.5%) | 2.97 |
| Total Families | 717 (100.0%) | 2.78 |
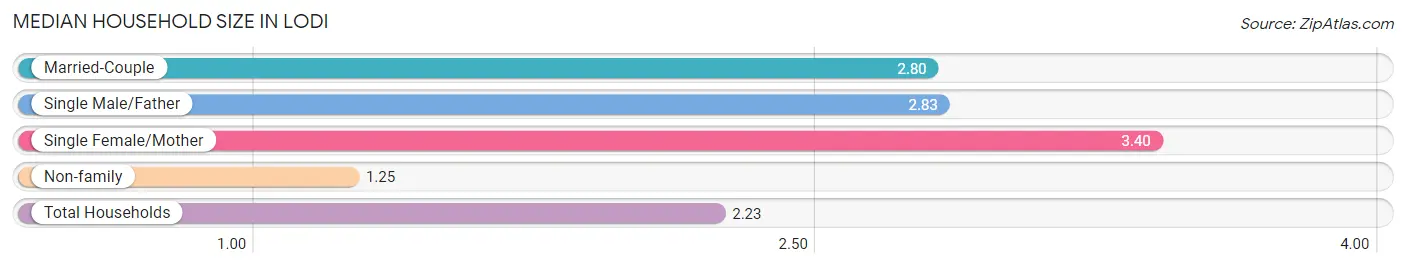
Median Household Size in Lodi
The median household size in Lodi is 2.23 persons per household, with single female/mother households (147 | 12.0%) accounting for the largest median household size of 3.4 persons per household. non-family households (509 | 41.5%) represent the smallest median household size with 1.25 persons per household.
| Household Type | # Households | Household Size |
| Married-Couple | 501 (40.9%) | 2.80 |
| Single Male/Father | 69 (5.6%) | 2.83 |
| Single Female/Mother | 147 (12.0%) | 3.40 |
| Non-family | 509 (41.5%) | 1.25 |
| Total Households | 1,226 (100.0%) | 2.23 |
Household Size by Marriage Status in Lodi
Out of a total of 1,226 households in Lodi, 717 (58.5%) are family households, while 509 (41.5%) are nonfamily households. The most numerous type of family households are 2-person households, comprising 373, and the most common type of nonfamily households are 1-person households, comprising 393.
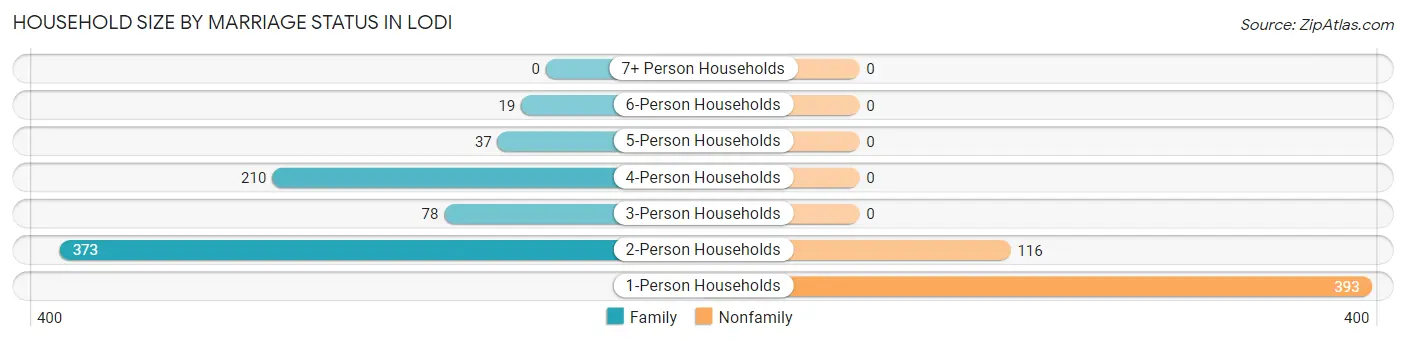
| Household Size | Family Households | Nonfamily Households |
| 1-Person Households | - | 393 (32.1%) |
| 2-Person Households | 373 (30.4%) | 116 (9.5%) |
| 3-Person Households | 78 (6.4%) | 0 (0.0%) |
| 4-Person Households | 210 (17.1%) | 0 (0.0%) |
| 5-Person Households | 37 (3.0%) | 0 (0.0%) |
| 6-Person Households | 19 (1.5%) | 0 (0.0%) |
| 7+ Person Households | 0 (0.0%) | 0 (0.0%) |
| Total | 717 (58.5%) | 509 (41.5%) |
Female Fertility in Lodi
Fertility by Age in Lodi
Average fertility rate in Lodi is 81.0 births per 1,000 women. Women in the age bracket of 20 to 34 years have the highest fertility rate with 125.0 births per 1,000 women. Women in the age bracket of 20 to 34 years acount for 83.0% of all women with births.
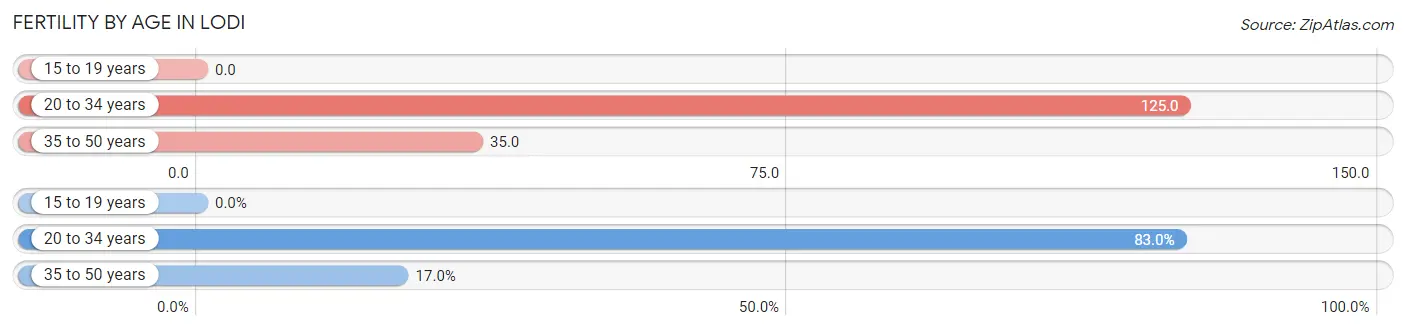
| Age Bracket | Women with Births | Births / 1,000 Women |
| 15 to 19 years | 0 (0.0%) | 0.0 |
| 20 to 34 years | 39 (83.0%) | 125.0 |
| 35 to 50 years | 8 (17.0%) | 35.0 |
| Total | 47 (100.0%) | 81.0 |
Fertility by Age by Marriage Status in Lodi
83.0% of women with births (47) in Lodi are married. The highest percentage of unmarried women with births falls into 35 to 50 years age bracket with 100.0% of them unmarried at the time of birth, while the lowest percentage of unmarried women with births belong to 20 to 34 years age bracket with 0.0% of them unmarried.
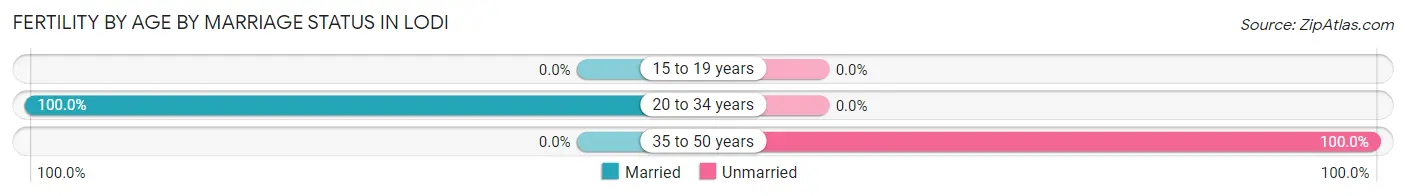
| Age Bracket | Married | Unmarried |
| 15 to 19 years | 0 (0.0%) | 0 (0.0%) |
| 20 to 34 years | 39 (100.0%) | 0 (0.0%) |
| 35 to 50 years | 0 (0.0%) | 8 (100.0%) |
| Total | 39 (83.0%) | 8 (17.0%) |
Fertility by Education in Lodi
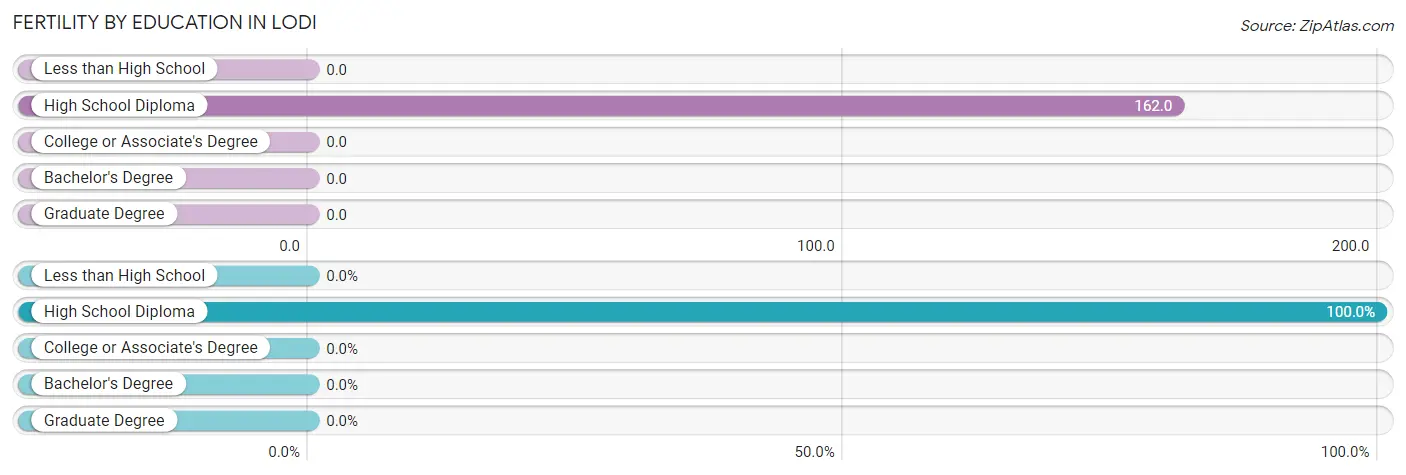
| Educational Attainment | Women with Births | Births / 1,000 Women |
| Less than High School | 0 (0.0%) | 0.0 |
| High School Diploma | 47 (100.0%) | 162.0 |
| College or Associate's Degree | 0 (0.0%) | 0.0 |
| Bachelor's Degree | 0 (0.0%) | 0.0 |
| Graduate Degree | 0 (0.0%) | 0.0 |
| Total | 47 (100.0%) | 81.0 |
Fertility by Education by Marriage Status in Lodi
17.0% of women with births in Lodi are unmarried. Women with the educational attainment of high school diploma are most likely to be married with 83.0% of them married at childbirth, while women with the educational attainment of high school diploma are least likely to be married with 17.0% of them unmarried at childbirth.
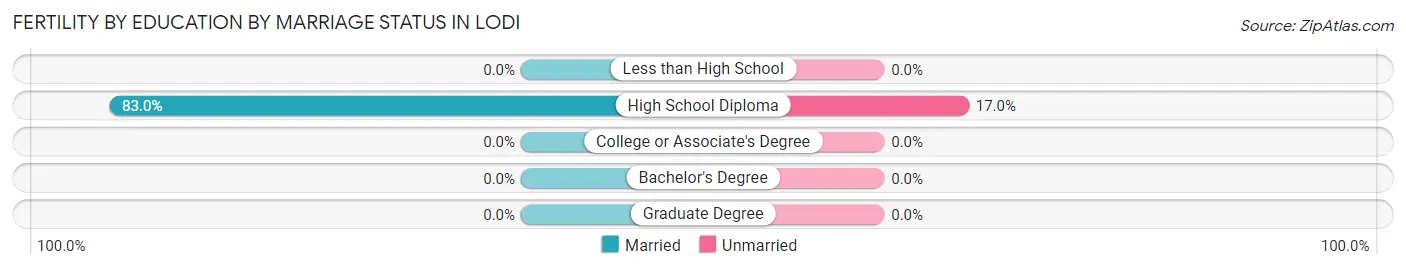
| Educational Attainment | Married | Unmarried |
| Less than High School | 0 (0.0%) | 0 (0.0%) |
| High School Diploma | 39 (83.0%) | 8 (17.0%) |
| College or Associate's Degree | 0 (0.0%) | 0 (0.0%) |
| Bachelor's Degree | 0 (0.0%) | 0 (0.0%) |
| Graduate Degree | 0 (0.0%) | 0 (0.0%) |
| Total | 39 (83.0%) | 8 (17.0%) |
Employment Characteristics in Lodi
Employment by Class of Employer in Lodi
Among the 1,492 employed individuals in Lodi, private company employees (1,231 | 82.5%), not-for-profit organizations (121 | 8.1%), and local government employees (68 | 4.6%) make up the most common classes of employment.
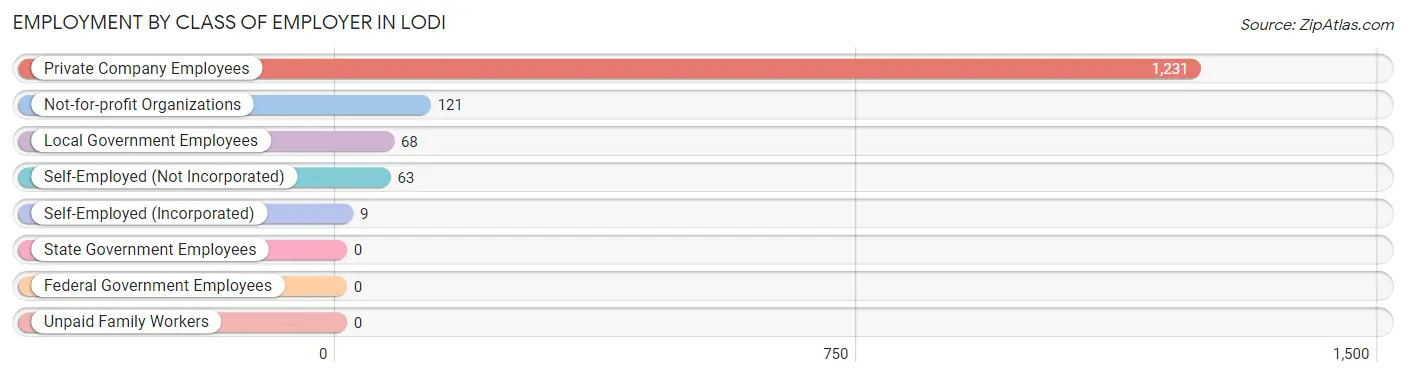
| Employer Class | # Employees | % Employees |
| Private Company Employees | 1,231 | 82.5% |
| Self-Employed (Incorporated) | 9 | 0.6% |
| Self-Employed (Not Incorporated) | 63 | 4.2% |
| Not-for-profit Organizations | 121 | 8.1% |
| Local Government Employees | 68 | 4.6% |
| State Government Employees | 0 | 0.0% |
| Federal Government Employees | 0 | 0.0% |
| Unpaid Family Workers | 0 | 0.0% |
| Total | 1,492 | 100.0% |
Employment Status by Age in Lodi
According to the labor force statistics for Lodi, out of the total population over 16 years of age (2,254), 69.0% or 1,555 individuals are in the labor force, with 3.7% or 58 of them unemployed. The age group with the highest labor force participation rate is 25 to 29 years, with 100.0% or 95 individuals in the labor force. Within the labor force, the 65 to 74 years age range has the highest percentage of unemployed individuals, with 25.0% or 22 of them being unemployed.
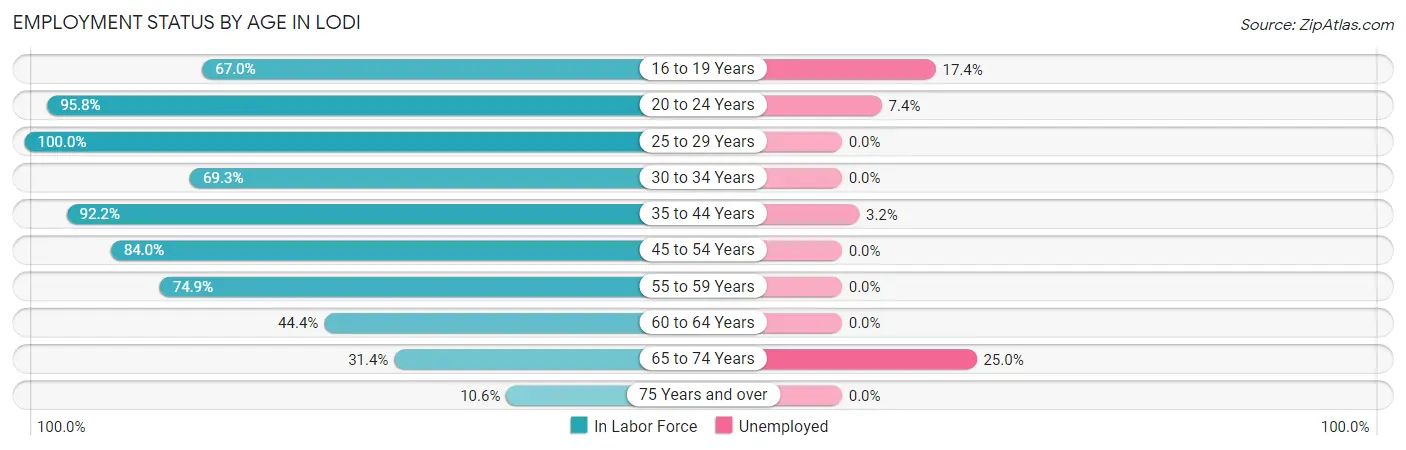
| Age Bracket | In Labor Force | Unemployed |
| 16 to 19 Years | 69 (67.0%) | 12 (17.4%) |
| 20 to 24 Years | 136 (95.8%) | 10 (7.4%) |
| 25 to 29 Years | 95 (100.0%) | 0 (0.0%) |
| 30 to 34 Years | 181 (69.3%) | 0 (0.0%) |
| 35 to 44 Years | 401 (92.2%) | 13 (3.2%) |
| 45 to 54 Years | 336 (84.0%) | 0 (0.0%) |
| 55 to 59 Years | 161 (74.9%) | 0 (0.0%) |
| 60 to 64 Years | 72 (44.4%) | 0 (0.0%) |
| 65 to 74 Years | 88 (31.4%) | 22 (25.0%) |
| 75 Years and over | 17 (10.6%) | 0 (0.0%) |
| Total | 1,555 (69.0%) | 58 (3.7%) |
Employment Status by Educational Attainment in Lodi
According to labor force statistics for Lodi, 79.5% of individuals (1,247) out of the total population between 25 and 64 years of age (1,568) are in the labor force, with 1.0% or 12 of them being unemployed. The group with the highest labor force participation rate are those with the educational attainment of bachelor's degree or higher, with 100.0% or 130 individuals in the labor force. Within the labor force, individuals with less than high school education have the highest percentage of unemployment, with 2.6% or 3 of them being unemployed.
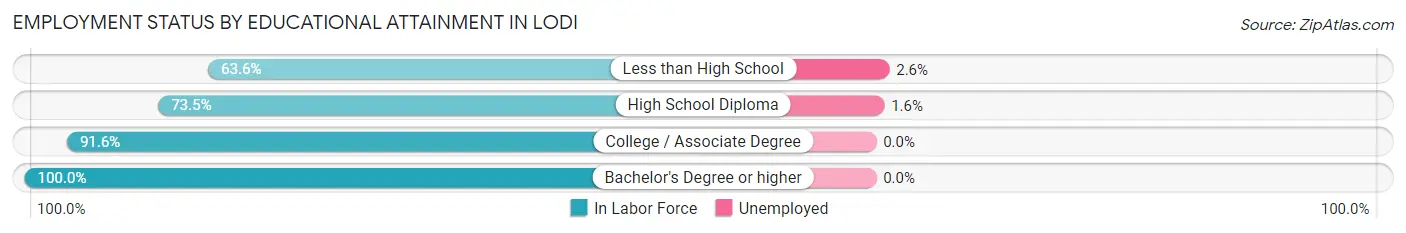
| Educational Attainment | In Labor Force | Unemployed |
| Less than High School | 117 (63.6%) | 5 (2.6%) |
| High School Diploma | 607 (73.5%) | 13 (1.6%) |
| College / Associate Degree | 392 (91.6%) | 0 (0.0%) |
| Bachelor's Degree or higher | 130 (100.0%) | 0 (0.0%) |
| Total | 1,247 (79.5%) | 16 (1.0%) |
Employment Occupations by Sex in Lodi
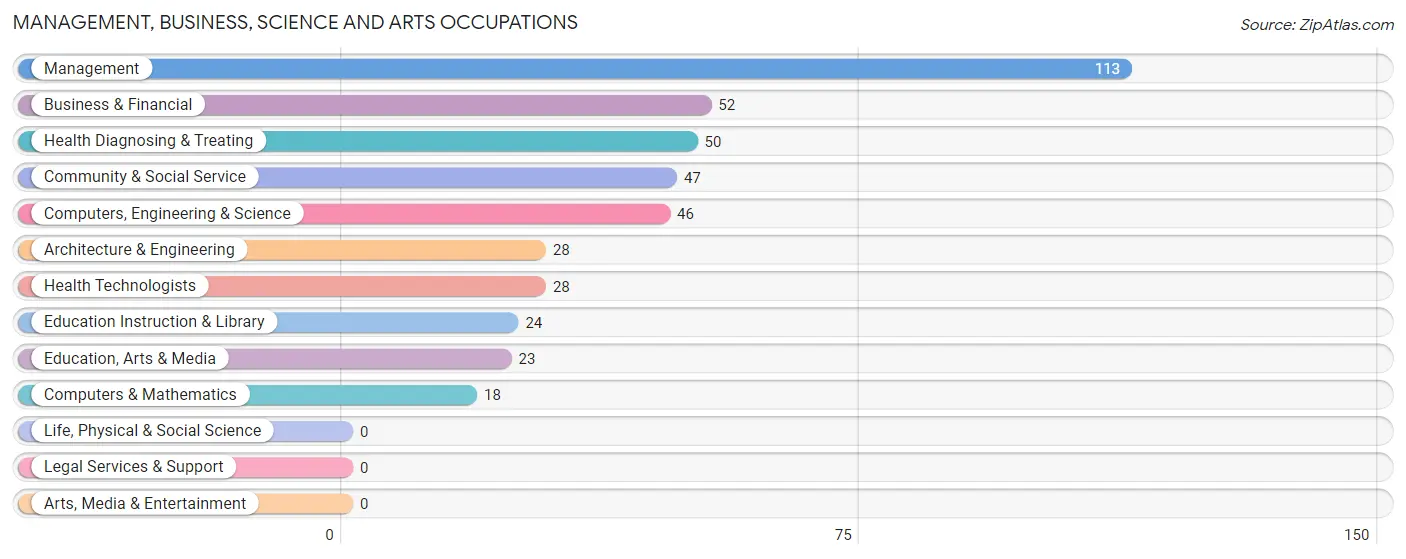
Management, Business, Science and Arts Occupations
The most common Management, Business, Science and Arts occupations in Lodi are Management (113 | 7.5%), Business & Financial (52 | 3.5%), Health Diagnosing & Treating (50 | 3.3%), Community & Social Service (47 | 3.1%), and Computers, Engineering & Science (46 | 3.1%).
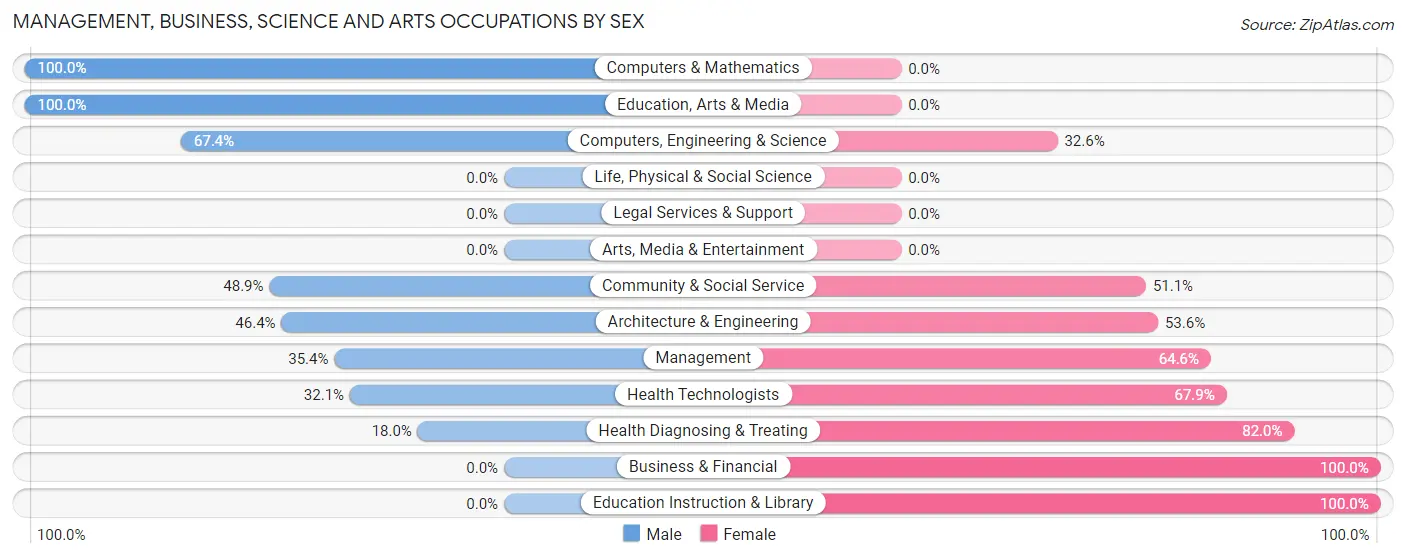
Management, Business, Science and Arts Occupations by Sex
Within the Management, Business, Science and Arts occupations in Lodi, the most male-oriented occupations are Computers & Mathematics (100.0%), Education, Arts & Media (100.0%), and Computers, Engineering & Science (67.4%), while the most female-oriented occupations are Business & Financial (100.0%), Education Instruction & Library (100.0%), and Health Diagnosing & Treating (82.0%).
| Occupation | Male | Female |
| Management | 40 (35.4%) | 73 (64.6%) |
| Business & Financial | 0 (0.0%) | 52 (100.0%) |
| Computers, Engineering & Science | 31 (67.4%) | 15 (32.6%) |
| Computers & Mathematics | 18 (100.0%) | 0 (0.0%) |
| Architecture & Engineering | 13 (46.4%) | 15 (53.6%) |
| Life, Physical & Social Science | 0 (0.0%) | 0 (0.0%) |
| Community & Social Service | 23 (48.9%) | 24 (51.1%) |
| Education, Arts & Media | 23 (100.0%) | 0 (0.0%) |
| Legal Services & Support | 0 (0.0%) | 0 (0.0%) |
| Education Instruction & Library | 0 (0.0%) | 24 (100.0%) |
| Arts, Media & Entertainment | 0 (0.0%) | 0 (0.0%) |
| Health Diagnosing & Treating | 9 (18.0%) | 41 (82.0%) |
| Health Technologists | 9 (32.1%) | 19 (67.9%) |
| Total (Category) | 103 (33.4%) | 205 (66.6%) |
| Total (Overall) | 869 (58.0%) | 630 (42.0%) |
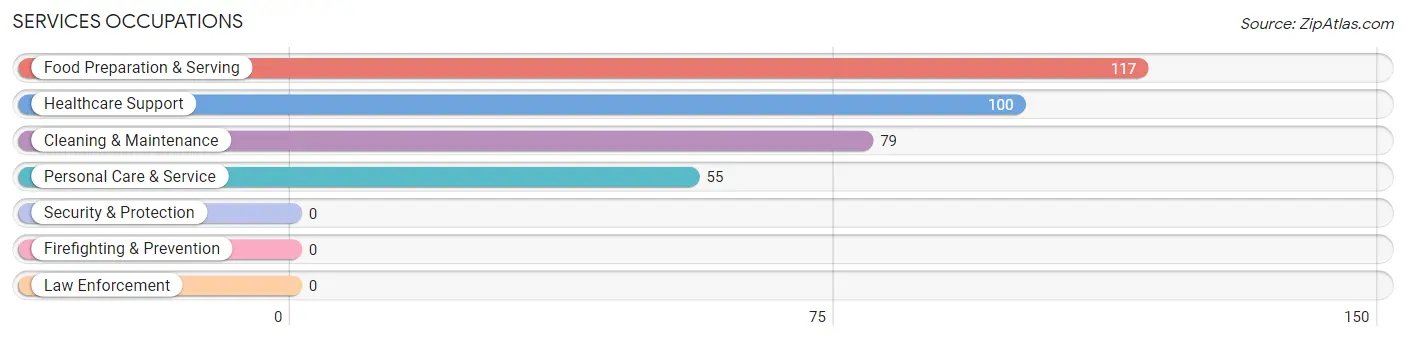
Services Occupations
The most common Services occupations in Lodi are Food Preparation & Serving (117 | 7.8%), Healthcare Support (100 | 6.7%), Cleaning & Maintenance (79 | 5.3%), and Personal Care & Service (55 | 3.7%).
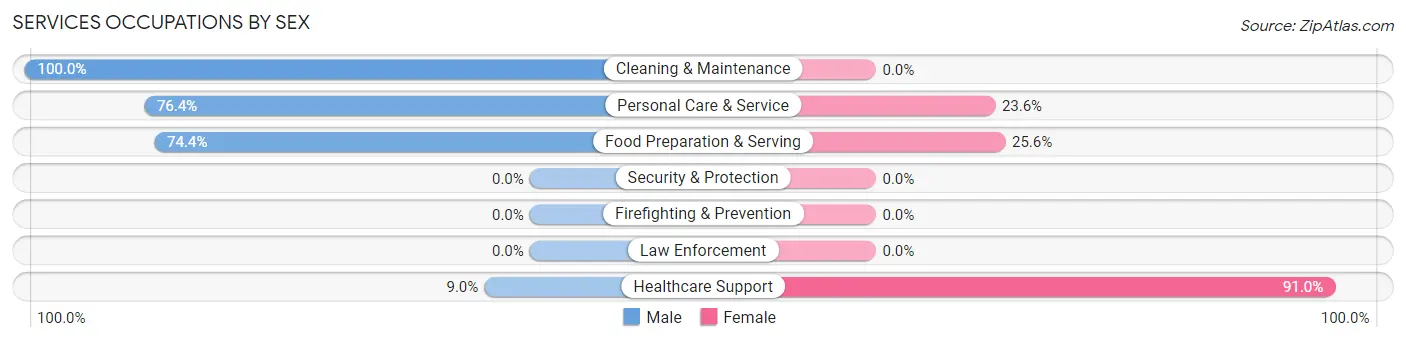
Services Occupations by Sex
Within the Services occupations in Lodi, the most male-oriented occupations are Cleaning & Maintenance (100.0%), Personal Care & Service (76.4%), and Food Preparation & Serving (74.4%), while the most female-oriented occupations are Healthcare Support (91.0%), Food Preparation & Serving (25.6%), and Personal Care & Service (23.6%).
| Occupation | Male | Female |
| Healthcare Support | 9 (9.0%) | 91 (91.0%) |
| Security & Protection | 0 (0.0%) | 0 (0.0%) |
| Firefighting & Prevention | 0 (0.0%) | 0 (0.0%) |
| Law Enforcement | 0 (0.0%) | 0 (0.0%) |
| Food Preparation & Serving | 87 (74.4%) | 30 (25.6%) |
| Cleaning & Maintenance | 79 (100.0%) | 0 (0.0%) |
| Personal Care & Service | 42 (76.4%) | 13 (23.6%) |
| Total (Category) | 217 (61.8%) | 134 (38.2%) |
| Total (Overall) | 869 (58.0%) | 630 (42.0%) |
Sales and Office Occupations
The most common Sales and Office occupations in Lodi are Office & Administration (237 | 15.8%), and Sales & Related (96 | 6.4%).
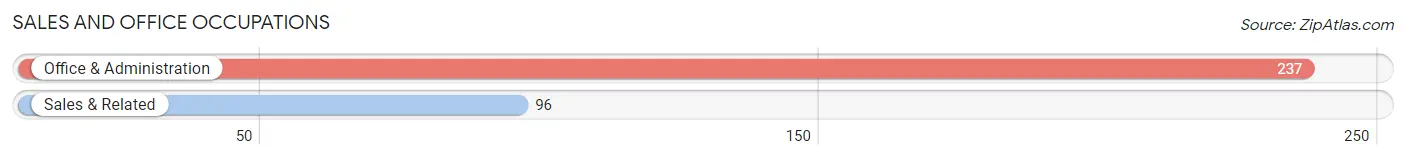
Sales and Office Occupations by Sex
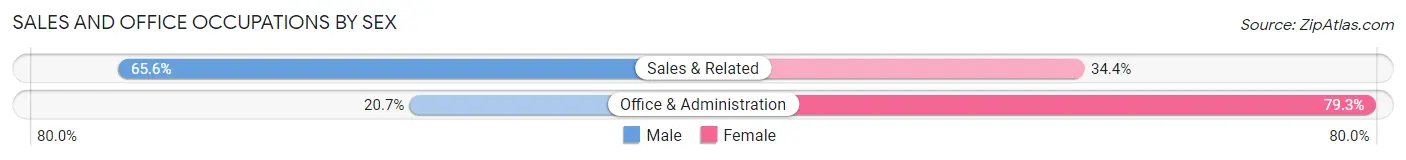
| Occupation | Male | Female |
| Sales & Related | 63 (65.6%) | 33 (34.4%) |
| Office & Administration | 49 (20.7%) | 188 (79.3%) |
| Total (Category) | 112 (33.6%) | 221 (66.4%) |
| Total (Overall) | 869 (58.0%) | 630 (42.0%) |
Natural Resources, Construction and Maintenance Occupations
The most common Natural Resources, Construction and Maintenance occupations in Lodi are Construction & Extraction (139 | 9.3%), and Installation, Maintenance & Repair (61 | 4.1%).
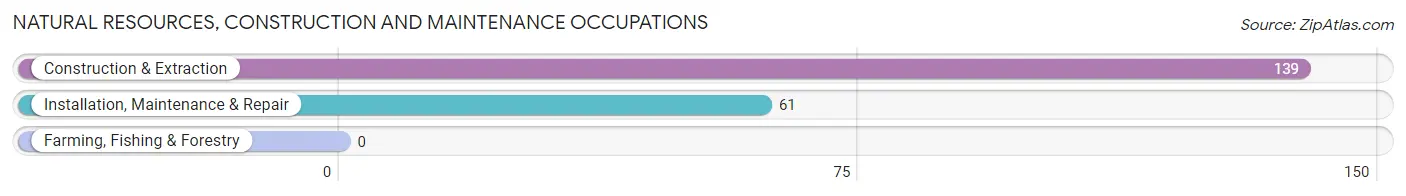
Natural Resources, Construction and Maintenance Occupations by Sex
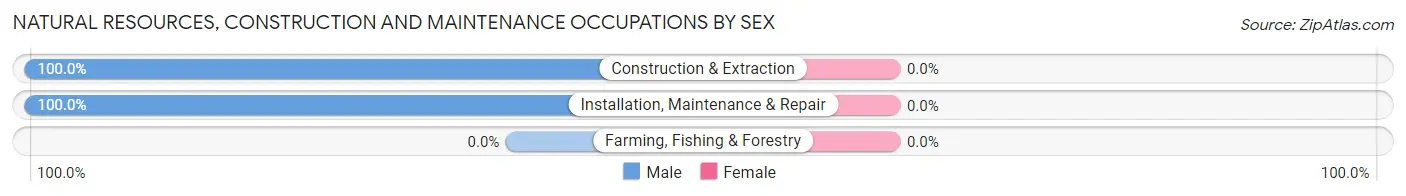
| Occupation | Male | Female |
| Farming, Fishing & Forestry | 0 (0.0%) | 0 (0.0%) |
| Construction & Extraction | 139 (100.0%) | 0 (0.0%) |
| Installation, Maintenance & Repair | 61 (100.0%) | 0 (0.0%) |
| Total (Category) | 200 (100.0%) | 0 (0.0%) |
| Total (Overall) | 869 (58.0%) | 630 (42.0%) |
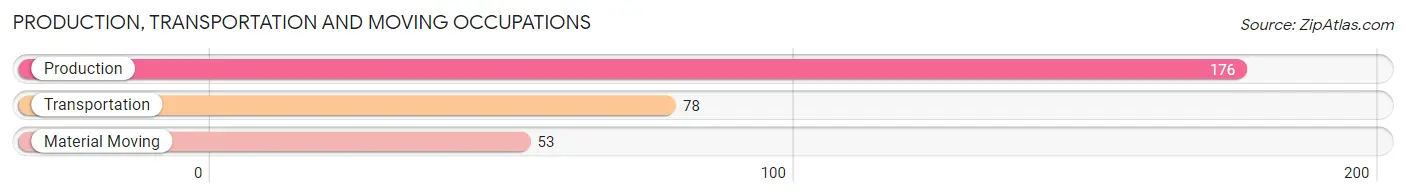
Production, Transportation and Moving Occupations
The most common Production, Transportation and Moving occupations in Lodi are Production (176 | 11.7%), Transportation (78 | 5.2%), and Material Moving (53 | 3.5%).
Production, Transportation and Moving Occupations by Sex

| Occupation | Male | Female |
| Production | 124 (70.5%) | 52 (29.5%) |
| Transportation | 78 (100.0%) | 0 (0.0%) |
| Material Moving | 35 (66.0%) | 18 (34.0%) |
| Total (Category) | 237 (77.2%) | 70 (22.8%) |
| Total (Overall) | 869 (58.0%) | 630 (42.0%) |
Employment Industries by Sex in Lodi
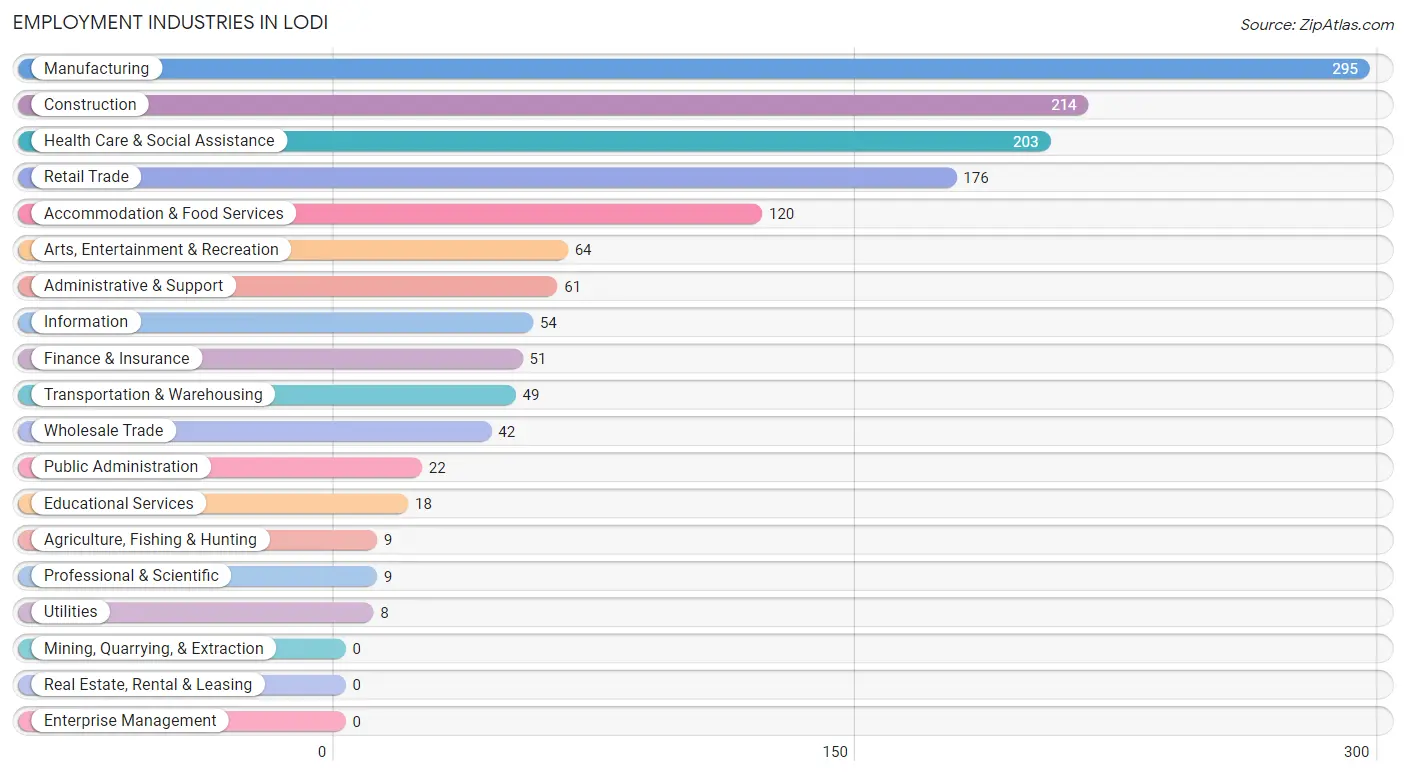
Employment Industries in Lodi
The major employment industries in Lodi include Manufacturing (295 | 19.7%), Construction (214 | 14.3%), Health Care & Social Assistance (203 | 13.5%), Retail Trade (176 | 11.7%), and Accommodation & Food Services (120 | 8.0%).
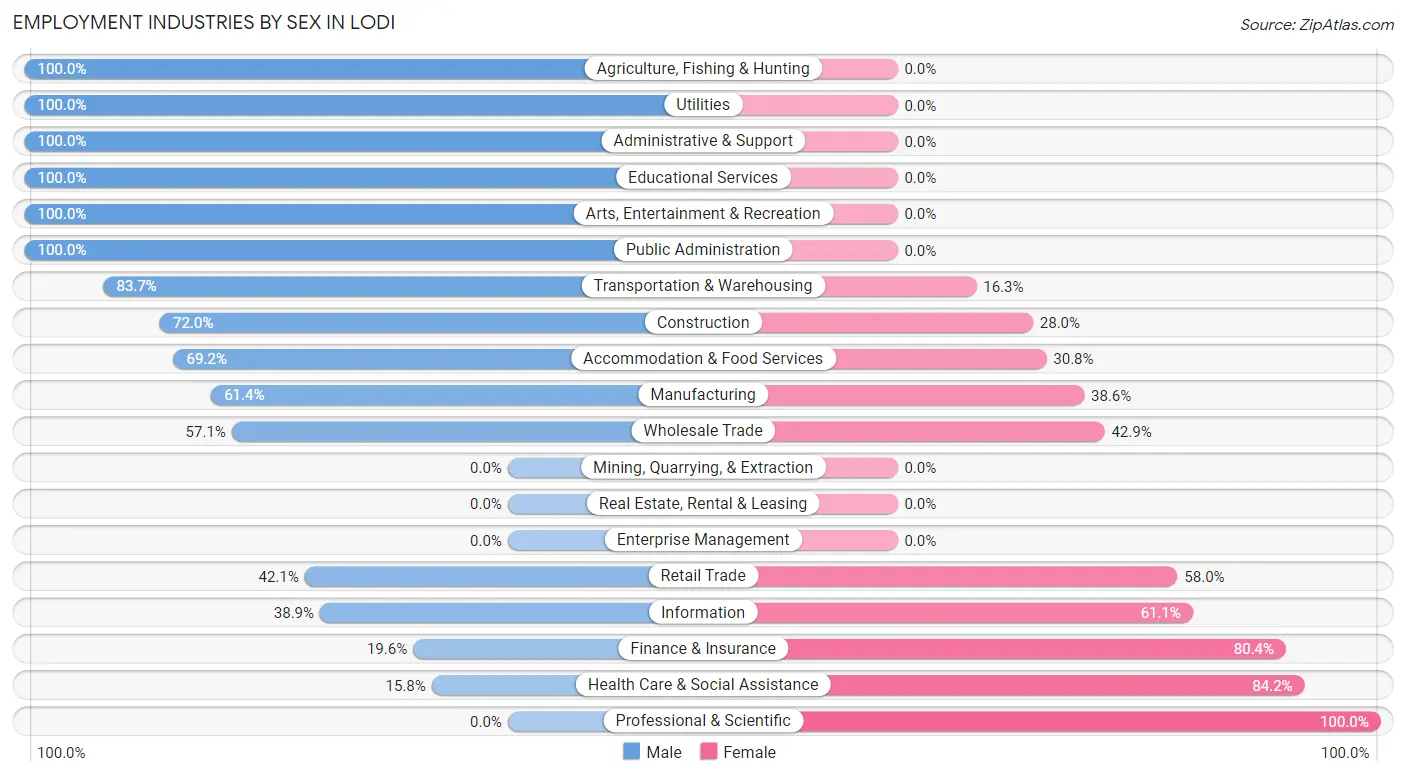
Employment Industries by Sex in Lodi
The Lodi industries that see more men than women are Agriculture, Fishing & Hunting (100.0%), Utilities (100.0%), and Administrative & Support (100.0%), whereas the industries that tend to have a higher number of women are Professional & Scientific (100.0%), Health Care & Social Assistance (84.2%), and Finance & Insurance (80.4%).
| Industry | Male | Female |
| Agriculture, Fishing & Hunting | 9 (100.0%) | 0 (0.0%) |
| Mining, Quarrying, & Extraction | 0 (0.0%) | 0 (0.0%) |
| Construction | 154 (72.0%) | 60 (28.0%) |
| Manufacturing | 181 (61.4%) | 114 (38.6%) |
| Wholesale Trade | 24 (57.1%) | 18 (42.9%) |
| Retail Trade | 74 (42.0%) | 102 (58.0%) |
| Transportation & Warehousing | 41 (83.7%) | 8 (16.3%) |
| Utilities | 8 (100.0%) | 0 (0.0%) |
| Information | 21 (38.9%) | 33 (61.1%) |
| Finance & Insurance | 10 (19.6%) | 41 (80.4%) |
| Real Estate, Rental & Leasing | 0 (0.0%) | 0 (0.0%) |
| Professional & Scientific | 0 (0.0%) | 9 (100.0%) |
| Enterprise Management | 0 (0.0%) | 0 (0.0%) |
| Administrative & Support | 61 (100.0%) | 0 (0.0%) |
| Educational Services | 18 (100.0%) | 0 (0.0%) |
| Health Care & Social Assistance | 32 (15.8%) | 171 (84.2%) |
| Arts, Entertainment & Recreation | 64 (100.0%) | 0 (0.0%) |
| Accommodation & Food Services | 83 (69.2%) | 37 (30.8%) |
| Public Administration | 22 (100.0%) | 0 (0.0%) |
| Total | 869 (58.0%) | 630 (42.0%) |
Education in Lodi
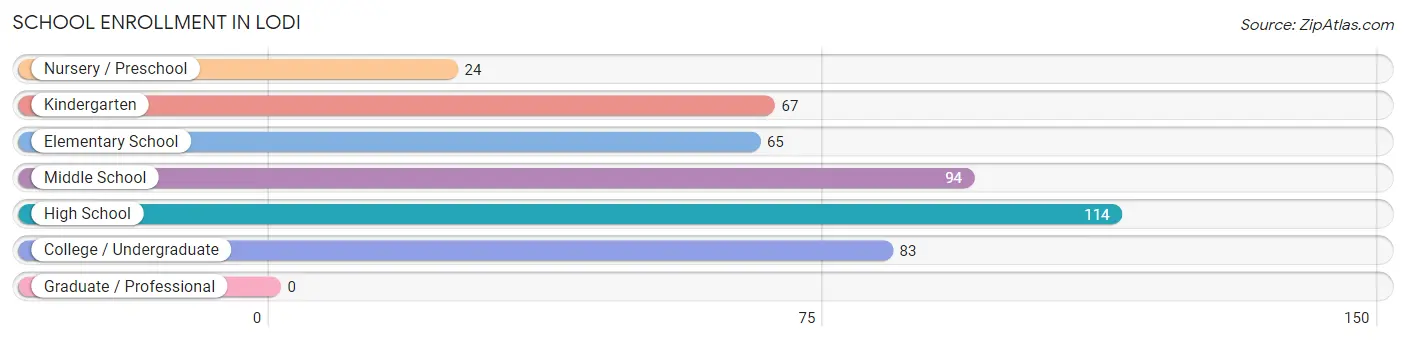
School Enrollment in Lodi
The most common levels of schooling among the 447 students in Lodi are high school (114 | 25.5%), middle school (94 | 21.0%), and college / undergraduate (83 | 18.6%).
| School Level | # Students | % Students |
| Nursery / Preschool | 24 | 5.4% |
| Kindergarten | 67 | 15.0% |
| Elementary School | 65 | 14.5% |
| Middle School | 94 | 21.0% |
| High School | 114 | 25.5% |
| College / Undergraduate | 83 | 18.6% |
| Graduate / Professional | 0 | 0.0% |
| Total | 447 | 100.0% |
School Enrollment by Age by Funding Source in Lodi
Out of a total of 447 students who are enrolled in schools in Lodi, 9 (2.0%) attend a private institution, while the remaining 438 (98.0%) are enrolled in public schools. The age group of 10 to 14 year olds has the highest likelihood of being enrolled in private schools, with 9 (7.6% in the age bracket) enrolled. Conversely, the age group of 3 to 4 year olds has the lowest likelihood of being enrolled in a private school, with 16 (100.0% in the age bracket) attending a public institution.
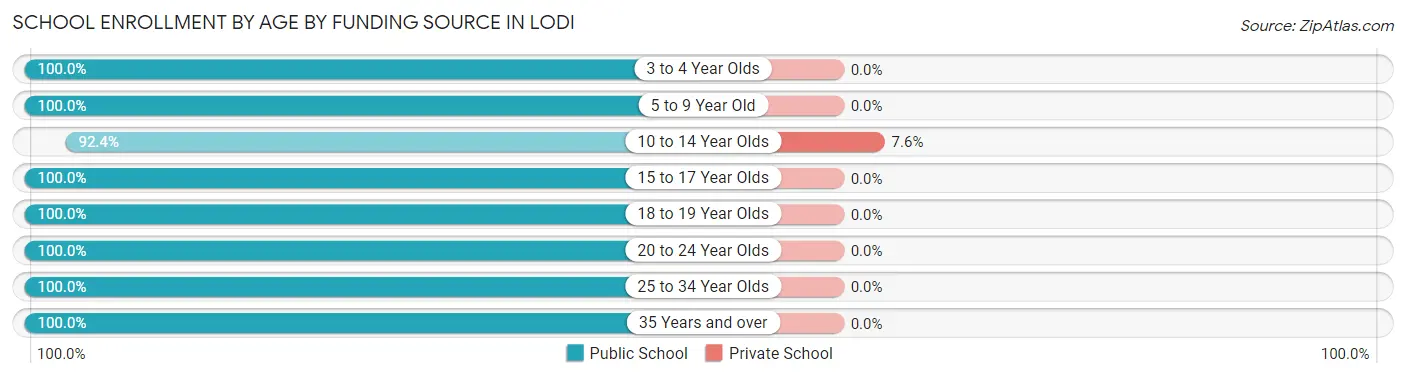
| Age Bracket | Public School | Private School |
| 3 to 4 Year Olds | 16 (100.0%) | 0 (0.0%) |
| 5 to 9 Year Old | 132 (100.0%) | 0 (0.0%) |
| 10 to 14 Year Olds | 109 (92.4%) | 9 (7.6%) |
| 15 to 17 Year Olds | 85 (100.0%) | 0 (0.0%) |
| 18 to 19 Year Olds | 19 (100.0%) | 0 (0.0%) |
| 20 to 24 Year Olds | 23 (100.0%) | 0 (0.0%) |
| 25 to 34 Year Olds | 11 (100.0%) | 0 (0.0%) |
| 35 Years and over | 43 (100.0%) | 0 (0.0%) |
| Total | 438 (98.0%) | 9 (2.0%) |
Educational Attainment by Field of Study in Lodi
Business (38 | 25.7%), liberal arts & history (30 | 20.3%), science & technology (28 | 18.9%), computers & mathematics (21 | 14.2%), and visual & performing arts (10 | 6.8%) are the most common fields of study among 148 individuals in Lodi who have obtained a bachelor's degree or higher.
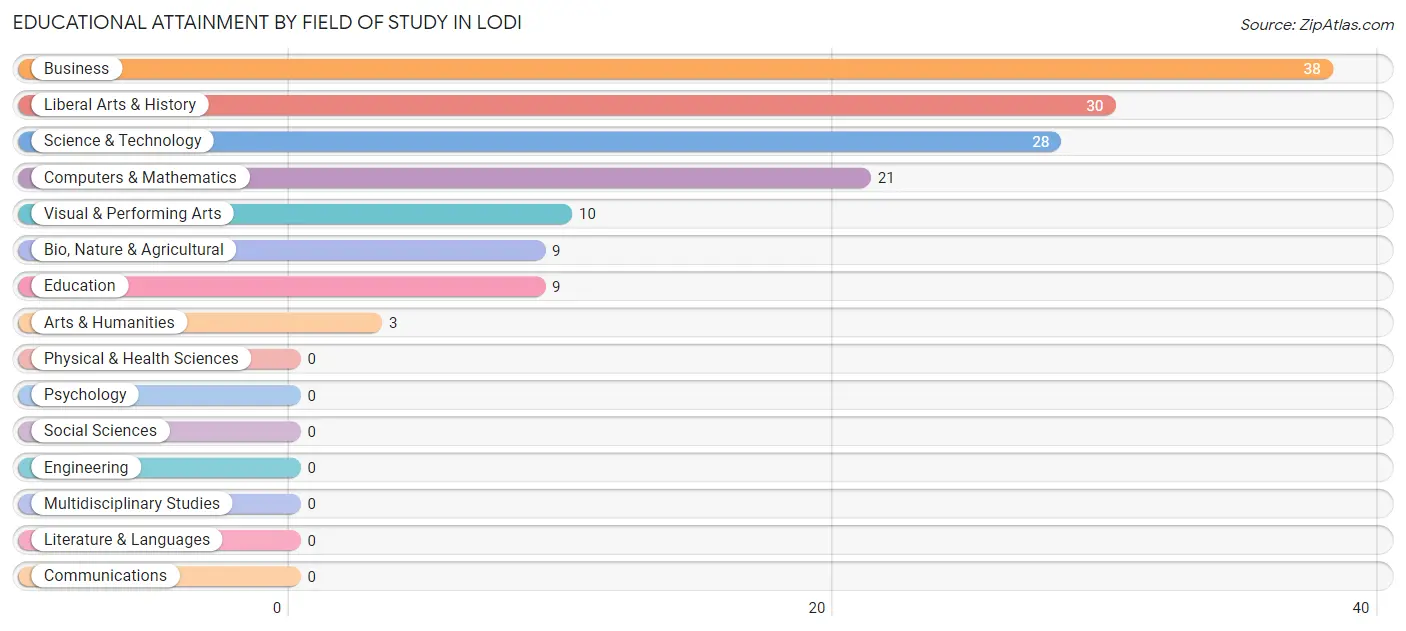
| Field of Study | # Graduates | % Graduates |
| Computers & Mathematics | 21 | 14.2% |
| Bio, Nature & Agricultural | 9 | 6.1% |
| Physical & Health Sciences | 0 | 0.0% |
| Psychology | 0 | 0.0% |
| Social Sciences | 0 | 0.0% |
| Engineering | 0 | 0.0% |
| Multidisciplinary Studies | 0 | 0.0% |
| Science & Technology | 28 | 18.9% |
| Business | 38 | 25.7% |
| Education | 9 | 6.1% |
| Literature & Languages | 0 | 0.0% |
| Liberal Arts & History | 30 | 20.3% |
| Visual & Performing Arts | 10 | 6.8% |
| Communications | 0 | 0.0% |
| Arts & Humanities | 3 | 2.0% |
| Total | 148 | 100.0% |
Transportation & Commute in Lodi
Vehicle Availability by Sex in Lodi
The most prevalent vehicle ownership categories in Lodi are males with 2 vehicles (289, accounting for 33.5%) and females with 2 vehicles (185, making up 45.9%).
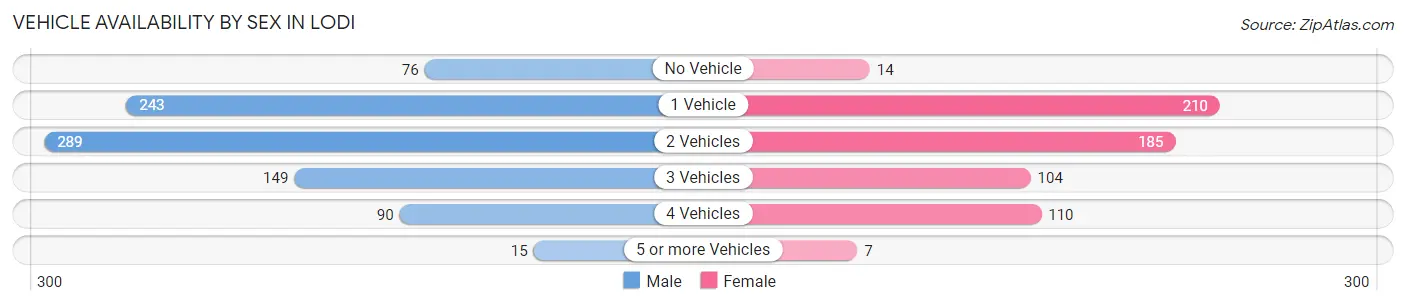
| Vehicles Available | Male | Female |
| No Vehicle | 76 (8.8%) | 14 (2.2%) |
| 1 Vehicle | 243 (28.2%) | 210 (33.3%) |
| 2 Vehicles | 289 (33.5%) | 185 (29.4%) |
| 3 Vehicles | 149 (17.3%) | 104 (16.5%) |
| 4 Vehicles | 90 (10.4%) | 110 (17.5%) |
| 5 or more Vehicles | 15 (1.7%) | 7 (1.1%) |
| Total | 862 (100.0%) | 630 (100.0%) |
Commute Time in Lodi
The most frequently occuring commute durations in Lodi are 20 to 24 minutes (239 commuters, 16.9%), 5 to 9 minutes (198 commuters, 14.0%), and 30 to 34 minutes (182 commuters, 12.8%).
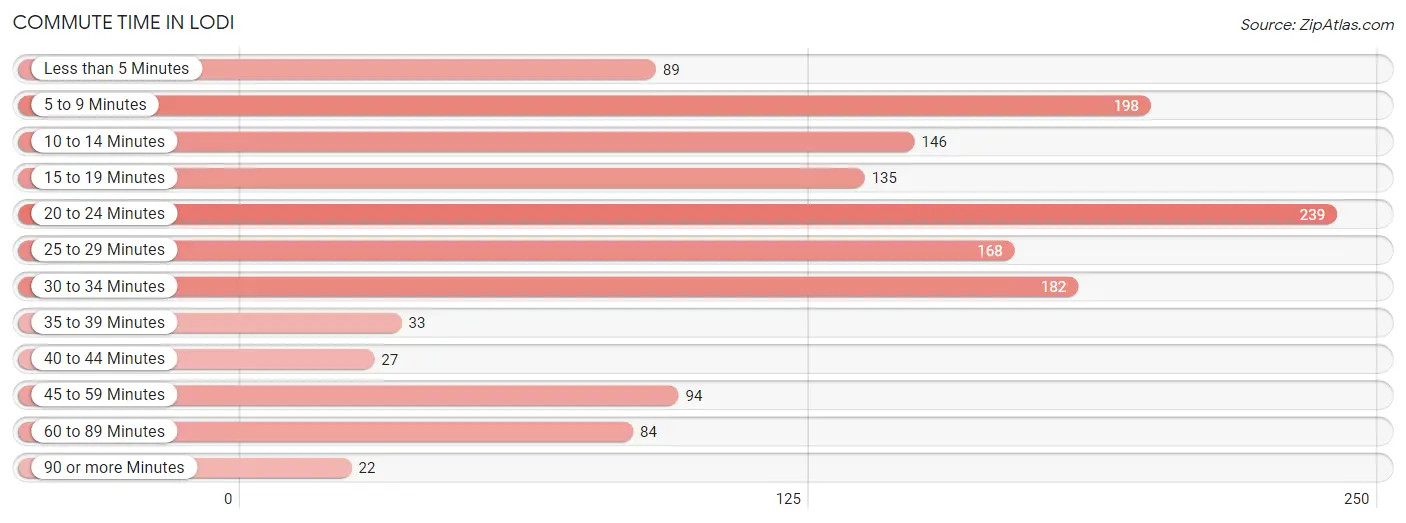
| Commute Time | # Commuters | % Commuters |
| Less than 5 Minutes | 89 | 6.3% |
| 5 to 9 Minutes | 198 | 14.0% |
| 10 to 14 Minutes | 146 | 10.3% |
| 15 to 19 Minutes | 135 | 9.5% |
| 20 to 24 Minutes | 239 | 16.9% |
| 25 to 29 Minutes | 168 | 11.9% |
| 30 to 34 Minutes | 182 | 12.8% |
| 35 to 39 Minutes | 33 | 2.3% |
| 40 to 44 Minutes | 27 | 1.9% |
| 45 to 59 Minutes | 94 | 6.6% |
| 60 to 89 Minutes | 84 | 5.9% |
| 90 or more Minutes | 22 | 1.5% |
Commute Time by Sex in Lodi
The most common commute times in Lodi are 25 to 29 minutes (136 commuters, 16.7%) for males and 20 to 24 minutes (178 commuters, 29.5%) for females.
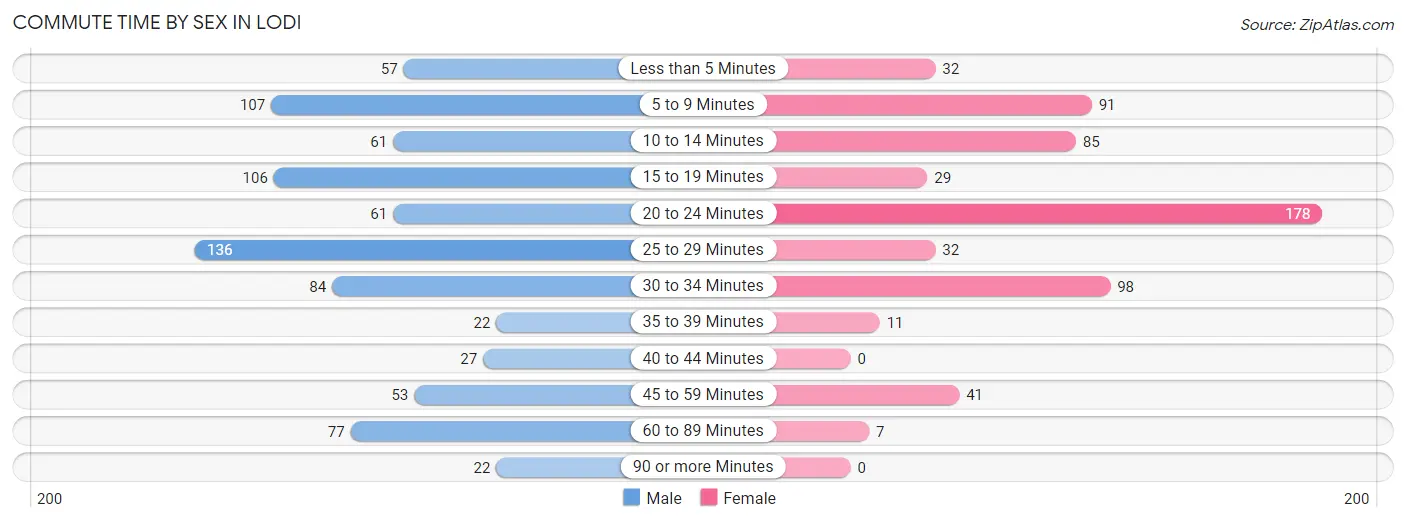
| Commute Time | Male | Female |
| Less than 5 Minutes | 57 (7.0%) | 32 (5.3%) |
| 5 to 9 Minutes | 107 (13.2%) | 91 (15.1%) |
| 10 to 14 Minutes | 61 (7.5%) | 85 (14.1%) |
| 15 to 19 Minutes | 106 (13.0%) | 29 (4.8%) |
| 20 to 24 Minutes | 61 (7.5%) | 178 (29.5%) |
| 25 to 29 Minutes | 136 (16.7%) | 32 (5.3%) |
| 30 to 34 Minutes | 84 (10.3%) | 98 (16.2%) |
| 35 to 39 Minutes | 22 (2.7%) | 11 (1.8%) |
| 40 to 44 Minutes | 27 (3.3%) | 0 (0.0%) |
| 45 to 59 Minutes | 53 (6.5%) | 41 (6.8%) |
| 60 to 89 Minutes | 77 (9.5%) | 7 (1.2%) |
| 90 or more Minutes | 22 (2.7%) | 0 (0.0%) |
Time of Departure to Work by Sex in Lodi
The most frequent times of departure to work in Lodi are 6:00 AM to 6:29 AM (133, 16.4%) for males and 4:00 PM to 11:59 PM (165, 27.3%) for females.
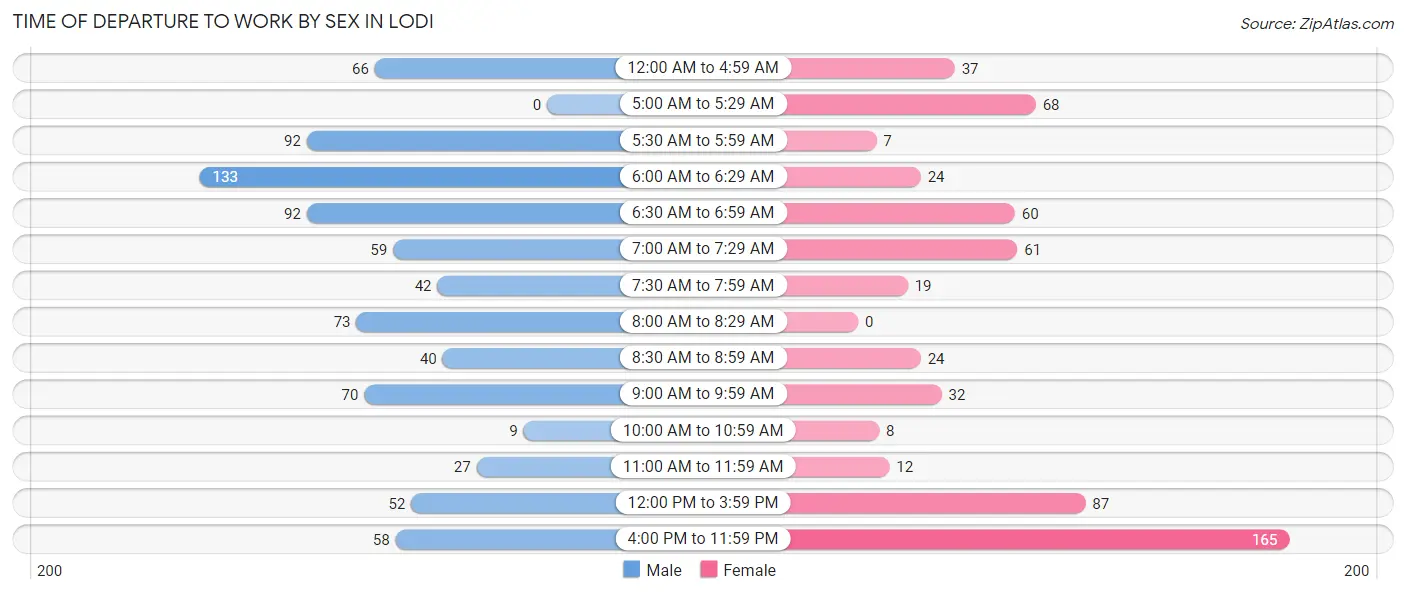
| Time of Departure | Male | Female |
| 12:00 AM to 4:59 AM | 66 (8.1%) | 37 (6.1%) |
| 5:00 AM to 5:29 AM | 0 (0.0%) | 68 (11.3%) |
| 5:30 AM to 5:59 AM | 92 (11.3%) | 7 (1.2%) |
| 6:00 AM to 6:29 AM | 133 (16.4%) | 24 (4.0%) |
| 6:30 AM to 6:59 AM | 92 (11.3%) | 60 (9.9%) |
| 7:00 AM to 7:29 AM | 59 (7.3%) | 61 (10.1%) |
| 7:30 AM to 7:59 AM | 42 (5.2%) | 19 (3.2%) |
| 8:00 AM to 8:29 AM | 73 (9.0%) | 0 (0.0%) |
| 8:30 AM to 8:59 AM | 40 (4.9%) | 24 (4.0%) |
| 9:00 AM to 9:59 AM | 70 (8.6%) | 32 (5.3%) |
| 10:00 AM to 10:59 AM | 9 (1.1%) | 8 (1.3%) |
| 11:00 AM to 11:59 AM | 27 (3.3%) | 12 (2.0%) |
| 12:00 PM to 3:59 PM | 52 (6.4%) | 87 (14.4%) |
| 4:00 PM to 11:59 PM | 58 (7.1%) | 165 (27.3%) |
| Total | 813 (100.0%) | 604 (100.0%) |
Housing Occupancy in Lodi
Occupancy by Ownership in Lodi
Of the total 1,226 dwellings in Lodi, owner-occupied units account for 805 (65.7%), while renter-occupied units make up 421 (34.3%).
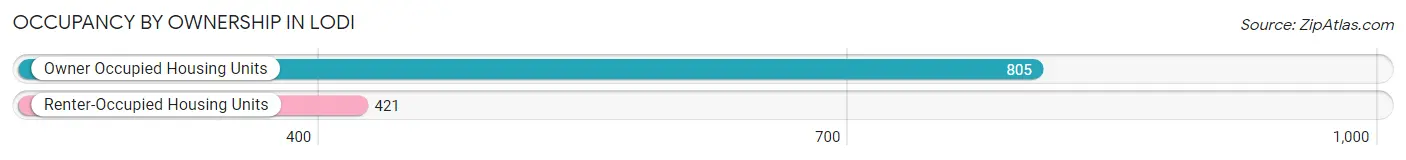
| Occupancy | # Housing Units | % Housing Units |
| Owner Occupied Housing Units | 805 | 65.7% |
| Renter-Occupied Housing Units | 421 | 34.3% |
| Total Occupied Housing Units | 1,226 | 100.0% |
Occupancy by Household Size in Lodi
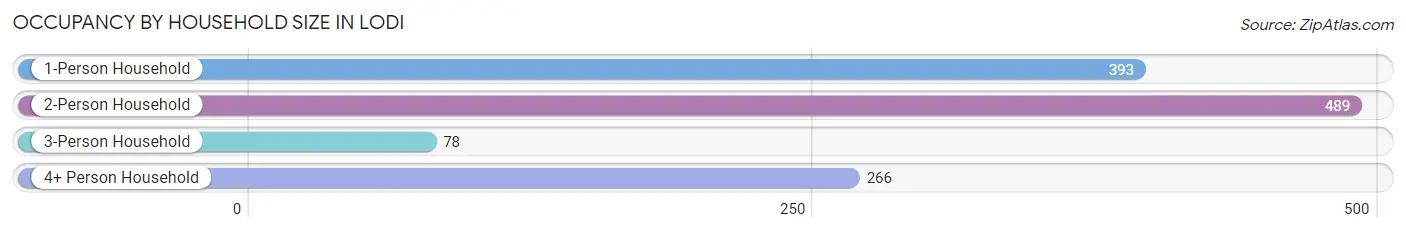
| Household Size | # Housing Units | % Housing Units |
| 1-Person Household | 393 | 32.1% |
| 2-Person Household | 489 | 39.9% |
| 3-Person Household | 78 | 6.4% |
| 4+ Person Household | 266 | 21.7% |
| Total Housing Units | 1,226 | 100.0% |
Occupancy by Ownership by Household Size in Lodi
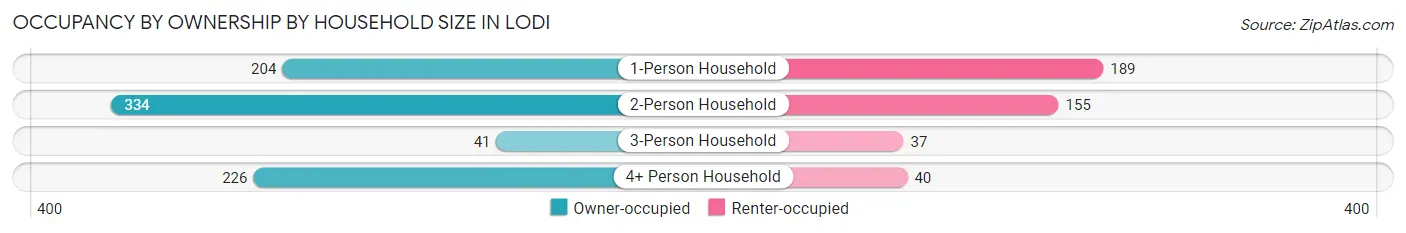
| Household Size | Owner-occupied | Renter-occupied |
| 1-Person Household | 204 (51.9%) | 189 (48.1%) |
| 2-Person Household | 334 (68.3%) | 155 (31.7%) |
| 3-Person Household | 41 (52.6%) | 37 (47.4%) |
| 4+ Person Household | 226 (85.0%) | 40 (15.0%) |
| Total Housing Units | 805 (65.7%) | 421 (34.3%) |
Occupancy by Educational Attainment in Lodi
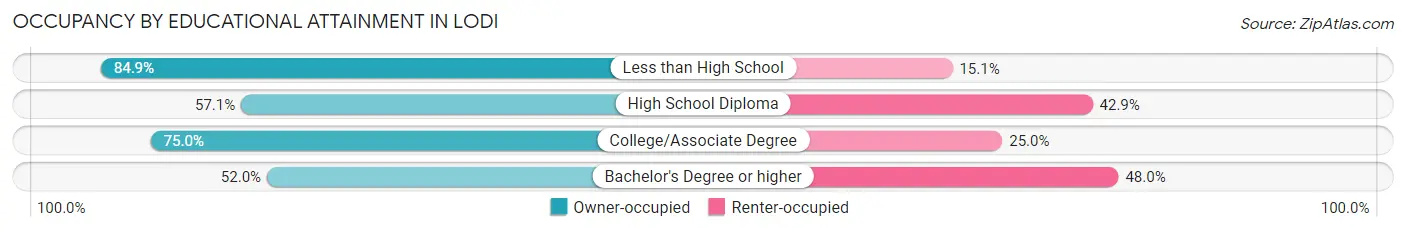
| Household Size | Owner-occupied | Renter-occupied |
| Less than High School | 129 (84.9%) | 23 (15.1%) |
| High School Diploma | 338 (57.1%) | 254 (42.9%) |
| College/Associate Degree | 285 (75.0%) | 95 (25.0%) |
| Bachelor's Degree or higher | 53 (52.0%) | 49 (48.0%) |
Occupancy by Age of Householder in Lodi
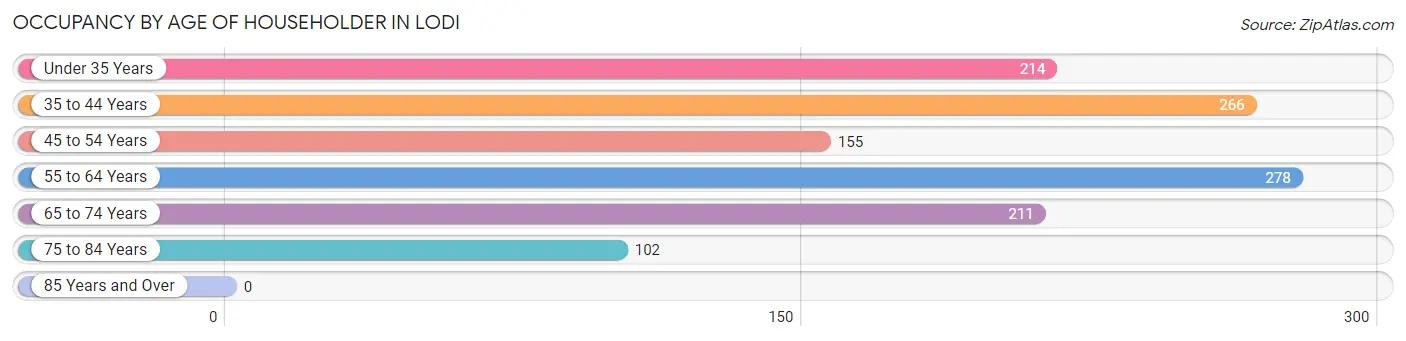
| Age Bracket | # Households | % Households |
| Under 35 Years | 214 | 17.5% |
| 35 to 44 Years | 266 | 21.7% |
| 45 to 54 Years | 155 | 12.6% |
| 55 to 64 Years | 278 | 22.7% |
| 65 to 74 Years | 211 | 17.2% |
| 75 to 84 Years | 102 | 8.3% |
| 85 Years and Over | 0 | 0.0% |
| Total | 1,226 | 100.0% |
Housing Finances in Lodi
Median Income by Occupancy in Lodi
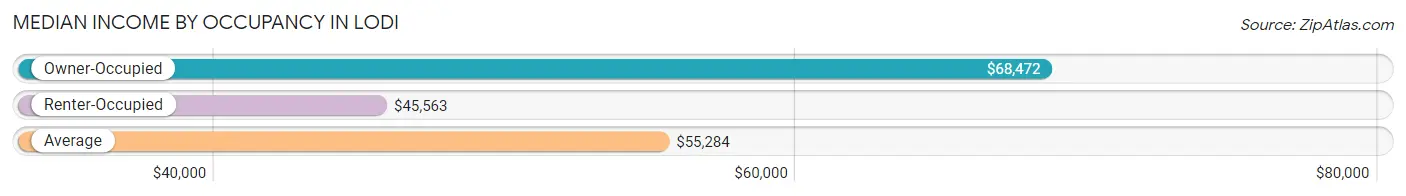
| Occupancy Type | # Households | Median Income |
| Owner-Occupied | 805 (65.7%) | $68,472 |
| Renter-Occupied | 421 (34.3%) | $45,563 |
| Average | 1,226 (100.0%) | $55,284 |
Occupancy by Householder Income Bracket in Lodi
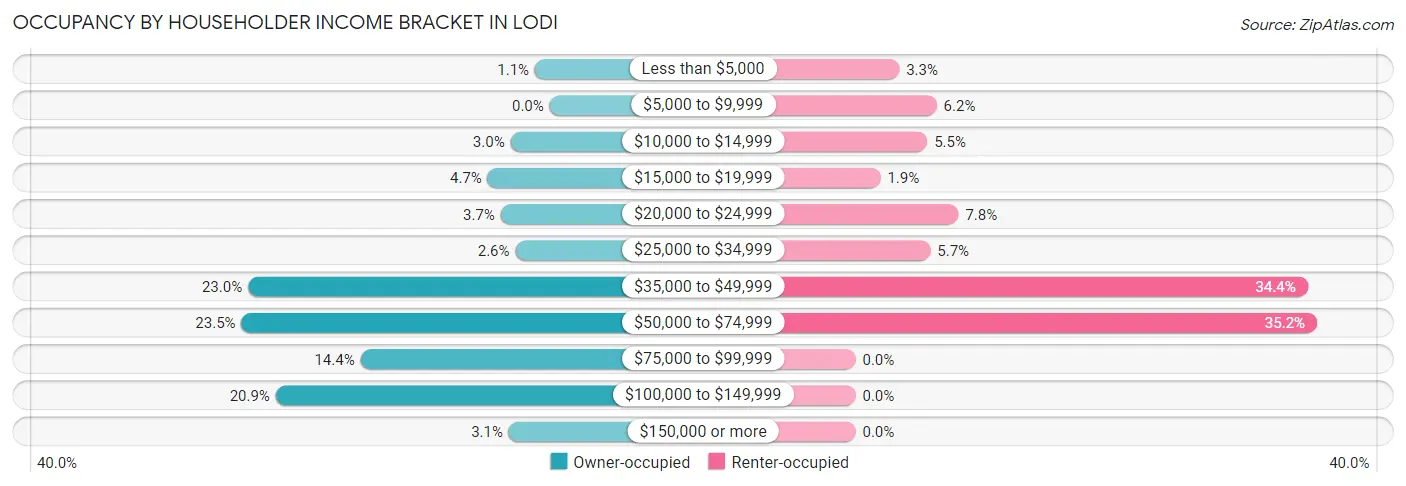
| Income Bracket | Owner-occupied | Renter-occupied |
| Less than $5,000 | 9 (1.1%) | 14 (3.3%) |
| $5,000 to $9,999 | 0 (0.0%) | 26 (6.2%) |
| $10,000 to $14,999 | 24 (3.0%) | 23 (5.5%) |
| $15,000 to $19,999 | 38 (4.7%) | 8 (1.9%) |
| $20,000 to $24,999 | 30 (3.7%) | 33 (7.8%) |
| $25,000 to $34,999 | 21 (2.6%) | 24 (5.7%) |
| $35,000 to $49,999 | 185 (23.0%) | 145 (34.4%) |
| $50,000 to $74,999 | 189 (23.5%) | 148 (35.1%) |
| $75,000 to $99,999 | 116 (14.4%) | 0 (0.0%) |
| $100,000 to $149,999 | 168 (20.9%) | 0 (0.0%) |
| $150,000 or more | 25 (3.1%) | 0 (0.0%) |
| Total | 805 (100.0%) | 421 (100.0%) |
Monthly Housing Cost Tiers in Lodi
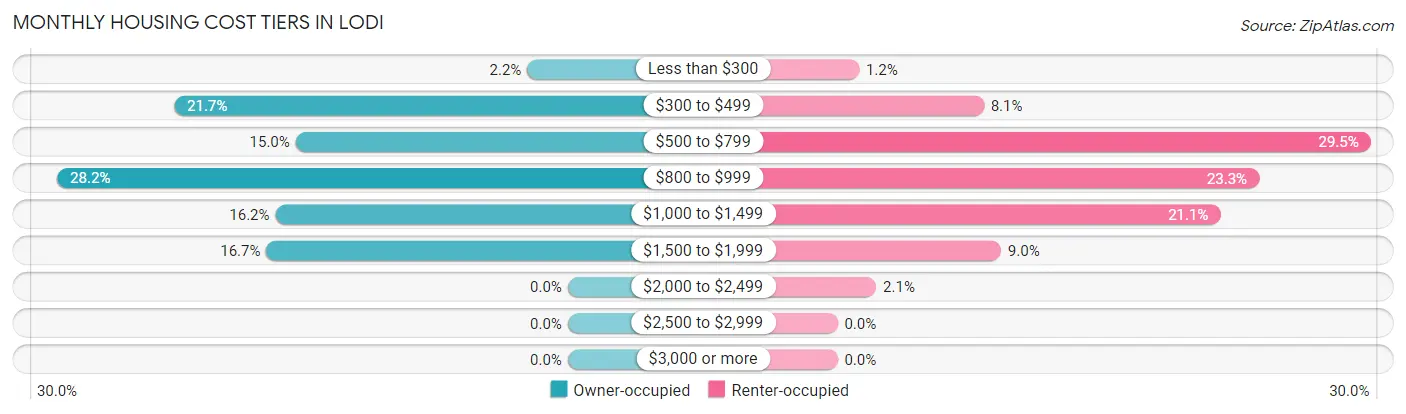
| Monthly Cost | Owner-occupied | Renter-occupied |
| Less than $300 | 18 (2.2%) | 5 (1.2%) |
| $300 to $499 | 175 (21.7%) | 34 (8.1%) |
| $500 to $799 | 121 (15.0%) | 124 (29.4%) |
| $800 to $999 | 227 (28.2%) | 98 (23.3%) |
| $1,000 to $1,499 | 130 (16.2%) | 89 (21.1%) |
| $1,500 to $1,999 | 134 (16.7%) | 38 (9.0%) |
| $2,000 to $2,499 | 0 (0.0%) | 9 (2.1%) |
| $2,500 to $2,999 | 0 (0.0%) | 0 (0.0%) |
| $3,000 or more | 0 (0.0%) | 0 (0.0%) |
| Total | 805 (100.0%) | 421 (100.0%) |
Physical Housing Characteristics in Lodi
Housing Structures in Lodi
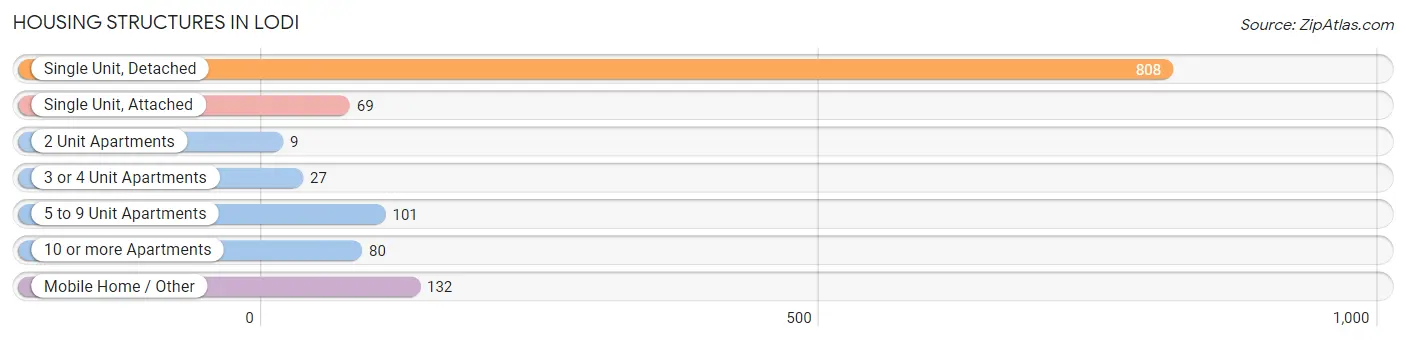
| Structure Type | # Housing Units | % Housing Units |
| Single Unit, Detached | 808 | 65.9% |
| Single Unit, Attached | 69 | 5.6% |
| 2 Unit Apartments | 9 | 0.7% |
| 3 or 4 Unit Apartments | 27 | 2.2% |
| 5 to 9 Unit Apartments | 101 | 8.2% |
| 10 or more Apartments | 80 | 6.5% |
| Mobile Home / Other | 132 | 10.8% |
| Total | 1,226 | 100.0% |
Housing Structures by Occupancy in Lodi
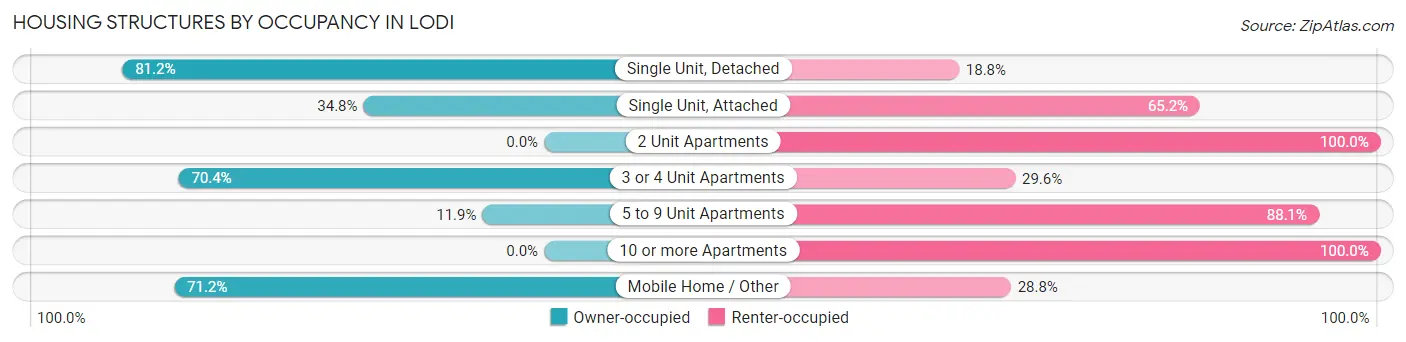
| Structure Type | Owner-occupied | Renter-occupied |
| Single Unit, Detached | 656 (81.2%) | 152 (18.8%) |
| Single Unit, Attached | 24 (34.8%) | 45 (65.2%) |
| 2 Unit Apartments | 0 (0.0%) | 9 (100.0%) |
| 3 or 4 Unit Apartments | 19 (70.4%) | 8 (29.6%) |
| 5 to 9 Unit Apartments | 12 (11.9%) | 89 (88.1%) |
| 10 or more Apartments | 0 (0.0%) | 80 (100.0%) |
| Mobile Home / Other | 94 (71.2%) | 38 (28.8%) |
| Total | 805 (65.7%) | 421 (34.3%) |
Housing Structures by Number of Rooms in Lodi
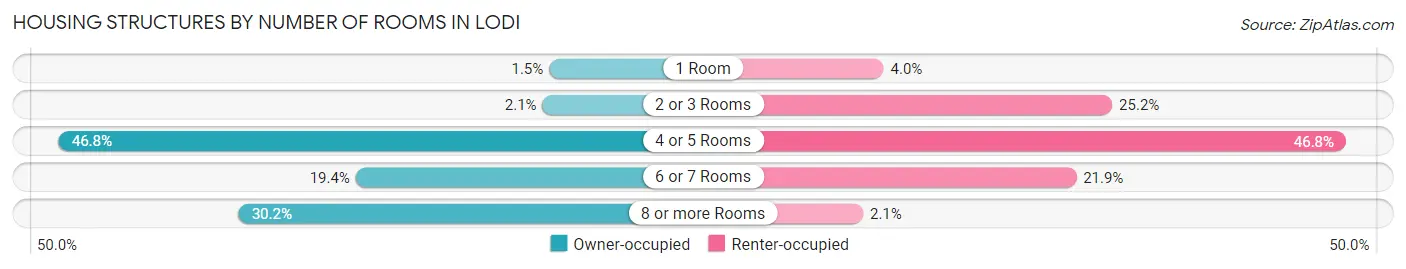
| Number of Rooms | Owner-occupied | Renter-occupied |
| 1 Room | 12 (1.5%) | 17 (4.0%) |
| 2 or 3 Rooms | 17 (2.1%) | 106 (25.2%) |
| 4 or 5 Rooms | 377 (46.8%) | 197 (46.8%) |
| 6 or 7 Rooms | 156 (19.4%) | 92 (21.8%) |
| 8 or more Rooms | 243 (30.2%) | 9 (2.1%) |
| Total | 805 (100.0%) | 421 (100.0%) |
Housing Structure by Heating Type in Lodi
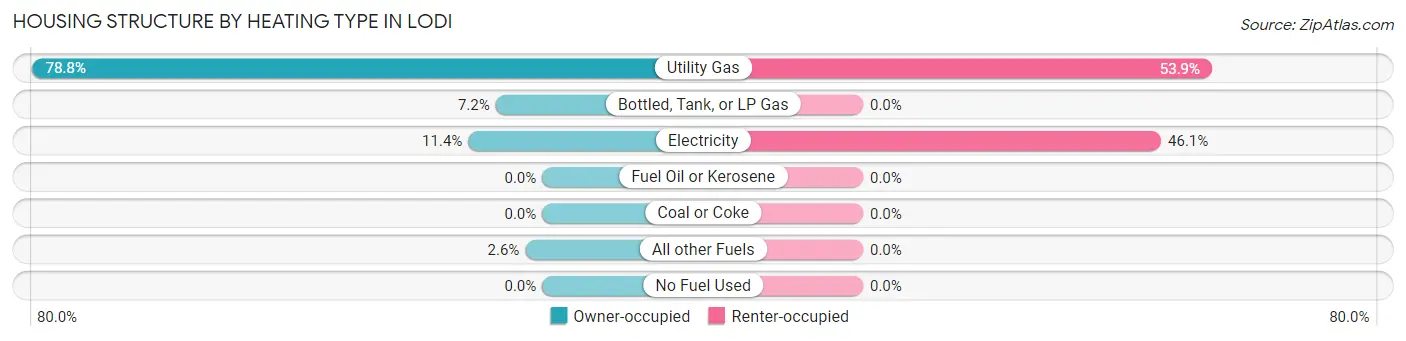
| Heating Type | Owner-occupied | Renter-occupied |
| Utility Gas | 634 (78.8%) | 227 (53.9%) |
| Bottled, Tank, or LP Gas | 58 (7.2%) | 0 (0.0%) |
| Electricity | 92 (11.4%) | 194 (46.1%) |
| Fuel Oil or Kerosene | 0 (0.0%) | 0 (0.0%) |
| Coal or Coke | 0 (0.0%) | 0 (0.0%) |
| All other Fuels | 21 (2.6%) | 0 (0.0%) |
| No Fuel Used | 0 (0.0%) | 0 (0.0%) |
| Total | 805 (100.0%) | 421 (100.0%) |
Household Vehicle Usage in Lodi
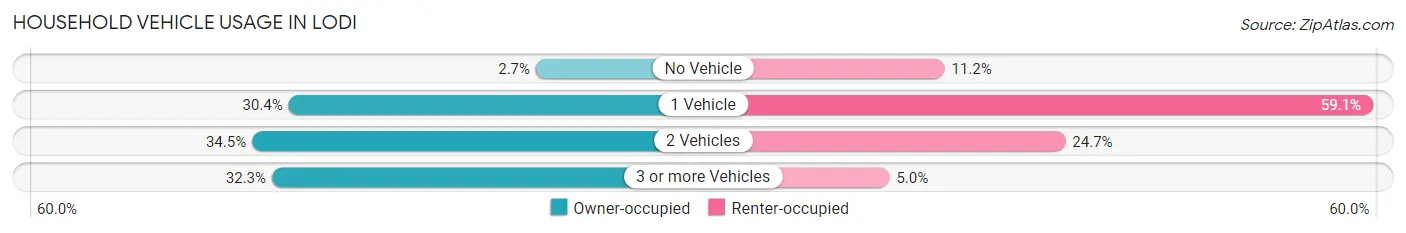
| Vehicles per Household | Owner-occupied | Renter-occupied |
| No Vehicle | 22 (2.7%) | 47 (11.2%) |
| 1 Vehicle | 245 (30.4%) | 249 (59.1%) |
| 2 Vehicles | 278 (34.5%) | 104 (24.7%) |
| 3 or more Vehicles | 260 (32.3%) | 21 (5.0%) |
| Total | 805 (100.0%) | 421 (100.0%) |
Real Estate & Mortgages in Lodi
Real Estate and Mortgage Overview in Lodi
| Characteristic | Without Mortgage | With Mortgage |
| Housing Units | 321 | 484 |
| Median Property Value | $140,900 | $151,300 |
| Median Household Income | $49,141 | $0 |
| Monthly Housing Costs | $478 | $0 |
| Real Estate Taxes | $2,440 | $47 |
Property Value by Mortgage Status in Lodi
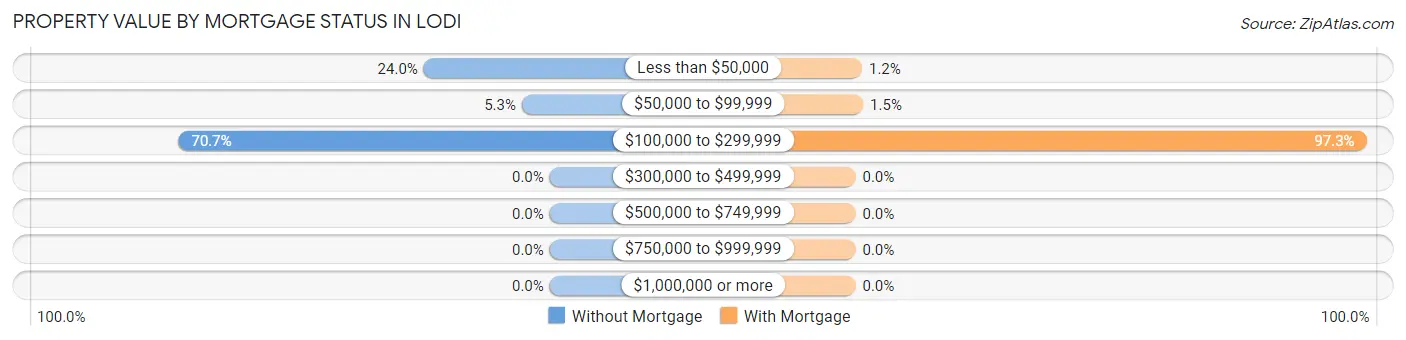
| Property Value | Without Mortgage | With Mortgage |
| Less than $50,000 | 77 (24.0%) | 6 (1.2%) |
| $50,000 to $99,999 | 17 (5.3%) | 7 (1.5%) |
| $100,000 to $299,999 | 227 (70.7%) | 471 (97.3%) |
| $300,000 to $499,999 | 0 (0.0%) | 0 (0.0%) |
| $500,000 to $749,999 | 0 (0.0%) | 0 (0.0%) |
| $750,000 to $999,999 | 0 (0.0%) | 0 (0.0%) |
| $1,000,000 or more | 0 (0.0%) | 0 (0.0%) |
| Total | 321 (100.0%) | 484 (100.0%) |
Household Income by Mortgage Status in Lodi
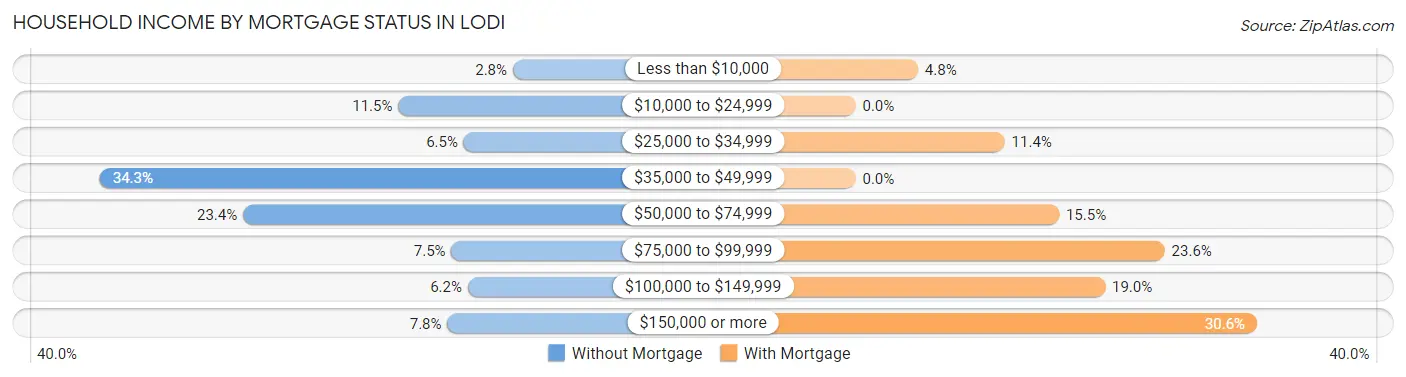
| Household Income | Without Mortgage | With Mortgage |
| Less than $10,000 | 9 (2.8%) | 23 (4.8%) |
| $10,000 to $24,999 | 37 (11.5%) | 0 (0.0%) |
| $25,000 to $34,999 | 21 (6.5%) | 55 (11.4%) |
| $35,000 to $49,999 | 110 (34.3%) | 0 (0.0%) |
| $50,000 to $74,999 | 75 (23.4%) | 75 (15.5%) |
| $75,000 to $99,999 | 24 (7.5%) | 114 (23.5%) |
| $100,000 to $149,999 | 20 (6.2%) | 92 (19.0%) |
| $150,000 or more | 25 (7.8%) | 148 (30.6%) |
| Total | 321 (100.0%) | 484 (100.0%) |
Property Value to Household Income Ratio in Lodi
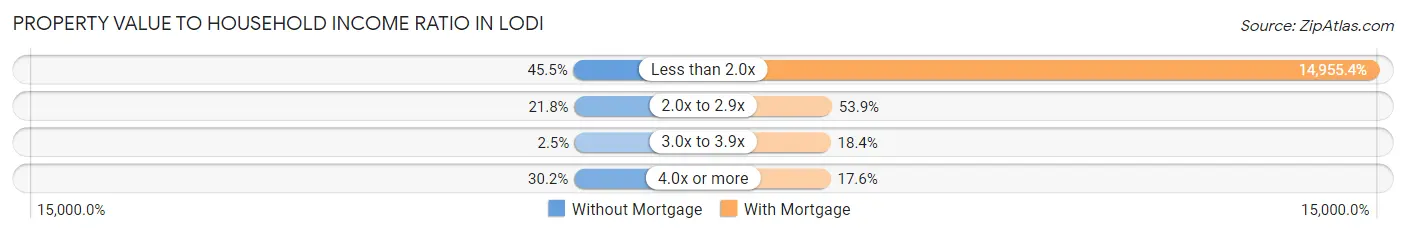
| Value-to-Income Ratio | Without Mortgage | With Mortgage |
| Less than 2.0x | 146 (45.5%) | 72,384 (14,955.4%) |
| 2.0x to 2.9x | 70 (21.8%) | 261 (53.9%) |
| 3.0x to 3.9x | 8 (2.5%) | 89 (18.4%) |
| 4.0x or more | 97 (30.2%) | 85 (17.6%) |
| Total | 321 (100.0%) | 484 (100.0%) |
Real Estate Taxes by Mortgage Status in Lodi
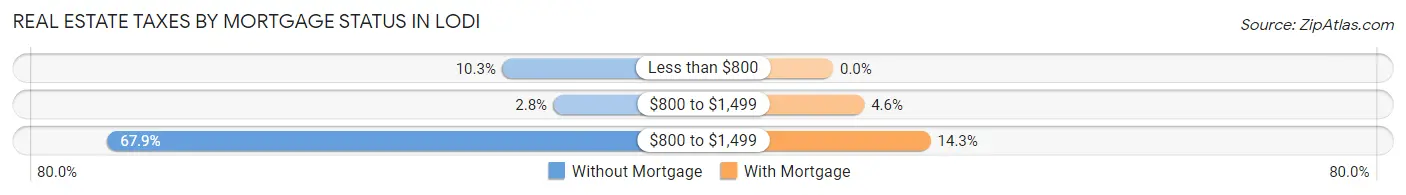
| Property Taxes | Without Mortgage | With Mortgage |
| Less than $800 | 33 (10.3%) | 0 (0.0%) |
| $800 to $1,499 | 9 (2.8%) | 22 (4.5%) |
| $800 to $1,499 | 218 (67.9%) | 69 (14.3%) |
| Total | 321 (100.0%) | 484 (100.0%) |
Health & Disability in Lodi
Health Insurance Coverage by Age in Lodi
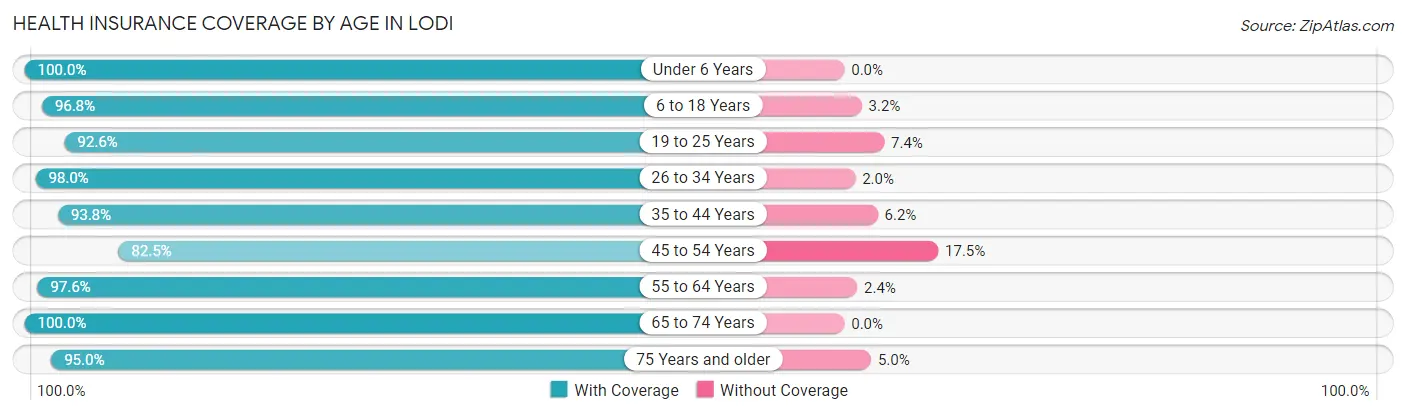
| Age Bracket | With Coverage | Without Coverage |
| Under 6 Years | 219 (100.0%) | 0 (0.0%) |
| 6 to 18 Years | 361 (96.8%) | 12 (3.2%) |
| 19 to 25 Years | 162 (92.6%) | 13 (7.4%) |
| 26 to 34 Years | 337 (98.0%) | 7 (2.0%) |
| 35 to 44 Years | 408 (93.8%) | 27 (6.2%) |
| 45 to 54 Years | 330 (82.5%) | 70 (17.5%) |
| 55 to 64 Years | 368 (97.6%) | 9 (2.4%) |
| 65 to 74 Years | 280 (100.0%) | 0 (0.0%) |
| 75 Years and older | 153 (95.0%) | 8 (5.0%) |
| Total | 2,618 (94.7%) | 146 (5.3%) |
Health Insurance Coverage by Citizenship Status in Lodi
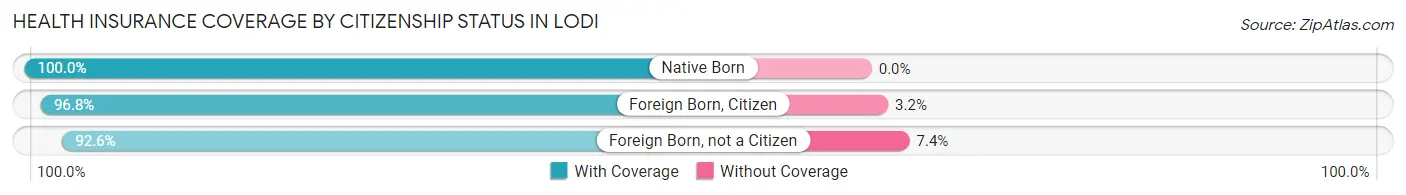
| Citizenship Status | With Coverage | Without Coverage |
| Native Born | 219 (100.0%) | 0 (0.0%) |
| Foreign Born, Citizen | 361 (96.8%) | 12 (3.2%) |
| Foreign Born, not a Citizen | 162 (92.6%) | 13 (7.4%) |
Health Insurance Coverage by Household Income in Lodi
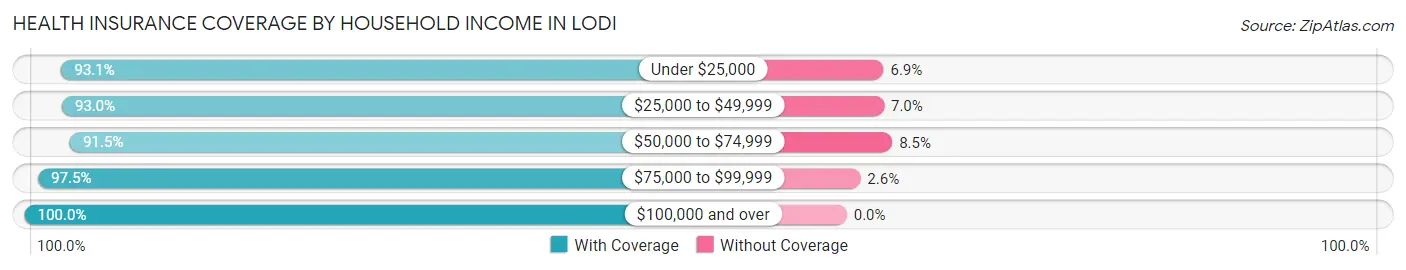
| Household Income | With Coverage | Without Coverage |
| Under $25,000 | 230 (93.1%) | 17 (6.9%) |
| $25,000 to $49,999 | 680 (93.0%) | 51 (7.0%) |
| $50,000 to $74,999 | 753 (91.5%) | 70 (8.5%) |
| $75,000 to $99,999 | 306 (97.5%) | 8 (2.5%) |
| $100,000 and over | 617 (100.0%) | 0 (0.0%) |
Public vs Private Health Insurance Coverage by Age in Lodi
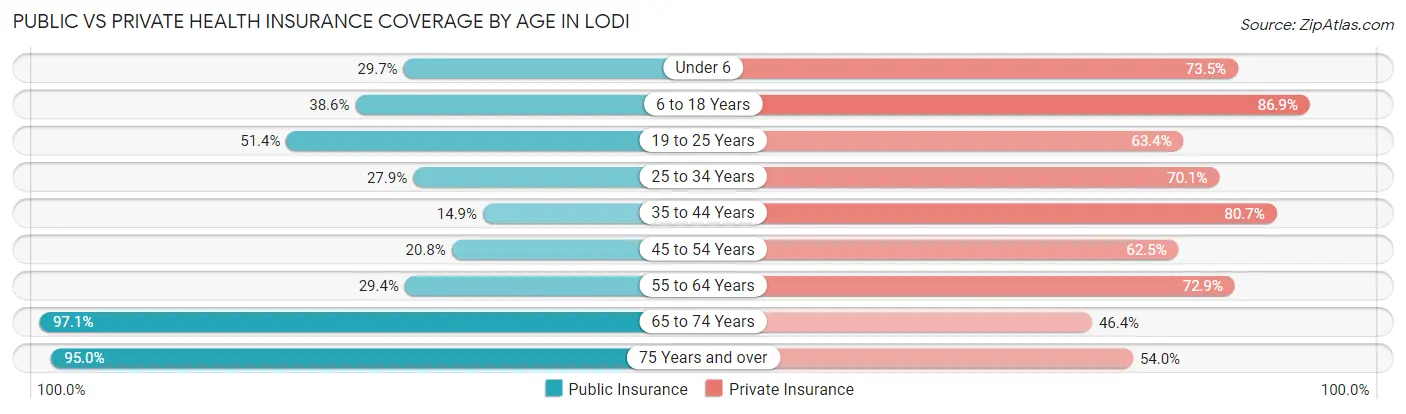
| Age Bracket | Public Insurance | Private Insurance |
| Under 6 | 65 (29.7%) | 161 (73.5%) |
| 6 to 18 Years | 144 (38.6%) | 324 (86.9%) |
| 19 to 25 Years | 90 (51.4%) | 111 (63.4%) |
| 25 to 34 Years | 96 (27.9%) | 241 (70.1%) |
| 35 to 44 Years | 65 (14.9%) | 351 (80.7%) |
| 45 to 54 Years | 83 (20.7%) | 250 (62.5%) |
| 55 to 64 Years | 111 (29.4%) | 275 (72.9%) |
| 65 to 74 Years | 272 (97.1%) | 130 (46.4%) |
| 75 Years and over | 153 (95.0%) | 87 (54.0%) |
| Total | 1,079 (39.0%) | 1,930 (69.8%) |
Disability Status by Sex by Age in Lodi
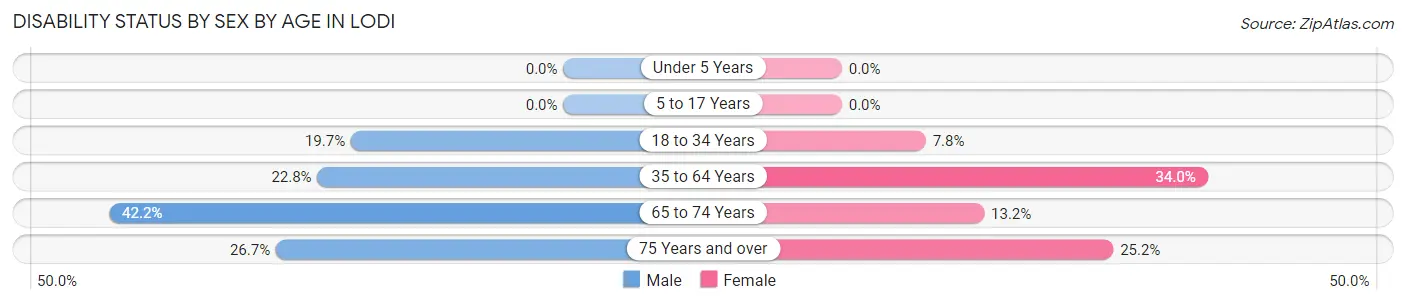
| Age Bracket | Male | Female |
| Under 5 Years | 0 (0.0%) | 0 (0.0%) |
| 5 to 17 Years | 0 (0.0%) | 0 (0.0%) |
| 18 to 34 Years | 41 (19.7%) | 25 (7.8%) |
| 35 to 64 Years | 165 (22.8%) | 166 (34.0%) |
| 65 to 74 Years | 51 (42.1%) | 21 (13.2%) |
| 75 Years and over | 8 (26.7%) | 33 (25.2%) |
Disability Class by Sex by Age in Lodi
Disability Class: Hearing Difficulty
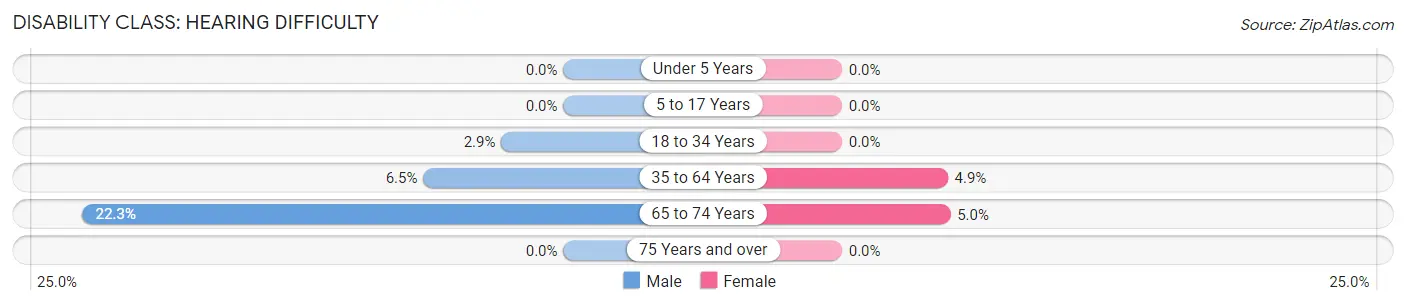
| Age Bracket | Male | Female |
| Under 5 Years | 0 (0.0%) | 0 (0.0%) |
| 5 to 17 Years | 0 (0.0%) | 0 (0.0%) |
| 18 to 34 Years | 6 (2.9%) | 0 (0.0%) |
| 35 to 64 Years | 47 (6.5%) | 24 (4.9%) |
| 65 to 74 Years | 27 (22.3%) | 8 (5.0%) |
| 75 Years and over | 0 (0.0%) | 0 (0.0%) |
Disability Class: Vision Difficulty
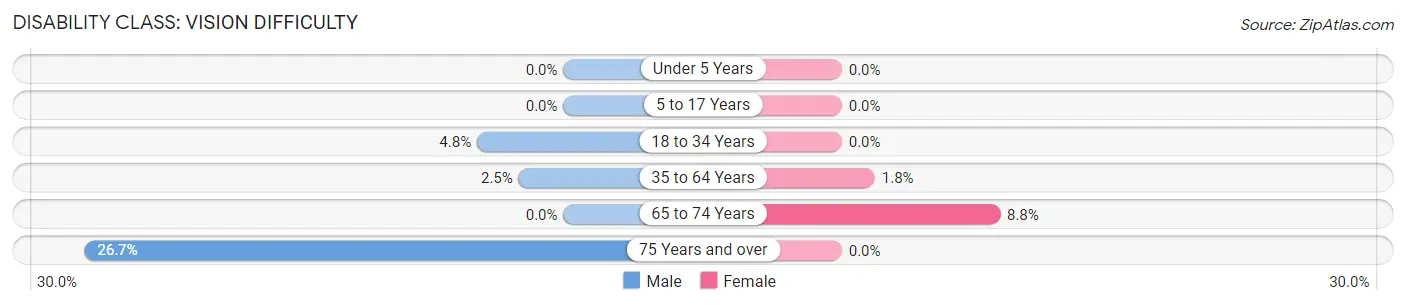
| Age Bracket | Male | Female |
| Under 5 Years | 0 (0.0%) | 0 (0.0%) |
| 5 to 17 Years | 0 (0.0%) | 0 (0.0%) |
| 18 to 34 Years | 10 (4.8%) | 0 (0.0%) |
| 35 to 64 Years | 18 (2.5%) | 9 (1.8%) |
| 65 to 74 Years | 0 (0.0%) | 14 (8.8%) |
| 75 Years and over | 8 (26.7%) | 0 (0.0%) |
Disability Class: Cognitive Difficulty
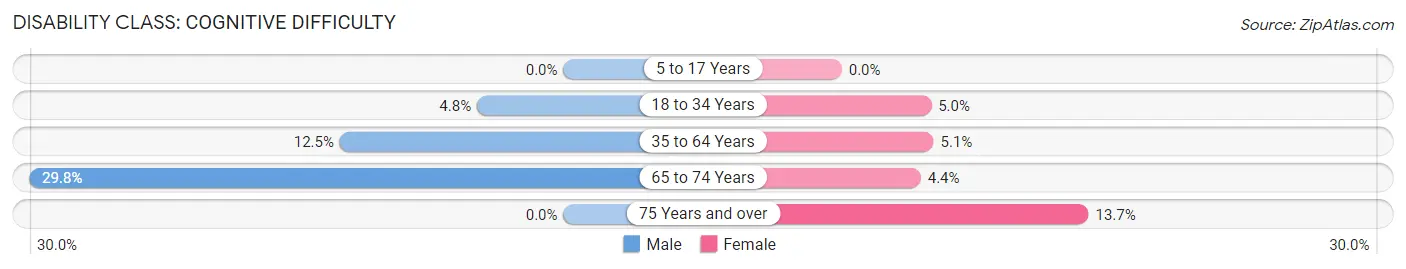
| Age Bracket | Male | Female |
| 5 to 17 Years | 0 (0.0%) | 0 (0.0%) |
| 18 to 34 Years | 10 (4.8%) | 16 (5.0%) |
| 35 to 64 Years | 90 (12.4%) | 25 (5.1%) |
| 65 to 74 Years | 36 (29.7%) | 7 (4.4%) |
| 75 Years and over | 0 (0.0%) | 18 (13.7%) |
Disability Class: Ambulatory Difficulty
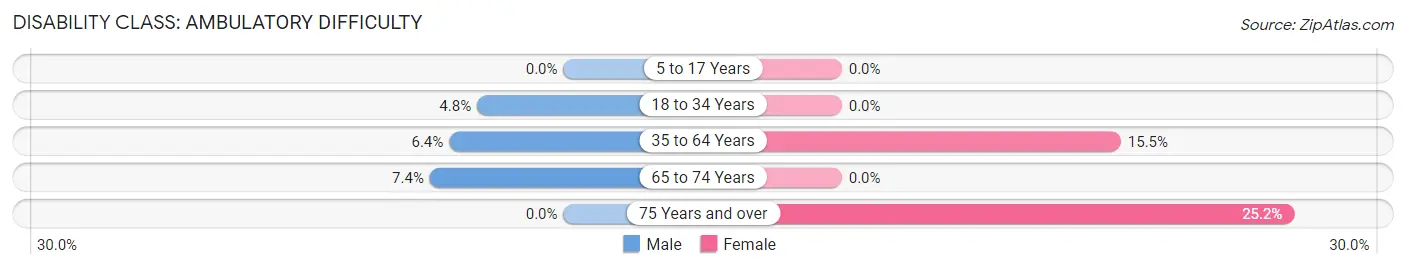
| Age Bracket | Male | Female |
| 5 to 17 Years | 0 (0.0%) | 0 (0.0%) |
| 18 to 34 Years | 10 (4.8%) | 0 (0.0%) |
| 35 to 64 Years | 46 (6.4%) | 76 (15.5%) |
| 65 to 74 Years | 9 (7.4%) | 0 (0.0%) |
| 75 Years and over | 0 (0.0%) | 33 (25.2%) |
Disability Class: Self-Care Difficulty
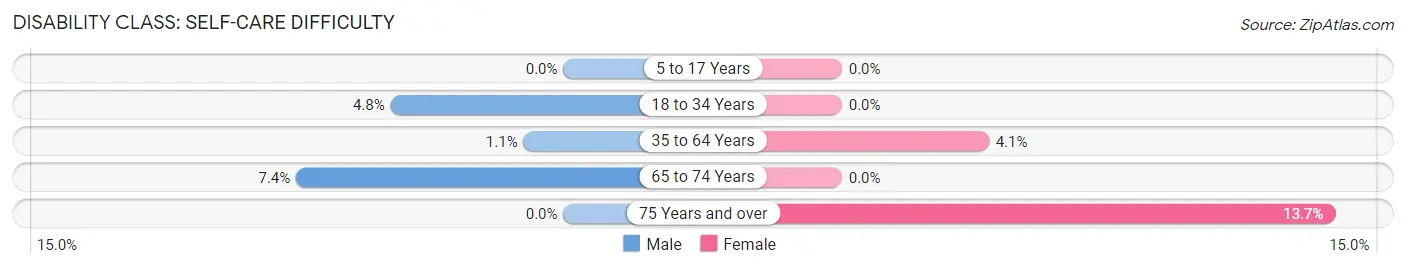
| Age Bracket | Male | Female |
| 5 to 17 Years | 0 (0.0%) | 0 (0.0%) |
| 18 to 34 Years | 10 (4.8%) | 0 (0.0%) |
| 35 to 64 Years | 8 (1.1%) | 20 (4.1%) |
| 65 to 74 Years | 9 (7.4%) | 0 (0.0%) |
| 75 Years and over | 0 (0.0%) | 18 (13.7%) |
Technology Access in Lodi
Computing Device Access in Lodi
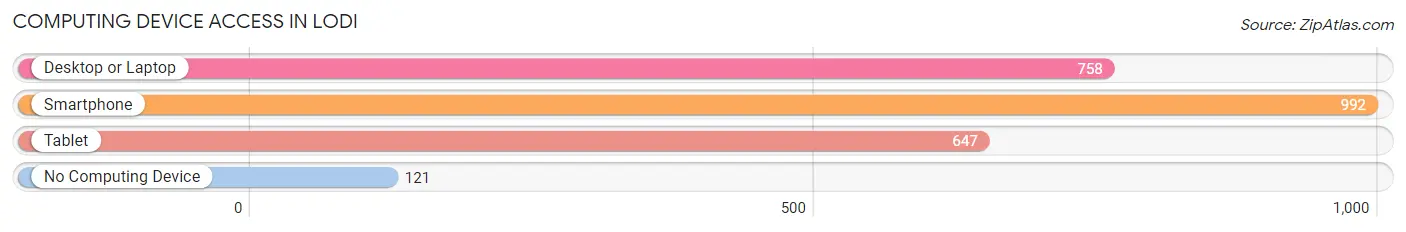
| Device Type | # Households | % Households |
| Desktop or Laptop | 758 | 61.8% |
| Smartphone | 992 | 80.9% |
| Tablet | 647 | 52.8% |
| No Computing Device | 121 | 9.9% |
| Total | 1,226 | 100.0% |
Internet Access in Lodi
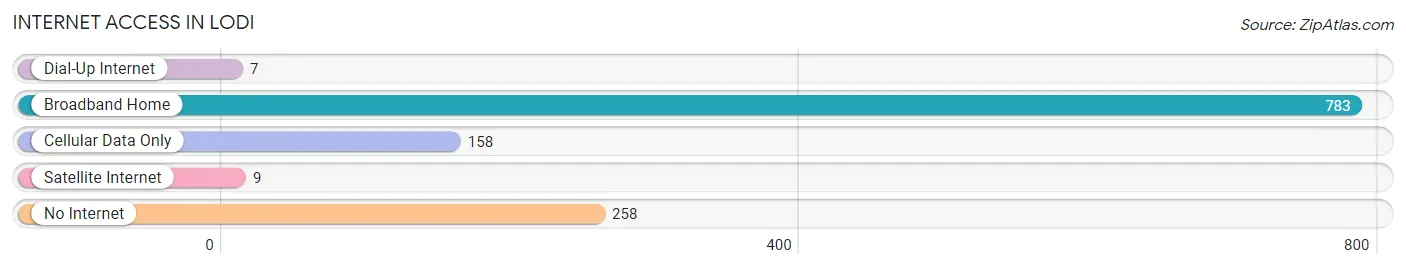
| Internet Type | # Households | % Households |
| Dial-Up Internet | 7 | 0.6% |
| Broadband Home | 783 | 63.9% |
| Cellular Data Only | 158 | 12.9% |
| Satellite Internet | 9 | 0.7% |
| No Internet | 258 | 21.0% |
| Total | 1,226 | 100.0% |
Lodi Summary
Lodi, Ohio is a small village located in Medina County, Ohio. It is situated approximately 30 miles south of Cleveland and is part of the Greater Cleveland Metropolitan Area. The village has a population of approximately 3,000 people and is known for its rural charm and small-town atmosphere.
History
Lodi was founded in 1817 by a group of settlers from Connecticut. The village was originally known as “Lodisville” and was named after the town of Lodi, Connecticut. The first settlers were primarily farmers and the village grew slowly over the years. In 1820, the first post office was established and the village was officially incorporated in 1837.
In the late 19th century, Lodi began to experience a period of growth and development. The village was connected to the railroad in 1881 and the first bank was established in 1883. The village also saw the construction of several churches, a school, and a library.
In the early 20th century, Lodi experienced a period of decline. The railroad was abandoned in the 1920s and the village’s population began to decline. The Great Depression also had a negative impact on the village and many businesses closed.
Geography
Lodi is located in the western part of Medina County, Ohio. The village is situated on the banks of the Chippewa Creek and is surrounded by rolling hills and farmland. The village is located approximately 30 miles south of Cleveland and is part of the Greater Cleveland Metropolitan Area.
Economy
Lodi’s economy is primarily based on agriculture and tourism. The village is home to several farms and is known for its rural charm and small-town atmosphere. The village also has several small businesses, including restaurants, shops, and a grocery store.
Demographics
As of the 2010 census, the population of Lodi was 3,000. The racial makeup of the village was 97.2% White, 0.7% African American, 0.3% Native American, 0.3% Asian, and 1.5% from other races. The median household income was $45,000 and the median family income was $50,000.
Conclusion
Lodi, Ohio is a small village located in Medina County, Ohio. It is situated approximately 30 miles south of Cleveland and is part of the Greater Cleveland Metropolitan Area. The village has a population of approximately 3,000 people and is known for its rural charm and small-town atmosphere. The village’s economy is primarily based on agriculture and tourism and the village is home to several farms. The racial makeup of the village is predominantly White and the median household income is $45,000.
Common Questions
What is Per Capita Income in Lodi?
Per Capita income in Lodi is $27,735.
What is the Median Family Income in Lodi?
Median Family Income in Lodi is $65,057.
What is the Median Household income in Lodi?
Median Household Income in Lodi is $55,284.
What is Income or Wage Gap in Lodi?
Income or Wage Gap in Lodi is 32.9%.
Women in Lodi earn 67.1 cents for every dollar earned by a man.
What is Inequality or Gini Index in Lodi?
Inequality or Gini Index in Lodi is 0.33.
What is the Total Population of Lodi?
Total Population of Lodi is 2,764.
What is the Total Male Population of Lodi?
Total Male Population of Lodi is 1,347.
What is the Total Female Population of Lodi?
Total Female Population of Lodi is 1,417.
What is the Ratio of Males per 100 Females in Lodi?
There are 95.06 Males per 100 Females in Lodi.
What is the Ratio of Females per 100 Males in Lodi?
There are 105.20 Females per 100 Males in Lodi.
What is the Median Population Age in Lodi?
Median Population Age in Lodi is 40.6 Years.
What is the Average Family Size in Lodi
Average Family Size in Lodi is 2.8 People.
What is the Average Household Size in Lodi
Average Household Size in Lodi is 2.2 People.
How Large is the Labor Force in Lodi?
There are 1,555 People in the Labor Forcein in Lodi.
What is the Percentage of People in the Labor Force in Lodi?
69.0% of People are in the Labor Force in Lodi.
What is the Unemployment Rate in Lodi?
Unemployment Rate in Lodi is 3.7%.