Hubbard, OH Map & Demographics
Hubbard Map
Hubbard Overview
$37,687
PER CAPITA INCOME
$83,587
AVG FAMILY INCOME
$61,064
AVG HOUSEHOLD INCOME
38.7%
WAGE / INCOME GAP [ % ]
61.3¢/ $1
WAGE / INCOME GAP [ $ ]
0.42
INEQUALITY / GINI INDEX
7,618
TOTAL POPULATION
3,584
MALE POPULATION
4,034
FEMALE POPULATION
88.84
MALES / 100 FEMALES
112.56
FEMALES / 100 MALES
44.7
MEDIAN AGE
2.9
AVG FAMILY SIZE
2.2
AVG HOUSEHOLD SIZE
4,143
LABOR FORCE [ PEOPLE ]
64.4%
PERCENT IN LABOR FORCE
2.6%
UNEMPLOYMENT RATE
Hubbard Zip Codes
Hubbard Area Codes
Income in Hubbard
Income Overview in Hubbard
Per Capita Income in Hubbard is $37,687, while median incomes of families and households are $83,587 and $61,064 respectively.
| Characteristic | Number | Measure |
| Per Capita Income | 7,618 | $37,687 |
| Median Family Income | 2,080 | $83,587 |
| Mean Family Income | 2,080 | $100,692 |
| Median Household Income | 3,380 | $61,064 |
| Mean Household Income | 3,380 | $83,156 |
| Income Deficit | 2,080 | $0 |
| Wage / Income Gap (%) | 7,618 | 38.65% |
| Wage / Income Gap ($) | 7,618 | 61.35¢ per $1 |
| Gini / Inequality Index | 7,618 | 0.42 |
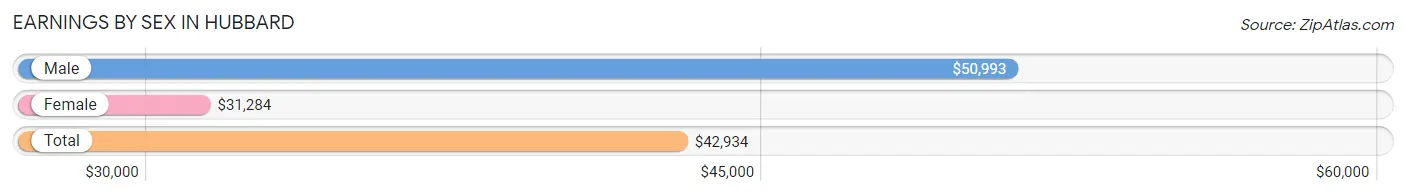
Earnings by Sex in Hubbard
Average Earnings in Hubbard are $42,934, $50,993 for men and $31,284 for women, a difference of 38.7%.
| Sex | Number | Average Earnings |
| Male | 2,131 (48.8%) | $50,993 |
| Female | 2,238 (51.2%) | $31,284 |
| Total | 4,369 (100.0%) | $42,934 |
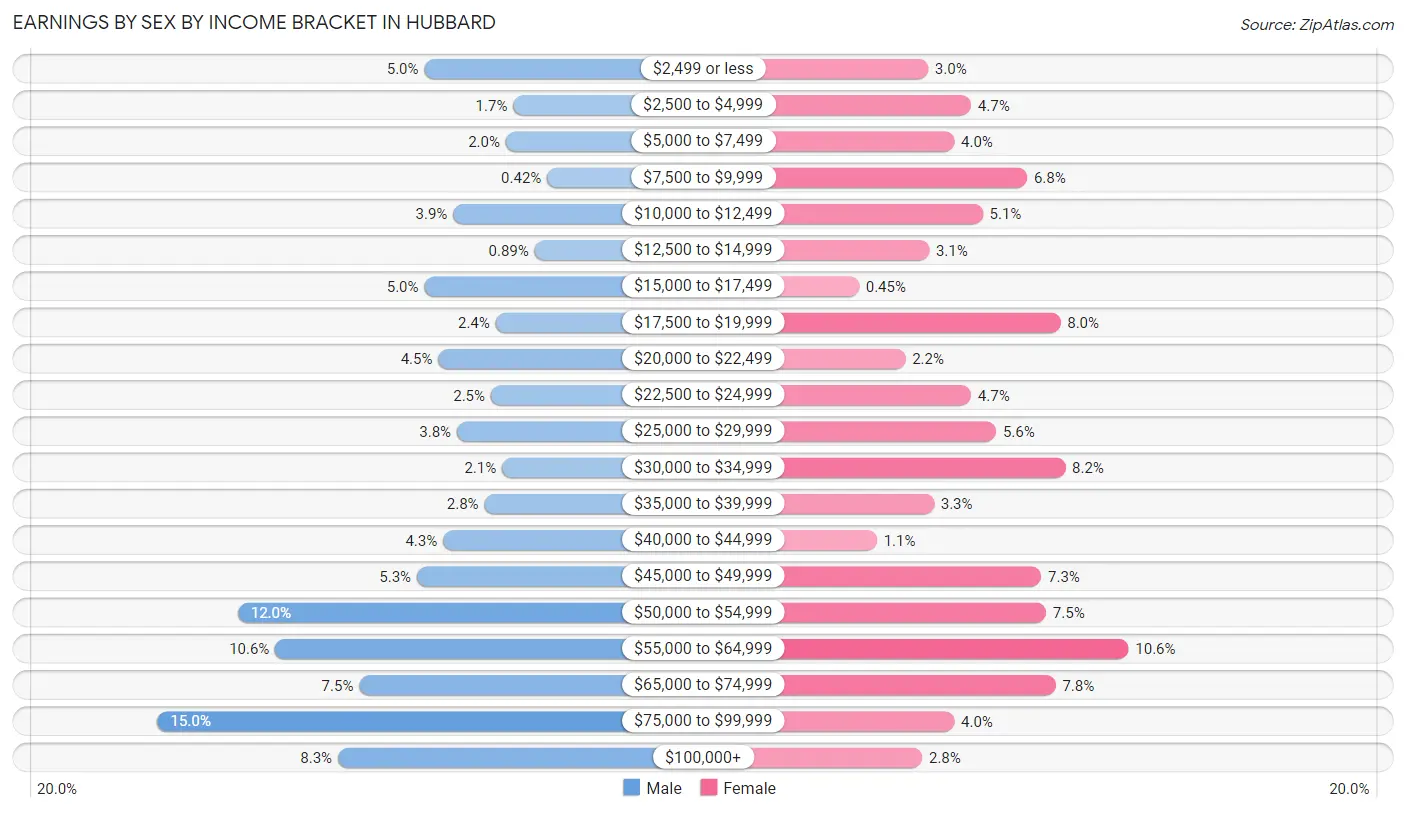
Earnings by Sex by Income Bracket in Hubbard
The most common earnings brackets in Hubbard are $75,000 to $99,999 for men (320 | 15.0%) and $55,000 to $64,999 for women (236 | 10.5%).
| Income | Male | Female |
| $2,499 or less | 107 (5.0%) | 68 (3.0%) |
| $2,500 to $4,999 | 36 (1.7%) | 104 (4.6%) |
| $5,000 to $7,499 | 42 (2.0%) | 90 (4.0%) |
| $7,500 to $9,999 | 9 (0.4%) | 151 (6.8%) |
| $10,000 to $12,499 | 84 (3.9%) | 114 (5.1%) |
| $12,500 to $14,999 | 19 (0.9%) | 69 (3.1%) |
| $15,000 to $17,499 | 107 (5.0%) | 10 (0.4%) |
| $17,500 to $19,999 | 50 (2.4%) | 179 (8.0%) |
| $20,000 to $22,499 | 96 (4.5%) | 49 (2.2%) |
| $22,500 to $24,999 | 54 (2.5%) | 104 (4.6%) |
| $25,000 to $29,999 | 81 (3.8%) | 125 (5.6%) |
| $30,000 to $34,999 | 45 (2.1%) | 183 (8.2%) |
| $35,000 to $39,999 | 59 (2.8%) | 73 (3.3%) |
| $40,000 to $44,999 | 92 (4.3%) | 25 (1.1%) |
| $45,000 to $49,999 | 113 (5.3%) | 163 (7.3%) |
| $50,000 to $54,999 | 256 (12.0%) | 167 (7.5%) |
| $55,000 to $64,999 | 226 (10.6%) | 236 (10.5%) |
| $65,000 to $74,999 | 159 (7.5%) | 175 (7.8%) |
| $75,000 to $99,999 | 320 (15.0%) | 90 (4.0%) |
| $100,000+ | 176 (8.3%) | 63 (2.8%) |
| Total | 2,131 (100.0%) | 2,238 (100.0%) |
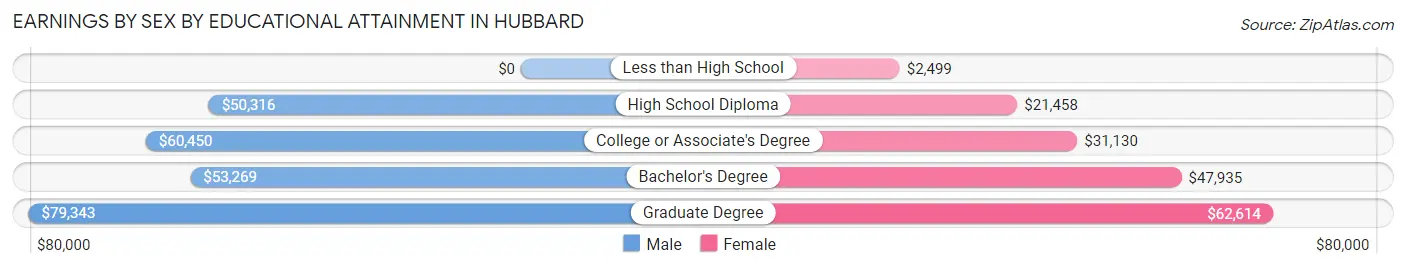
Earnings by Sex by Educational Attainment in Hubbard
Average earnings in Hubbard are $52,264 for men and $34,318 for women, a difference of 34.3%. Men with an educational attainment of graduate degree enjoy the highest average annual earnings of $79,343, while those with high school diploma education earn the least with $50,316. Women with an educational attainment of graduate degree earn the most with the average annual earnings of $62,614, while those with less than high school education have the smallest earnings of $2,499.
| Educational Attainment | Male Income | Female Income |
| Less than High School | - | - |
| High School Diploma | $50,316 | $21,458 |
| College or Associate's Degree | $60,450 | $31,130 |
| Bachelor's Degree | $53,269 | $47,935 |
| Graduate Degree | $79,343 | $62,614 |
| Total | $52,264 | $34,318 |
Family Income in Hubbard
Family Income Brackets in Hubbard
According to the Hubbard family income data, there are 505 families falling into the $100,000 to $149,999 income range, which is the most common income bracket and makes up 24.3% of all families.
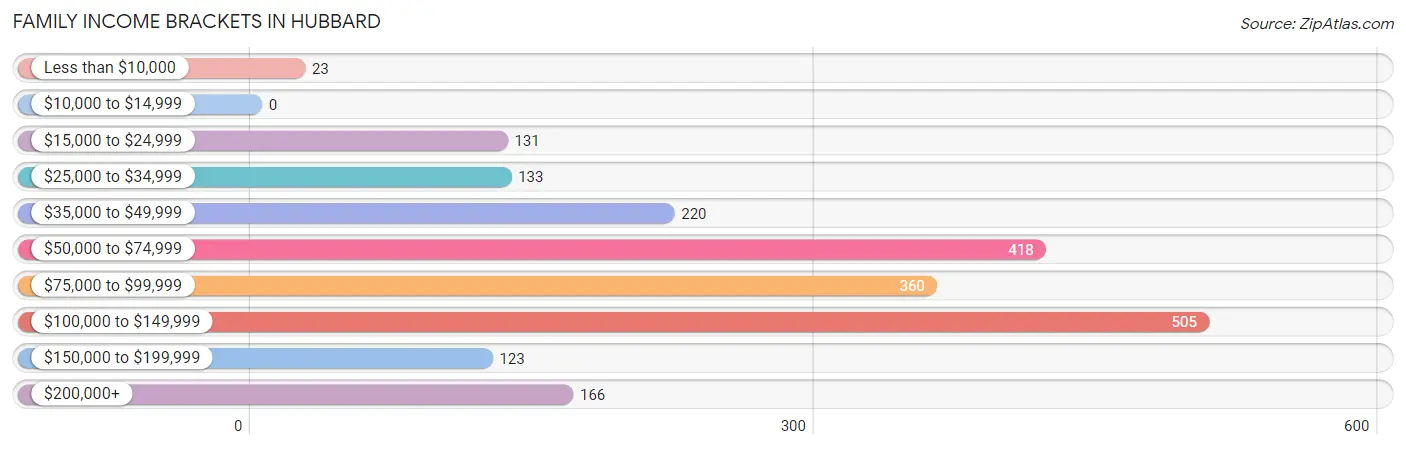
| Income Bracket | # Families | % Families |
| Less than $10,000 | 23 | 1.1% |
| $10,000 to $14,999 | 0 | 0.0% |
| $15,000 to $24,999 | 131 | 6.3% |
| $25,000 to $34,999 | 133 | 6.4% |
| $35,000 to $49,999 | 220 | 10.6% |
| $50,000 to $74,999 | 418 | 20.1% |
| $75,000 to $99,999 | 360 | 17.3% |
| $100,000 to $149,999 | 505 | 24.3% |
| $150,000 to $199,999 | 123 | 5.9% |
| $200,000+ | 166 | 8.0% |
Family Income by Famaliy Size in Hubbard
4-person families (331 | 15.9%) account for the highest median family income in Hubbard with $108,990 per family, while 2-person families (1,038 | 49.9%) have the highest median income of $37,012 per family member.
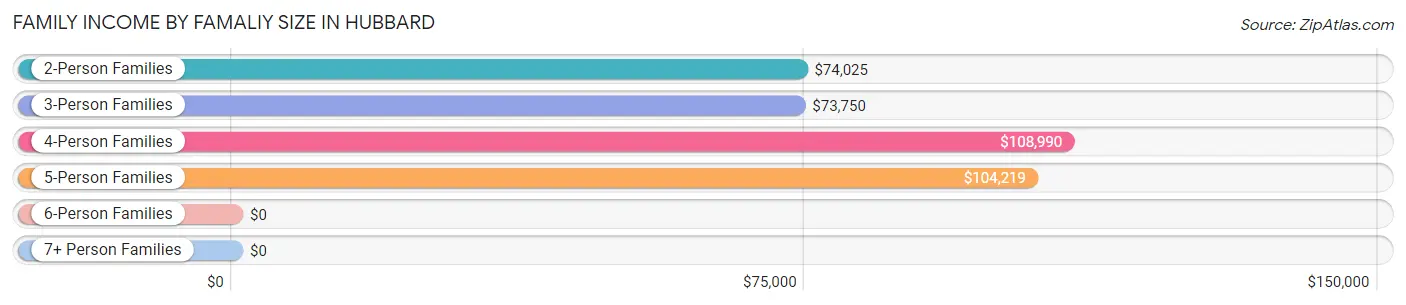
| Income Bracket | # Families | Median Income |
| 2-Person Families | 1,038 (49.9%) | $74,025 |
| 3-Person Families | 602 (28.9%) | $73,750 |
| 4-Person Families | 331 (15.9%) | $108,990 |
| 5-Person Families | 109 (5.2%) | $104,219 |
| 6-Person Families | 0 (0.0%) | $0 |
| 7+ Person Families | 0 (0.0%) | $0 |
| Total | 2,080 (100.0%) | $83,587 |
Family Income by Number of Earners in Hubbard
The median family income in Hubbard is $83,587, with families comprising 3+ earners (249) having the highest median family income of $109,980, while families with 1 earner (611) have the lowest median family income of $50,568, accounting for 12.0% and 29.4% of families, respectively.
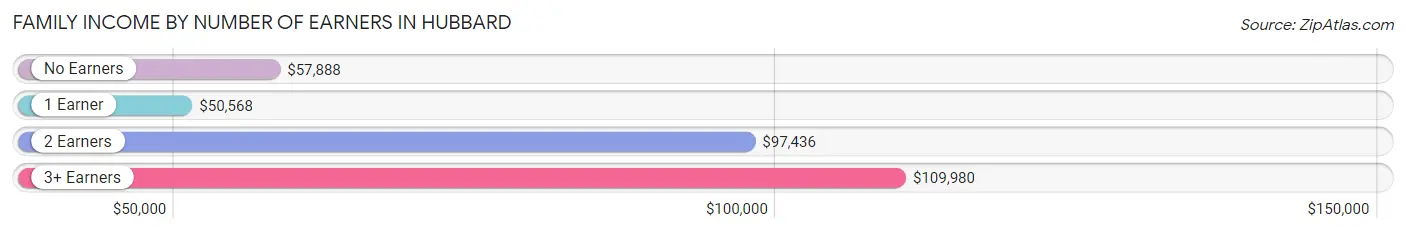
| Number of Earners | # Families | Median Income |
| No Earners | 337 (16.2%) | $57,888 |
| 1 Earner | 611 (29.4%) | $50,568 |
| 2 Earners | 883 (42.4%) | $97,436 |
| 3+ Earners | 249 (12.0%) | $109,980 |
| Total | 2,080 (100.0%) | $83,587 |
Household Income in Hubbard
Household Income Brackets in Hubbard
With 713 households falling in the category, the $50,000 to $74,999 income range is the most frequent in Hubbard, accounting for 21.1% of all households. In contrast, only 47 households (1.4%) fall into the $10,000 to $14,999 income bracket, making it the least populous group.
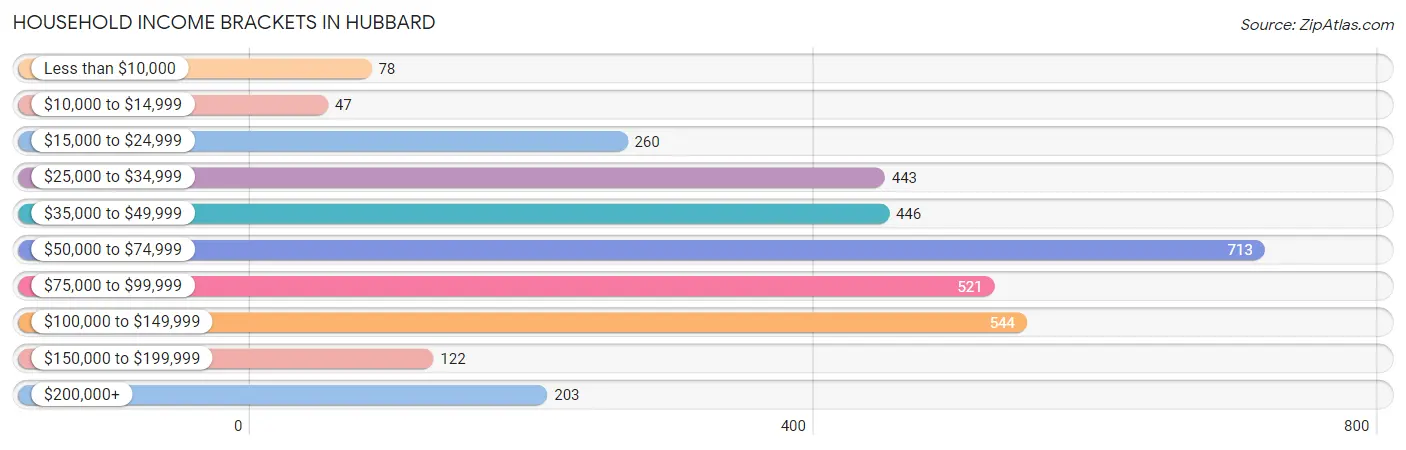
| Income Bracket | # Households | % Households |
| Less than $10,000 | 78 | 2.3% |
| $10,000 to $14,999 | 47 | 1.4% |
| $15,000 to $24,999 | 260 | 7.7% |
| $25,000 to $34,999 | 443 | 13.1% |
| $35,000 to $49,999 | 446 | 13.2% |
| $50,000 to $74,999 | 713 | 21.1% |
| $75,000 to $99,999 | 521 | 15.4% |
| $100,000 to $149,999 | 544 | 16.1% |
| $150,000 to $199,999 | 122 | 3.6% |
| $200,000+ | 203 | 6.0% |
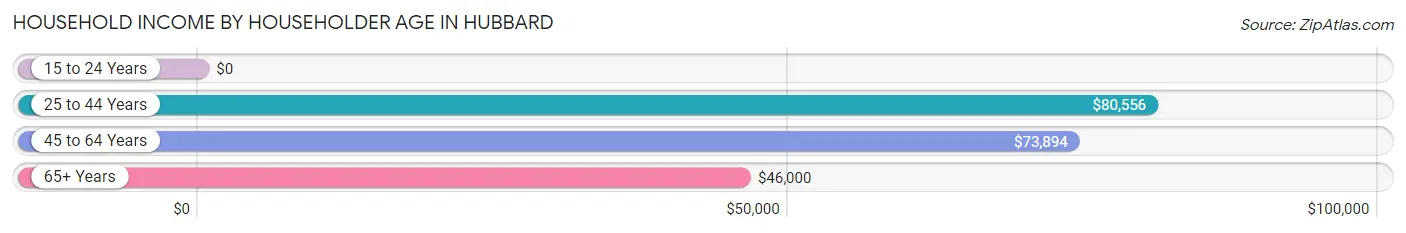
Household Income by Householder Age in Hubbard
The median household income in Hubbard is $61,064, with the highest median household income of $80,556 found in the 25 to 44 years age bracket for the primary householder. A total of 868 households (25.7%) fall into this category. Meanwhile, the 15 to 24 years age bracket for the primary householder has the lowest median household income of $0, with 92 households (2.7%) in this group.
| Income Bracket | # Households | Median Income |
| 15 to 24 Years | 92 (2.7%) | $0 |
| 25 to 44 Years | 868 (25.7%) | $80,556 |
| 45 to 64 Years | 1,306 (38.6%) | $73,894 |
| 65+ Years | 1,114 (33.0%) | $46,000 |
| Total | 3,380 (100.0%) | $61,064 |
Poverty in Hubbard
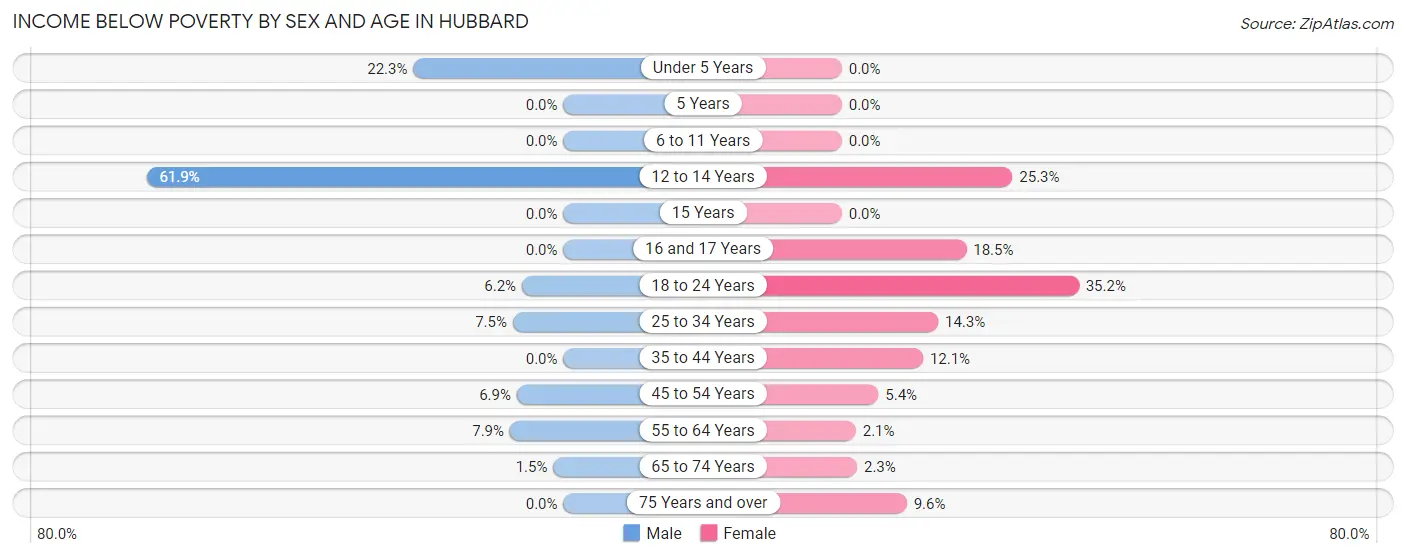
Income Below Poverty by Sex and Age in Hubbard
With 6.8% poverty level for males and 9.4% for females among the residents of Hubbard, 12 to 14 year old males and 18 to 24 year old females are the most vulnerable to poverty, with 65 males (61.9%) and 89 females (35.2%) in their respective age groups living below the poverty level.
| Age Bracket | Male | Female |
| Under 5 Years | 41 (22.3%) | 0 (0.0%) |
| 5 Years | 0 (0.0%) | 0 (0.0%) |
| 6 to 11 Years | 0 (0.0%) | 0 (0.0%) |
| 12 to 14 Years | 65 (61.9%) | 38 (25.3%) |
| 15 Years | 0 (0.0%) | 0 (0.0%) |
| 16 and 17 Years | 0 (0.0%) | 44 (18.5%) |
| 18 to 24 Years | 20 (6.1%) | 89 (35.2%) |
| 25 to 34 Years | 31 (7.5%) | 55 (14.3%) |
| 35 to 44 Years | 0 (0.0%) | 64 (12.0%) |
| 45 to 54 Years | 26 (6.9%) | 25 (5.4%) |
| 55 to 64 Years | 51 (7.9%) | 13 (2.1%) |
| 65 to 74 Years | 7 (1.5%) | 13 (2.3%) |
| 75 Years and over | 0 (0.0%) | 40 (9.6%) |
| Total | 241 (6.8%) | 381 (9.4%) |
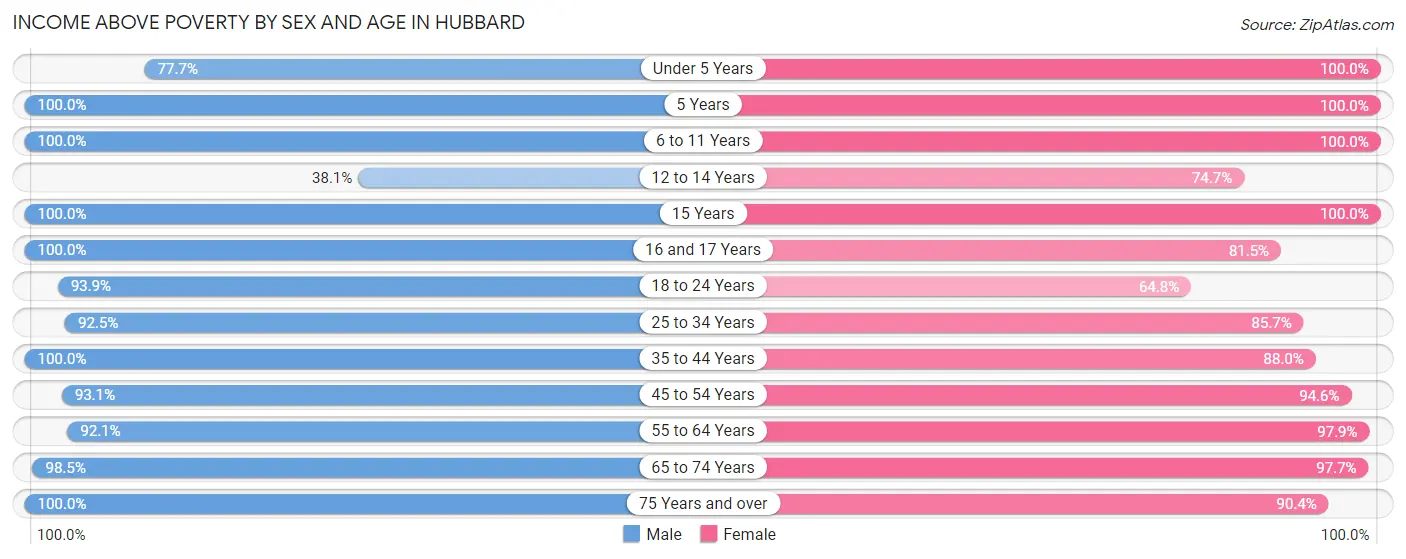
Income Above Poverty by Sex and Age in Hubbard
According to the poverty statistics in Hubbard, males aged 5 years and females aged under 5 years are the age groups that are most secure financially, with 100.0% of males and 100.0% of females in these age groups living above the poverty line.
| Age Bracket | Male | Female |
| Under 5 Years | 143 (77.7%) | 41 (100.0%) |
| 5 Years | 45 (100.0%) | 39 (100.0%) |
| 6 to 11 Years | 177 (100.0%) | 304 (100.0%) |
| 12 to 14 Years | 40 (38.1%) | 112 (74.7%) |
| 15 Years | 82 (100.0%) | 19 (100.0%) |
| 16 and 17 Years | 21 (100.0%) | 194 (81.5%) |
| 18 to 24 Years | 305 (93.9%) | 164 (64.8%) |
| 25 to 34 Years | 382 (92.5%) | 330 (85.7%) |
| 35 to 44 Years | 486 (100.0%) | 467 (87.9%) |
| 45 to 54 Years | 350 (93.1%) | 435 (94.6%) |
| 55 to 64 Years | 591 (92.1%) | 612 (97.9%) |
| 65 to 74 Years | 464 (98.5%) | 561 (97.7%) |
| 75 Years and over | 219 (100.0%) | 375 (90.4%) |
| Total | 3,305 (93.2%) | 3,653 (90.6%) |
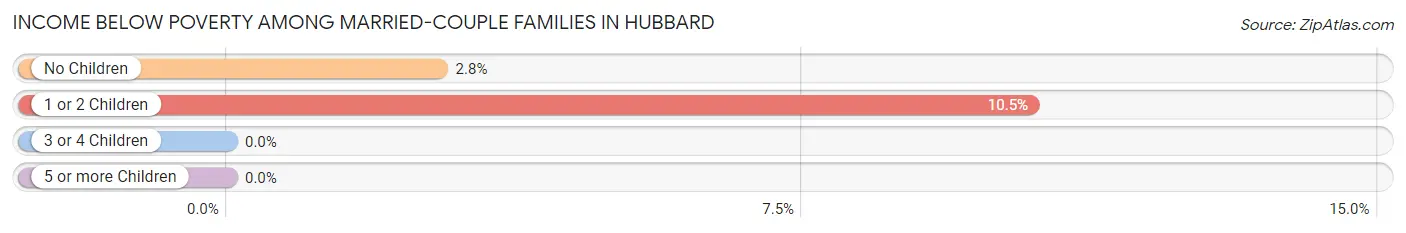
Income Below Poverty Among Married-Couple Families in Hubbard
The poverty statistics for married-couple families in Hubbard show that 5.0% or 75 of the total 1,497 families live below the poverty line. Families with 1 or 2 children have the highest poverty rate of 10.5%, comprising of 49 families. On the other hand, families with 3 or 4 children have the lowest poverty rate of 0.0%, which includes 0 families.
| Children | Above Poverty | Below Poverty |
| No Children | 919 (97.3%) | 26 (2.8%) |
| 1 or 2 Children | 419 (89.5%) | 49 (10.5%) |
| 3 or 4 Children | 84 (100.0%) | 0 (0.0%) |
| 5 or more Children | 0 (0.0%) | 0 (0.0%) |
| Total | 1,422 (95.0%) | 75 (5.0%) |
Income Below Poverty Among Single-Parent Households in Hubbard
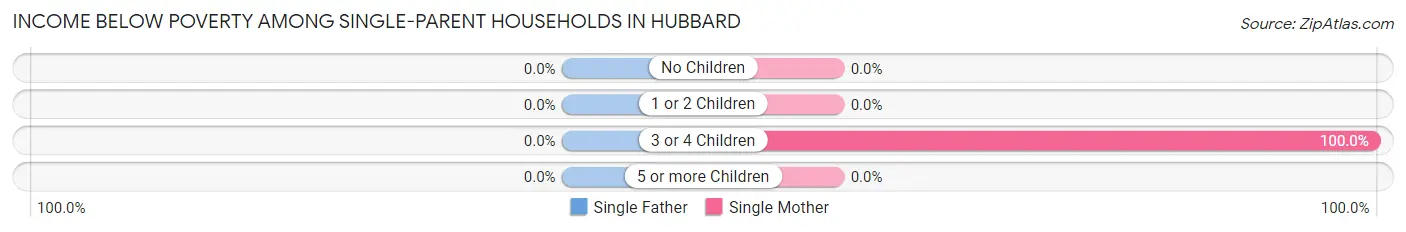
| Children | Single Father | Single Mother |
| No Children | 0 (0.0%) | 0 (0.0%) |
| 1 or 2 Children | 0 (0.0%) | 0 (0.0%) |
| 3 or 4 Children | 0 (0.0%) | 42 (100.0%) |
| 5 or more Children | 0 (0.0%) | 0 (0.0%) |
| Total | 0 (0.0%) | 42 (10.7%) |
Income Below Poverty Among Married-Couple vs Single-Parent Households in Hubbard
The poverty data for Hubbard shows that 75 of the married-couple family households (5.0%) and 42 of the single-parent households (7.2%) are living below the poverty level. Within the married-couple family households, those with 1 or 2 children have the highest poverty rate, with 49 households (10.5%) falling below the poverty line. Among the single-parent households, those with 3 or 4 children have the highest poverty rate, with 42 household (100.0%) living below poverty.
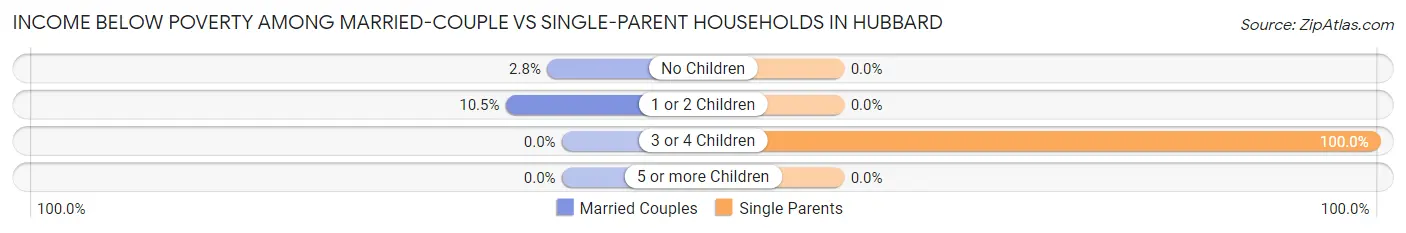
| Children | Married-Couple Families | Single-Parent Households |
| No Children | 26 (2.8%) | 0 (0.0%) |
| 1 or 2 Children | 49 (10.5%) | 0 (0.0%) |
| 3 or 4 Children | 0 (0.0%) | 42 (100.0%) |
| 5 or more Children | 0 (0.0%) | 0 (0.0%) |
| Total | 75 (5.0%) | 42 (7.2%) |
Race in Hubbard
The most populous races in Hubbard are White / Caucasian (7,386 | 97.0%), Hispanic or Latino (209 | 2.7%), and Two or more Races (107 | 1.4%).
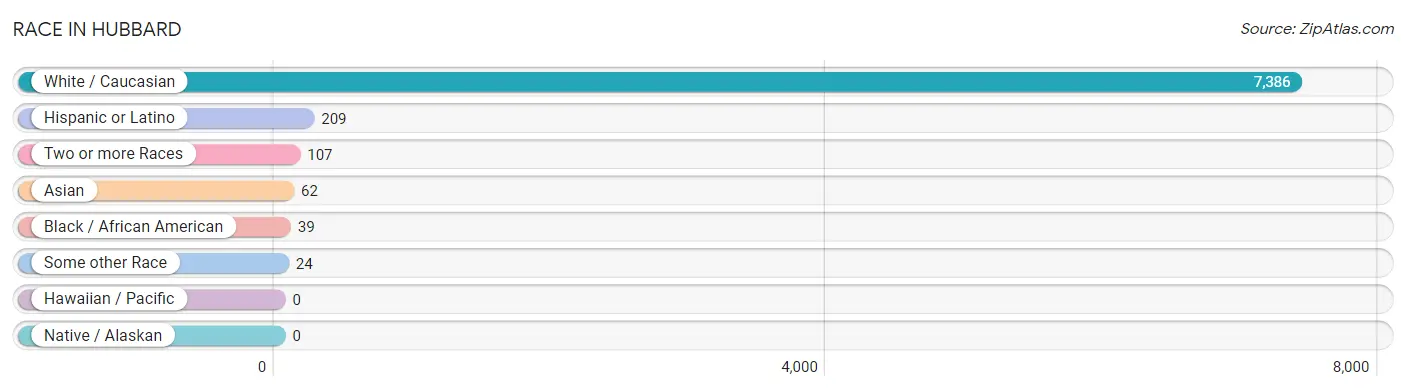
| Race | # Population | % Population |
| Asian | 62 | 0.8% |
| Black / African American | 39 | 0.5% |
| Hawaiian / Pacific | 0 | 0.0% |
| Hispanic or Latino | 209 | 2.7% |
| Native / Alaskan | 0 | 0.0% |
| White / Caucasian | 7,386 | 97.0% |
| Two or more Races | 107 | 1.4% |
| Some other Race | 24 | 0.3% |
| Total | 7,618 | 100.0% |
Ancestry in Hubbard
The most populous ancestries reported in Hubbard are German (1,965 | 25.8%), American (1,532 | 20.1%), Italian (1,417 | 18.6%), Irish (1,139 | 14.9%), and English (835 | 11.0%), together accounting for 90.4% of all Hubbard residents.
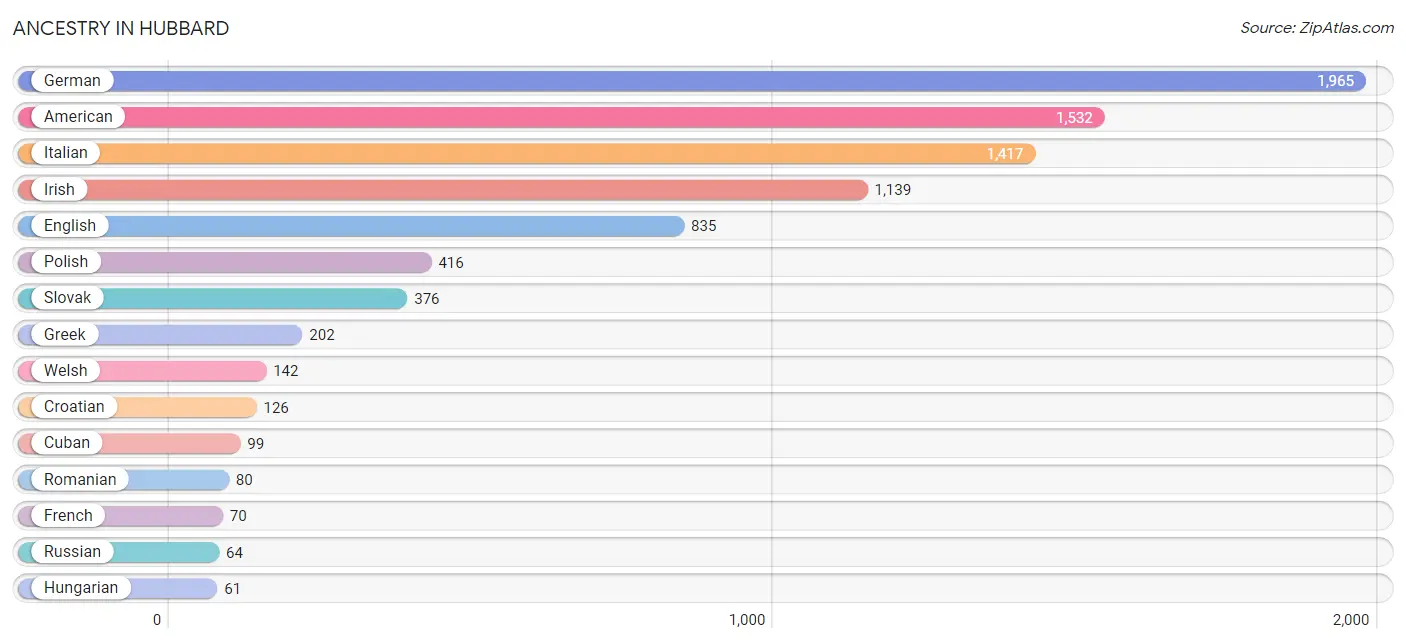
| Ancestry | # Population | % Population |
| American | 1,532 | 20.1% |
| Arab | 29 | 0.4% |
| British | 19 | 0.3% |
| Croatian | 126 | 1.7% |
| Cuban | 99 | 1.3% |
| Dutch | 26 | 0.3% |
| Eastern European | 28 | 0.4% |
| English | 835 | 11.0% |
| Finnish | 37 | 0.5% |
| French | 70 | 0.9% |
| German | 1,965 | 25.8% |
| Greek | 202 | 2.6% |
| Hungarian | 61 | 0.8% |
| Irish | 1,139 | 14.9% |
| Italian | 1,417 | 18.6% |
| Korean | 55 | 0.7% |
| Lebanese | 29 | 0.4% |
| Mexican | 39 | 0.5% |
| Norwegian | 7 | 0.1% |
| Pakistani | 22 | 0.3% |
| Polish | 416 | 5.5% |
| Portuguese | 8 | 0.1% |
| Puerto Rican | 56 | 0.7% |
| Romanian | 80 | 1.1% |
| Russian | 64 | 0.8% |
| Scandinavian | 11 | 0.1% |
| Scotch-Irish | 24 | 0.3% |
| Scottish | 49 | 0.6% |
| Serbian | 41 | 0.5% |
| Slovak | 376 | 4.9% |
| Slovene | 20 | 0.3% |
| Swiss | 11 | 0.1% |
| Ukrainian | 43 | 0.6% |
| Welsh | 142 | 1.9% | View All 34 Rows |
Immigrants in Hubbard
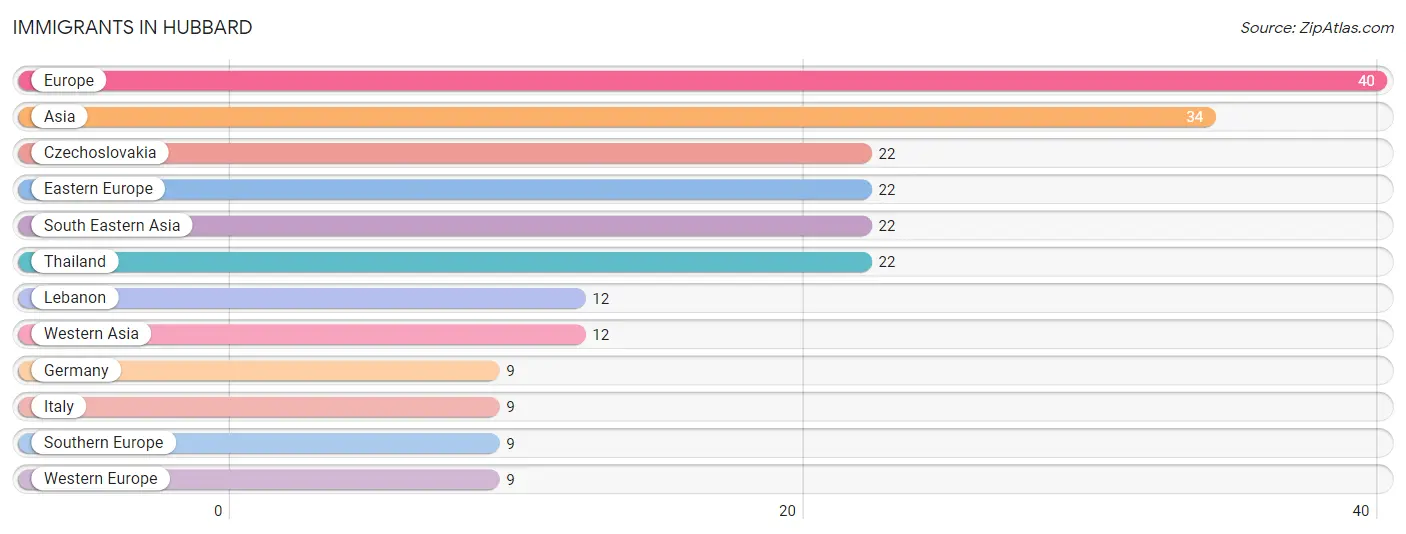
The most numerous immigrant groups reported in Hubbard came from Europe (40 | 0.5%), Asia (34 | 0.4%), Czechoslovakia (22 | 0.3%), Eastern Europe (22 | 0.3%), and South Eastern Asia (22 | 0.3%), together accounting for 1.8% of all Hubbard residents.
| Immigration Origin | # Population | % Population |
| Asia | 34 | 0.4% |
| Czechoslovakia | 22 | 0.3% |
| Eastern Europe | 22 | 0.3% |
| Europe | 40 | 0.5% |
| Germany | 9 | 0.1% |
| Italy | 9 | 0.1% |
| Lebanon | 12 | 0.2% |
| South Eastern Asia | 22 | 0.3% |
| Southern Europe | 9 | 0.1% |
| Thailand | 22 | 0.3% |
| Western Asia | 12 | 0.2% |
| Western Europe | 9 | 0.1% | View All 12 Rows |
Sex and Age in Hubbard
Sex and Age in Hubbard
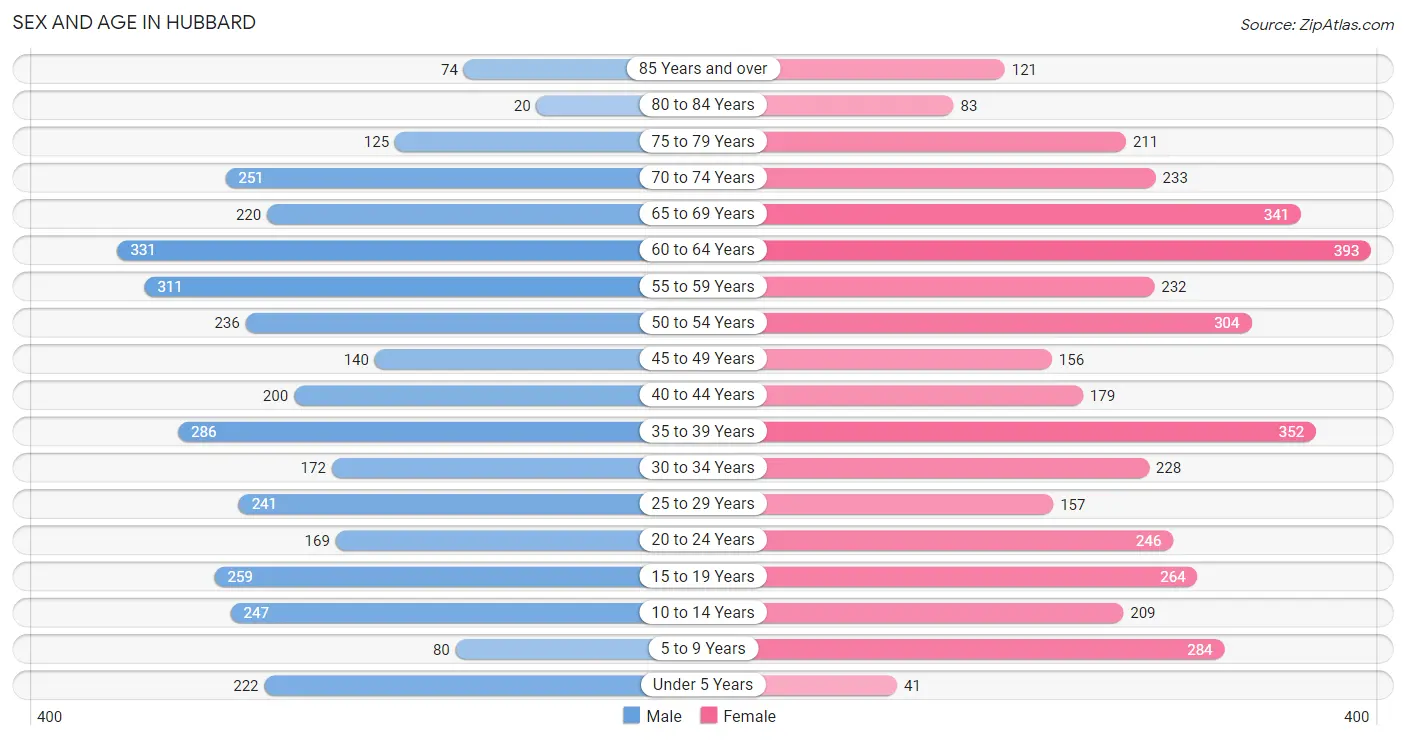
The most populous age groups in Hubbard are 60 to 64 Years (331 | 9.2%) for men and 60 to 64 Years (393 | 9.7%) for women.
| Age Bracket | Male | Female |
| Under 5 Years | 222 (6.2%) | 41 (1.0%) |
| 5 to 9 Years | 80 (2.2%) | 284 (7.0%) |
| 10 to 14 Years | 247 (6.9%) | 209 (5.2%) |
| 15 to 19 Years | 259 (7.2%) | 264 (6.5%) |
| 20 to 24 Years | 169 (4.7%) | 246 (6.1%) |
| 25 to 29 Years | 241 (6.7%) | 157 (3.9%) |
| 30 to 34 Years | 172 (4.8%) | 228 (5.7%) |
| 35 to 39 Years | 286 (8.0%) | 352 (8.7%) |
| 40 to 44 Years | 200 (5.6%) | 179 (4.4%) |
| 45 to 49 Years | 140 (3.9%) | 156 (3.9%) |
| 50 to 54 Years | 236 (6.6%) | 304 (7.5%) |
| 55 to 59 Years | 311 (8.7%) | 232 (5.8%) |
| 60 to 64 Years | 331 (9.2%) | 393 (9.7%) |
| 65 to 69 Years | 220 (6.1%) | 341 (8.5%) |
| 70 to 74 Years | 251 (7.0%) | 233 (5.8%) |
| 75 to 79 Years | 125 (3.5%) | 211 (5.2%) |
| 80 to 84 Years | 20 (0.6%) | 83 (2.1%) |
| 85 Years and over | 74 (2.1%) | 121 (3.0%) |
| Total | 3,584 (100.0%) | 4,034 (100.0%) |
Families and Households in Hubbard
Median Family Size in Hubbard
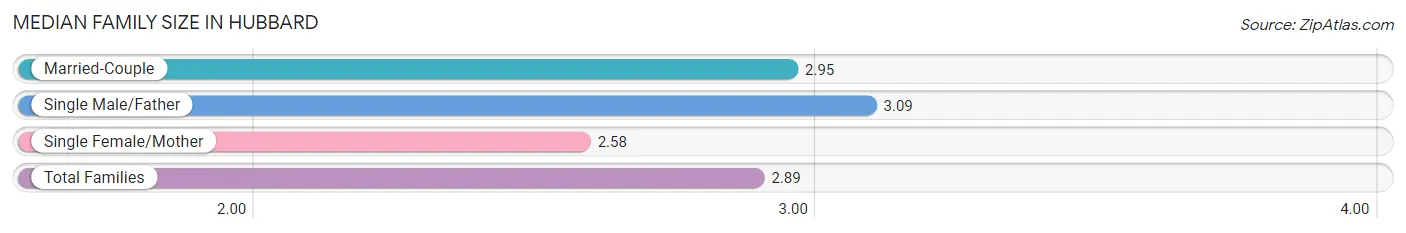
The median family size in Hubbard is 2.89 persons per family, with single male/father families (190 | 9.1%) accounting for the largest median family size of 3.09 persons per family. On the other hand, single female/mother families (393 | 18.9%) represent the smallest median family size with 2.58 persons per family.
| Family Type | # Families | Family Size |
| Married-Couple | 1,497 (72.0%) | 2.95 |
| Single Male/Father | 190 (9.1%) | 3.09 |
| Single Female/Mother | 393 (18.9%) | 2.58 |
| Total Families | 2,080 (100.0%) | 2.89 |
Median Household Size in Hubbard
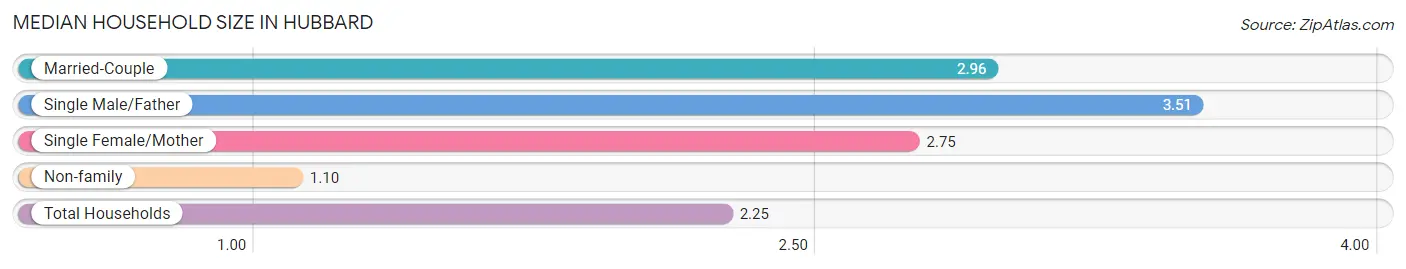
The median household size in Hubbard is 2.25 persons per household, with single male/father households (190 | 5.6%) accounting for the largest median household size of 3.51 persons per household. non-family households (1,300 | 38.5%) represent the smallest median household size with 1.10 persons per household.
| Household Type | # Households | Household Size |
| Married-Couple | 1,497 (44.3%) | 2.96 |
| Single Male/Father | 190 (5.6%) | 3.51 |
| Single Female/Mother | 393 (11.6%) | 2.75 |
| Non-family | 1,300 (38.5%) | 1.10 |
| Total Households | 3,380 (100.0%) | 2.25 |
Household Size by Marriage Status in Hubbard
Out of a total of 3,380 households in Hubbard, 2,080 (61.5%) are family households, while 1,300 (38.5%) are nonfamily households. The most numerous type of family households are 2-person households, comprising 982, and the most common type of nonfamily households are 1-person households, comprising 1,178.
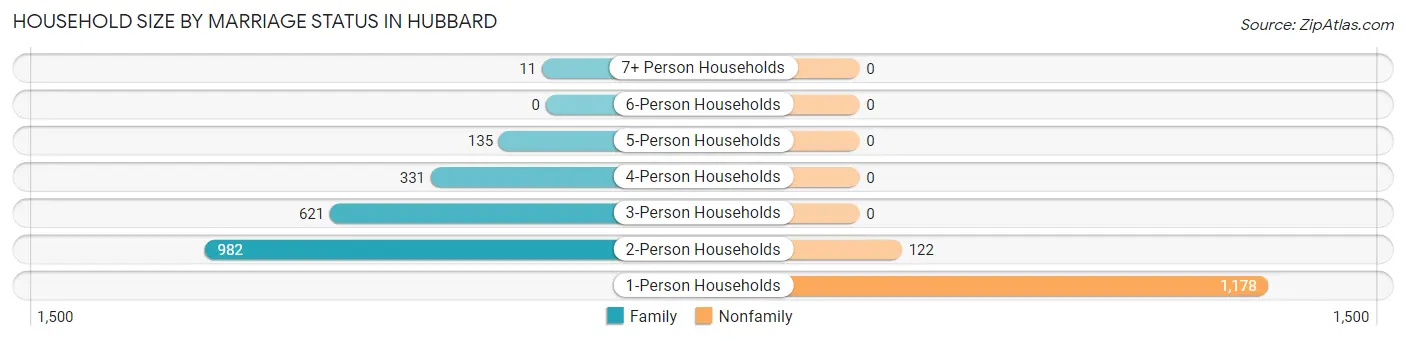
| Household Size | Family Households | Nonfamily Households |
| 1-Person Households | - | 1,178 (34.8%) |
| 2-Person Households | 982 (29.0%) | 122 (3.6%) |
| 3-Person Households | 621 (18.4%) | 0 (0.0%) |
| 4-Person Households | 331 (9.8%) | 0 (0.0%) |
| 5-Person Households | 135 (4.0%) | 0 (0.0%) |
| 6-Person Households | 0 (0.0%) | 0 (0.0%) |
| 7+ Person Households | 11 (0.3%) | 0 (0.0%) |
| Total | 2,080 (61.5%) | 1,300 (38.5%) |
Female Fertility in Hubbard
Fertility by Age in Hubbard
Average fertility rate in Hubbard is 21.0 births per 1,000 women. Women in the age bracket of 20 to 34 years have the highest fertility rate with 57.0 births per 1,000 women. Women in the age bracket of 20 to 34 years acount for 100.0% of all women with births.
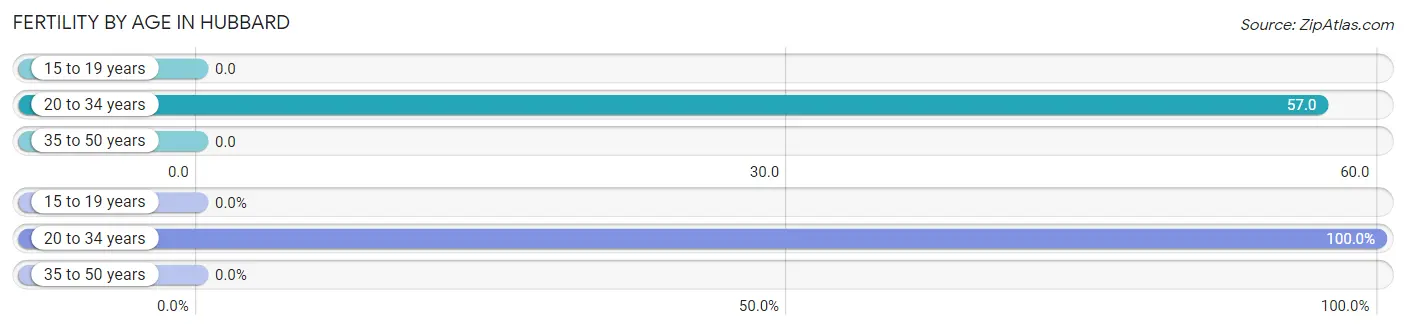
| Age Bracket | Women with Births | Births / 1,000 Women |
| 15 to 19 years | 0 (0.0%) | 0.0 |
| 20 to 34 years | 36 (100.0%) | 57.0 |
| 35 to 50 years | 0 (0.0%) | 0.0 |
| Total | 36 (100.0%) | 21.0 |
Fertility by Age by Marriage Status in Hubbard
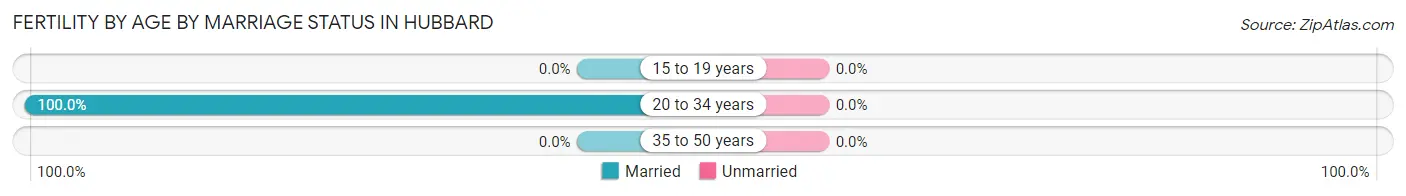
| Age Bracket | Married | Unmarried |
| 15 to 19 years | 0 (0.0%) | 0 (0.0%) |
| 20 to 34 years | 36 (100.0%) | 0 (0.0%) |
| 35 to 50 years | 0 (0.0%) | 0 (0.0%) |
| Total | 36 (100.0%) | 0 (0.0%) |
Fertility by Education in Hubbard
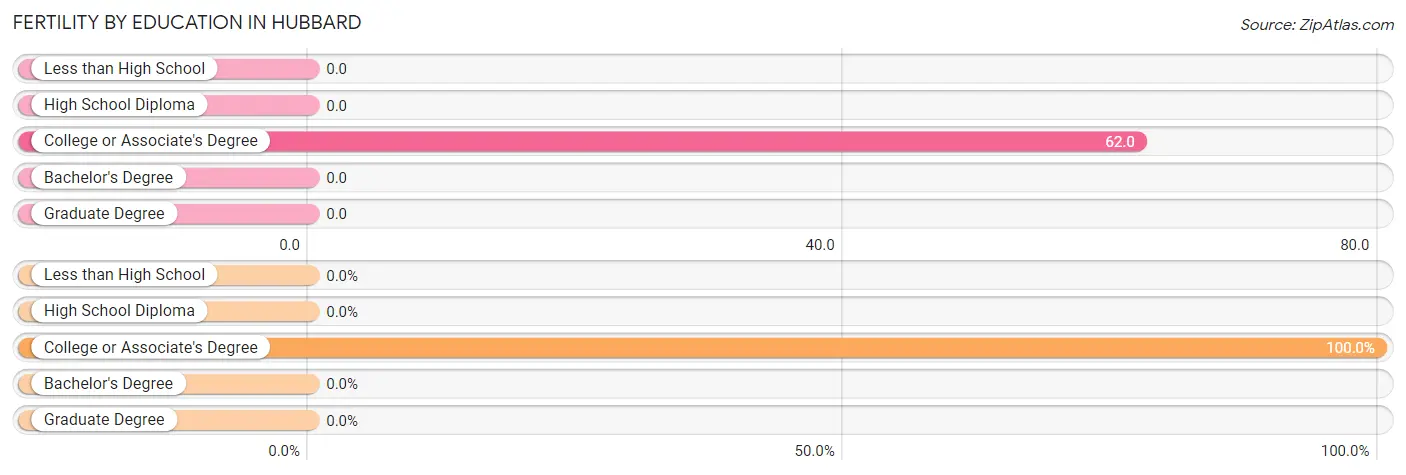
| Educational Attainment | Women with Births | Births / 1,000 Women |
| Less than High School | 0 (0.0%) | 0.0 |
| High School Diploma | 0 (0.0%) | 0.0 |
| College or Associate's Degree | 36 (100.0%) | 62.0 |
| Bachelor's Degree | 0 (0.0%) | 0.0 |
| Graduate Degree | 0 (0.0%) | 0.0 |
| Total | 36 (100.0%) | 21.0 |
Fertility by Education by Marriage Status in Hubbard
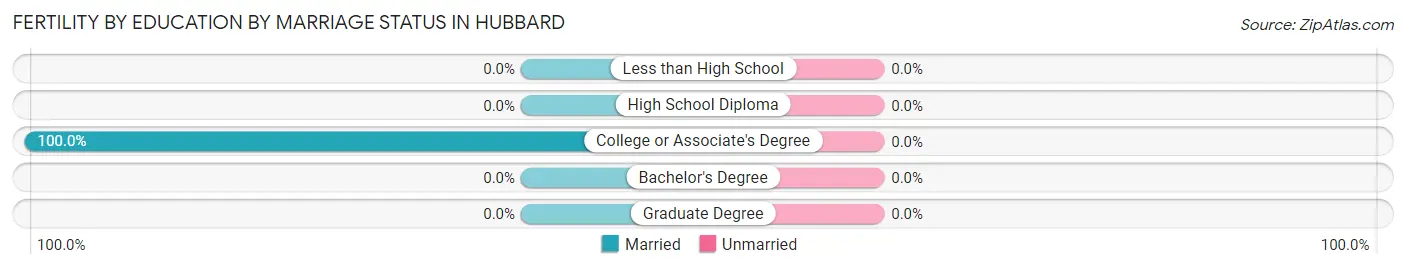
| Educational Attainment | Married | Unmarried |
| Less than High School | 0 (0.0%) | 0 (0.0%) |
| High School Diploma | 0 (0.0%) | 0 (0.0%) |
| College or Associate's Degree | 36 (100.0%) | 0 (0.0%) |
| Bachelor's Degree | 0 (0.0%) | 0 (0.0%) |
| Graduate Degree | 0 (0.0%) | 0 (0.0%) |
| Total | 36 (100.0%) | 0 (0.0%) |
Employment Characteristics in Hubbard
Employment by Class of Employer in Hubbard
Among the 3,970 employed individuals in Hubbard, private company employees (3,009 | 75.8%), not-for-profit organizations (264 | 6.7%), and local government employees (245 | 6.2%) make up the most common classes of employment.
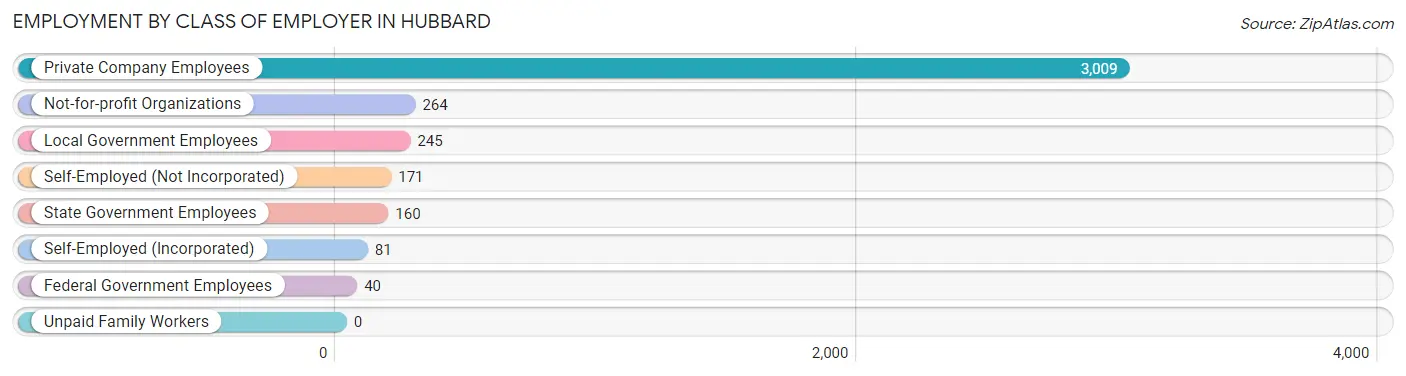
| Employer Class | # Employees | % Employees |
| Private Company Employees | 3,009 | 75.8% |
| Self-Employed (Incorporated) | 81 | 2.0% |
| Self-Employed (Not Incorporated) | 171 | 4.3% |
| Not-for-profit Organizations | 264 | 6.7% |
| Local Government Employees | 245 | 6.2% |
| State Government Employees | 160 | 4.0% |
| Federal Government Employees | 40 | 1.0% |
| Unpaid Family Workers | 0 | 0.0% |
| Total | 3,970 | 100.0% |
Employment Status by Age in Hubbard
According to the labor force statistics for Hubbard, out of the total population over 16 years of age (6,434), 64.4% or 4,143 individuals are in the labor force, with 2.6% or 108 of them unemployed. The age group with the highest labor force participation rate is 35 to 44 years, with 92.4% or 940 individuals in the labor force. Within the labor force, the 16 to 19 years age range has the highest percentage of unemployed individuals, with 32.6% or 74 of them being unemployed.
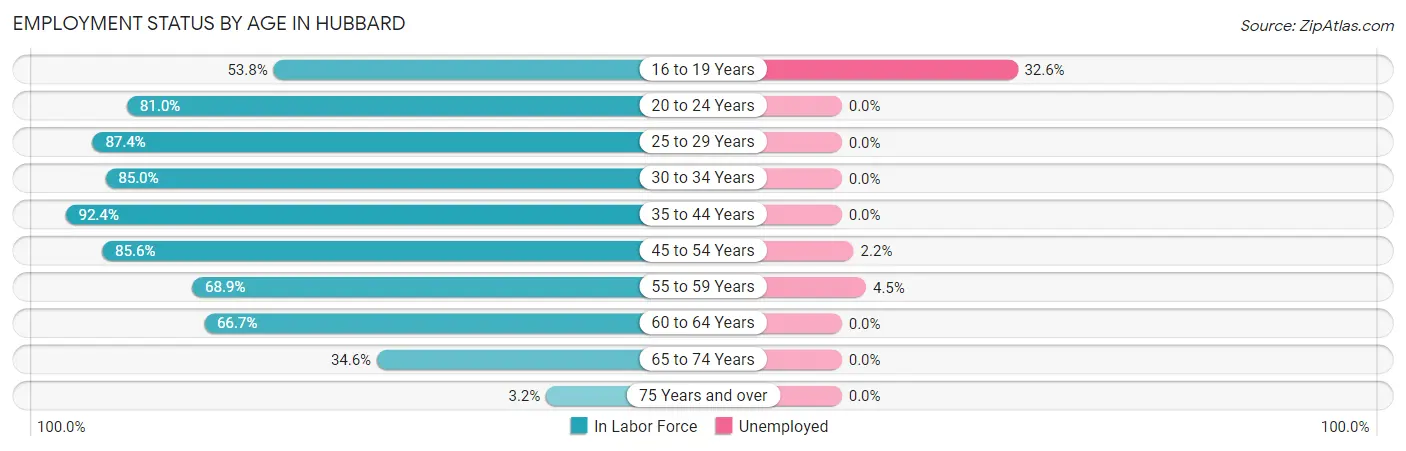
| Age Bracket | In Labor Force | Unemployed |
| 16 to 19 Years | 227 (53.8%) | 74 (32.6%) |
| 20 to 24 Years | 336 (81.0%) | 0 (0.0%) |
| 25 to 29 Years | 348 (87.4%) | 0 (0.0%) |
| 30 to 34 Years | 340 (85.0%) | 0 (0.0%) |
| 35 to 44 Years | 940 (92.4%) | 0 (0.0%) |
| 45 to 54 Years | 716 (85.6%) | 16 (2.2%) |
| 55 to 59 Years | 374 (68.9%) | 17 (4.5%) |
| 60 to 64 Years | 483 (66.7%) | 0 (0.0%) |
| 65 to 74 Years | 362 (34.6%) | 0 (0.0%) |
| 75 Years and over | 20 (3.2%) | 0 (0.0%) |
| Total | 4,143 (64.4%) | 108 (2.6%) |
Employment Status by Educational Attainment in Hubbard
According to labor force statistics for Hubbard, 81.7% of individuals (3,201) out of the total population between 25 and 64 years of age (3,918) are in the labor force, with 1.0% or 32 of them being unemployed. The group with the highest labor force participation rate are those with the educational attainment of bachelor's degree or higher, with 91.7% or 1,118 individuals in the labor force. Within the labor force, individuals with less than high school education have the highest percentage of unemployment, with 18.6% or 16 of them being unemployed.
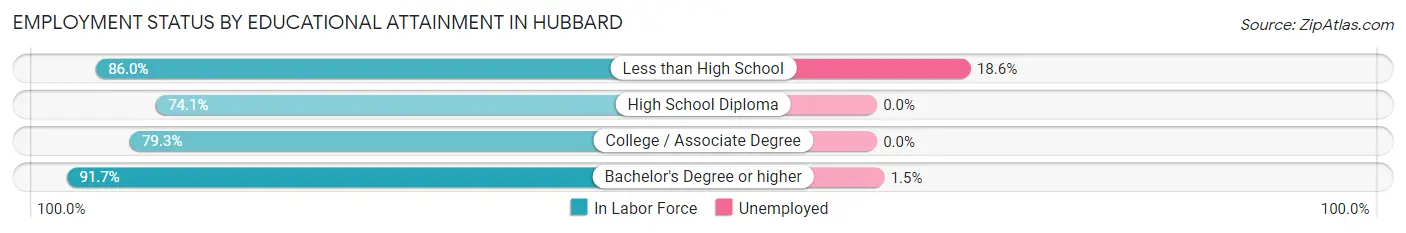
| Educational Attainment | In Labor Force | Unemployed |
| Less than High School | 86 (86.0%) | 19 (18.6%) |
| High School Diploma | 920 (74.1%) | 0 (0.0%) |
| College / Associate Degree | 1,077 (79.3%) | 0 (0.0%) |
| Bachelor's Degree or higher | 1,118 (91.7%) | 18 (1.5%) |
| Total | 3,201 (81.7%) | 39 (1.0%) |
Employment Occupations by Sex in Hubbard
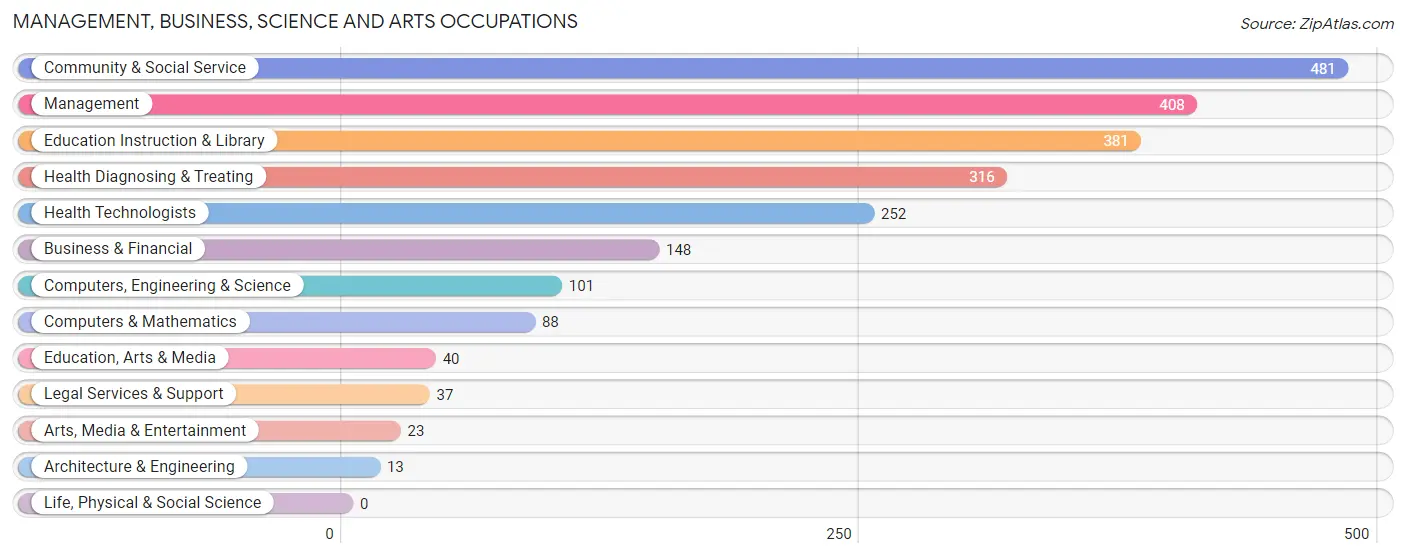
Management, Business, Science and Arts Occupations
The most common Management, Business, Science and Arts occupations in Hubbard are Community & Social Service (481 | 11.9%), Management (408 | 10.1%), Education Instruction & Library (381 | 9.4%), Health Diagnosing & Treating (316 | 7.8%), and Health Technologists (252 | 6.2%).
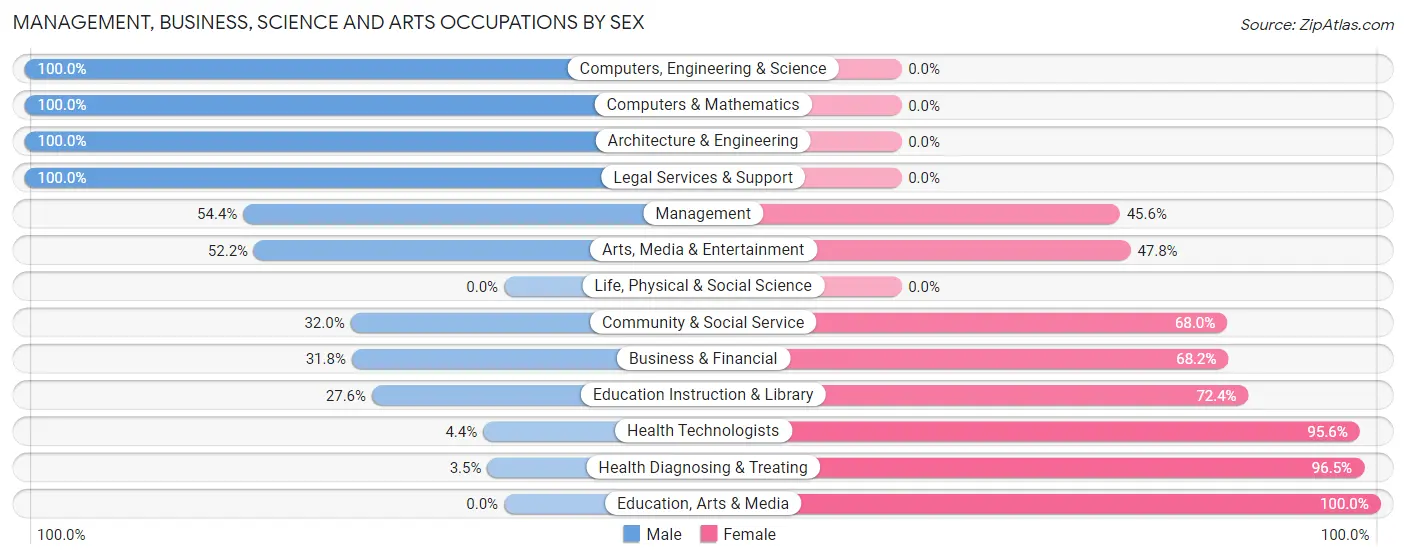
Management, Business, Science and Arts Occupations by Sex
Within the Management, Business, Science and Arts occupations in Hubbard, the most male-oriented occupations are Computers, Engineering & Science (100.0%), Computers & Mathematics (100.0%), and Architecture & Engineering (100.0%), while the most female-oriented occupations are Education, Arts & Media (100.0%), Health Diagnosing & Treating (96.5%), and Health Technologists (95.6%).
| Occupation | Male | Female |
| Management | 222 (54.4%) | 186 (45.6%) |
| Business & Financial | 47 (31.8%) | 101 (68.2%) |
| Computers, Engineering & Science | 101 (100.0%) | 0 (0.0%) |
| Computers & Mathematics | 88 (100.0%) | 0 (0.0%) |
| Architecture & Engineering | 13 (100.0%) | 0 (0.0%) |
| Life, Physical & Social Science | 0 (0.0%) | 0 (0.0%) |
| Community & Social Service | 154 (32.0%) | 327 (68.0%) |
| Education, Arts & Media | 0 (0.0%) | 40 (100.0%) |
| Legal Services & Support | 37 (100.0%) | 0 (0.0%) |
| Education Instruction & Library | 105 (27.6%) | 276 (72.4%) |
| Arts, Media & Entertainment | 12 (52.2%) | 11 (47.8%) |
| Health Diagnosing & Treating | 11 (3.5%) | 305 (96.5%) |
| Health Technologists | 11 (4.4%) | 241 (95.6%) |
| Total (Category) | 535 (36.8%) | 919 (63.2%) |
| Total (Overall) | 1,922 (47.6%) | 2,117 (52.4%) |
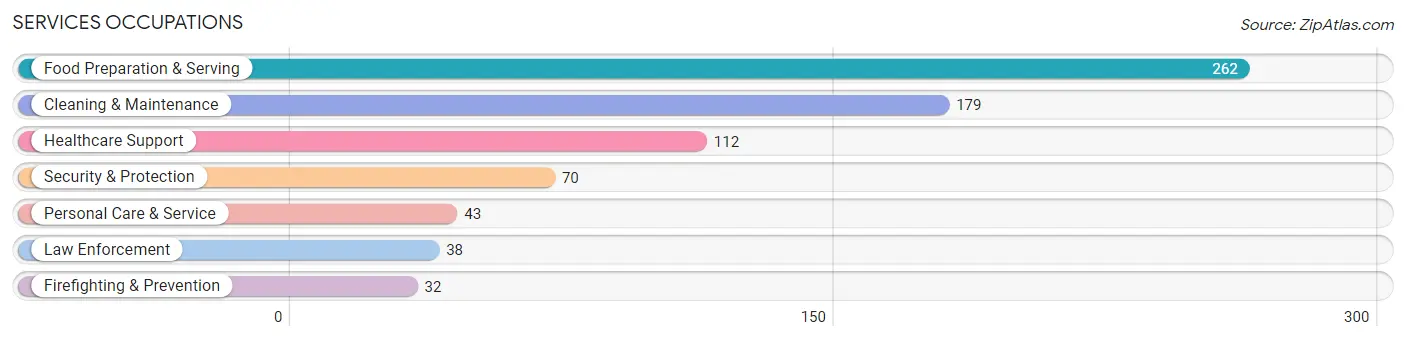
Services Occupations
The most common Services occupations in Hubbard are Food Preparation & Serving (262 | 6.5%), Cleaning & Maintenance (179 | 4.4%), Healthcare Support (112 | 2.8%), Security & Protection (70 | 1.7%), and Personal Care & Service (43 | 1.1%).
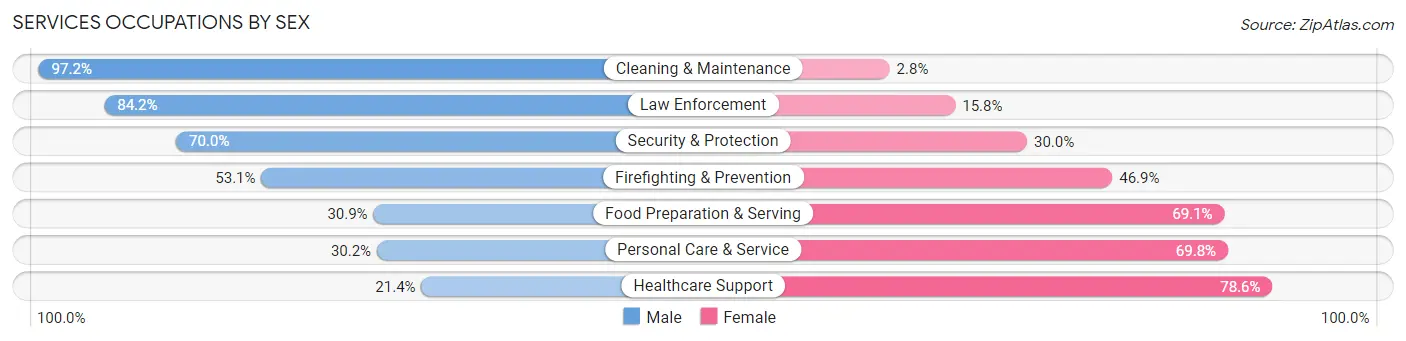
Services Occupations by Sex
Within the Services occupations in Hubbard, the most male-oriented occupations are Cleaning & Maintenance (97.2%), Law Enforcement (84.2%), and Security & Protection (70.0%), while the most female-oriented occupations are Healthcare Support (78.6%), Personal Care & Service (69.8%), and Food Preparation & Serving (69.1%).
| Occupation | Male | Female |
| Healthcare Support | 24 (21.4%) | 88 (78.6%) |
| Security & Protection | 49 (70.0%) | 21 (30.0%) |
| Firefighting & Prevention | 17 (53.1%) | 15 (46.9%) |
| Law Enforcement | 32 (84.2%) | 6 (15.8%) |
| Food Preparation & Serving | 81 (30.9%) | 181 (69.1%) |
| Cleaning & Maintenance | 174 (97.2%) | 5 (2.8%) |
| Personal Care & Service | 13 (30.2%) | 30 (69.8%) |
| Total (Category) | 341 (51.2%) | 325 (48.8%) |
| Total (Overall) | 1,922 (47.6%) | 2,117 (52.4%) |
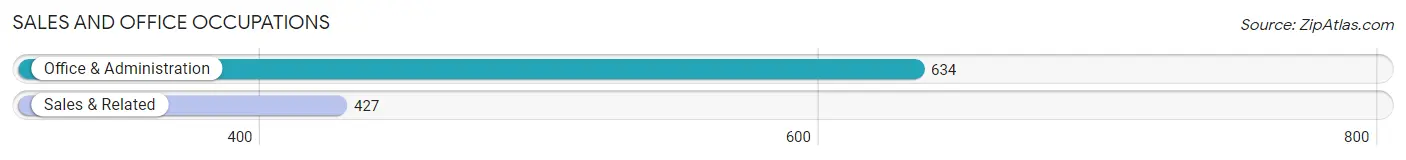
Sales and Office Occupations
The most common Sales and Office occupations in Hubbard are Office & Administration (634 | 15.7%), and Sales & Related (427 | 10.6%).
Sales and Office Occupations by Sex
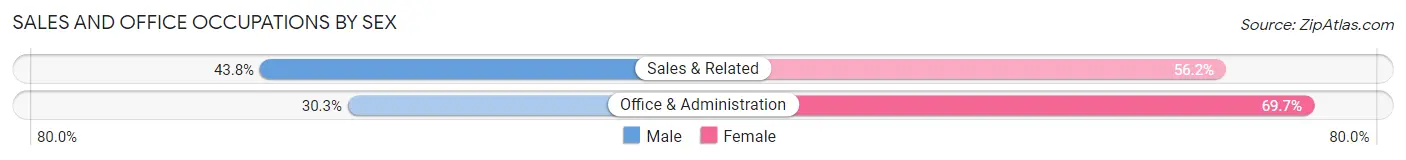
| Occupation | Male | Female |
| Sales & Related | 187 (43.8%) | 240 (56.2%) |
| Office & Administration | 192 (30.3%) | 442 (69.7%) |
| Total (Category) | 379 (35.7%) | 682 (64.3%) |
| Total (Overall) | 1,922 (47.6%) | 2,117 (52.4%) |
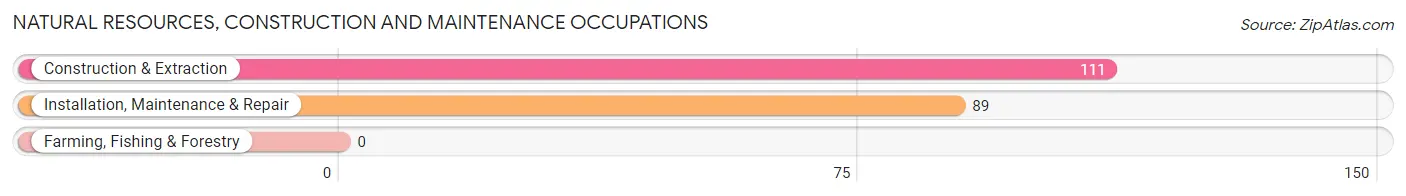
Natural Resources, Construction and Maintenance Occupations
The most common Natural Resources, Construction and Maintenance occupations in Hubbard are Construction & Extraction (111 | 2.8%), and Installation, Maintenance & Repair (89 | 2.2%).
Natural Resources, Construction and Maintenance Occupations by Sex
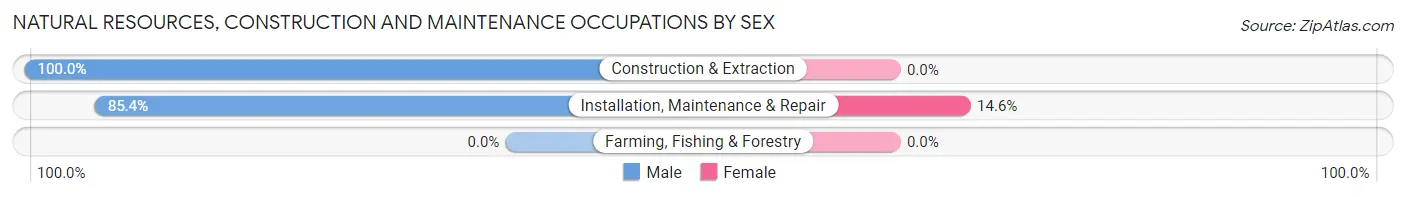
| Occupation | Male | Female |
| Farming, Fishing & Forestry | 0 (0.0%) | 0 (0.0%) |
| Construction & Extraction | 111 (100.0%) | 0 (0.0%) |
| Installation, Maintenance & Repair | 76 (85.4%) | 13 (14.6%) |
| Total (Category) | 187 (93.5%) | 13 (6.5%) |
| Total (Overall) | 1,922 (47.6%) | 2,117 (52.4%) |
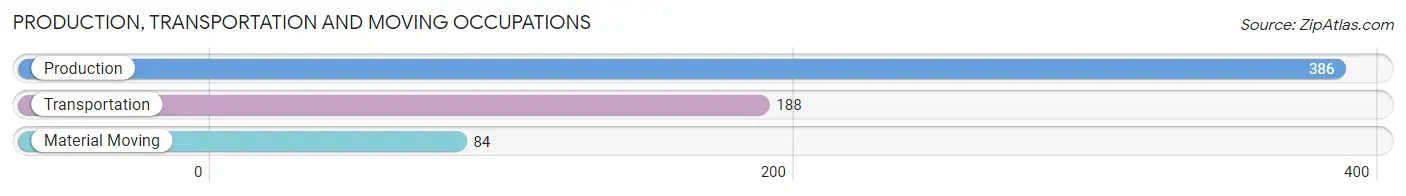
Production, Transportation and Moving Occupations
The most common Production, Transportation and Moving occupations in Hubbard are Production (386 | 9.6%), Transportation (188 | 4.6%), and Material Moving (84 | 2.1%).
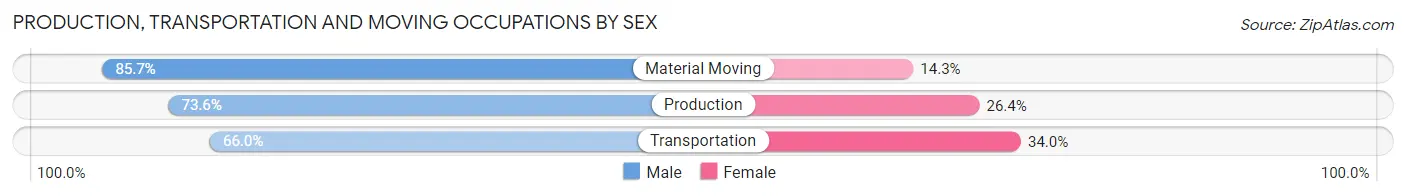
Production, Transportation and Moving Occupations by Sex
| Occupation | Male | Female |
| Production | 284 (73.6%) | 102 (26.4%) |
| Transportation | 124 (66.0%) | 64 (34.0%) |
| Material Moving | 72 (85.7%) | 12 (14.3%) |
| Total (Category) | 480 (73.0%) | 178 (27.1%) |
| Total (Overall) | 1,922 (47.6%) | 2,117 (52.4%) |
Employment Industries by Sex in Hubbard
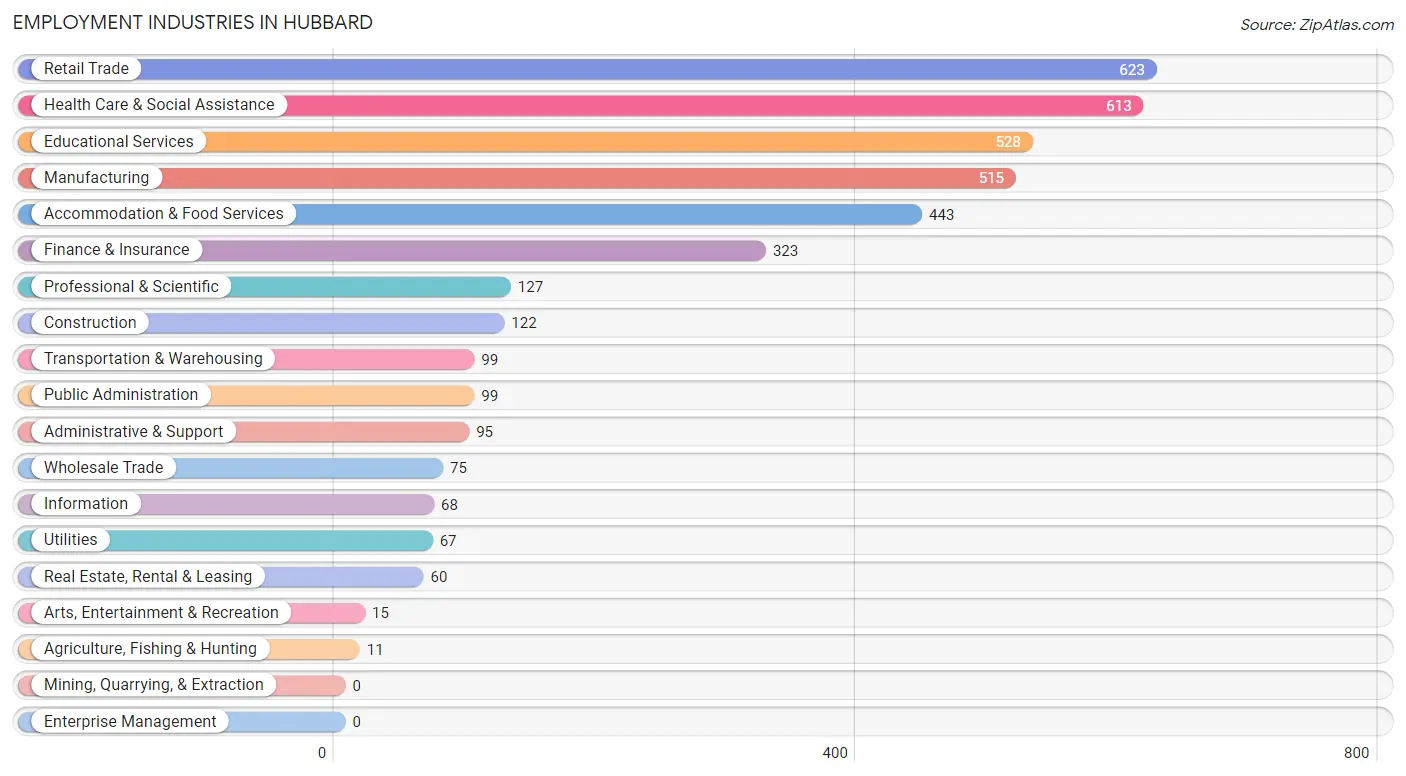
Employment Industries in Hubbard
The major employment industries in Hubbard include Retail Trade (623 | 15.4%), Health Care & Social Assistance (613 | 15.2%), Educational Services (528 | 13.1%), Manufacturing (515 | 12.8%), and Accommodation & Food Services (443 | 11.0%).
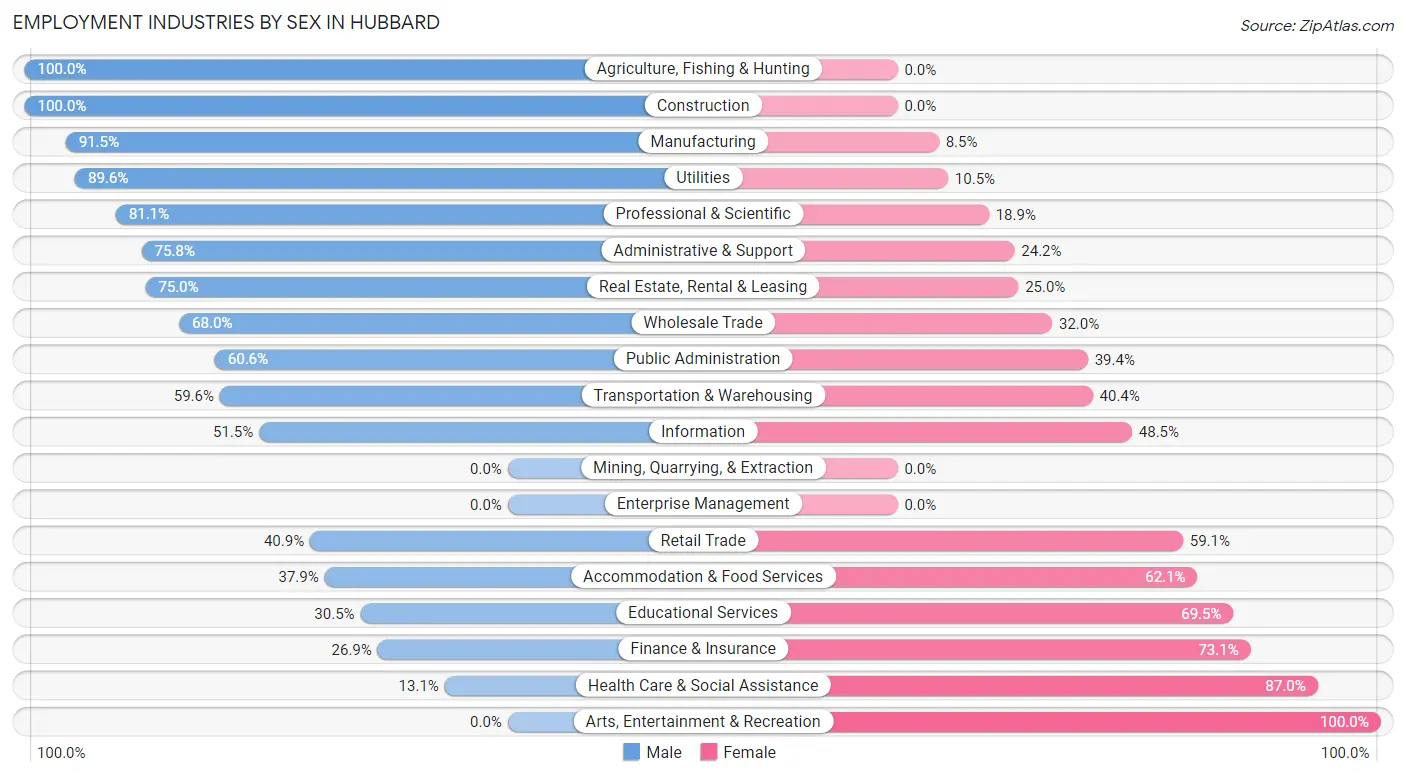
Employment Industries by Sex in Hubbard
The Hubbard industries that see more men than women are Agriculture, Fishing & Hunting (100.0%), Construction (100.0%), and Manufacturing (91.5%), whereas the industries that tend to have a higher number of women are Arts, Entertainment & Recreation (100.0%), Health Care & Social Assistance (87.0%), and Finance & Insurance (73.1%).
| Industry | Male | Female |
| Agriculture, Fishing & Hunting | 11 (100.0%) | 0 (0.0%) |
| Mining, Quarrying, & Extraction | 0 (0.0%) | 0 (0.0%) |
| Construction | 122 (100.0%) | 0 (0.0%) |
| Manufacturing | 471 (91.5%) | 44 (8.5%) |
| Wholesale Trade | 51 (68.0%) | 24 (32.0%) |
| Retail Trade | 255 (40.9%) | 368 (59.1%) |
| Transportation & Warehousing | 59 (59.6%) | 40 (40.4%) |
| Utilities | 60 (89.5%) | 7 (10.4%) |
| Information | 35 (51.5%) | 33 (48.5%) |
| Finance & Insurance | 87 (26.9%) | 236 (73.1%) |
| Real Estate, Rental & Leasing | 45 (75.0%) | 15 (25.0%) |
| Professional & Scientific | 103 (81.1%) | 24 (18.9%) |
| Enterprise Management | 0 (0.0%) | 0 (0.0%) |
| Administrative & Support | 72 (75.8%) | 23 (24.2%) |
| Educational Services | 161 (30.5%) | 367 (69.5%) |
| Health Care & Social Assistance | 80 (13.1%) | 533 (87.0%) |
| Arts, Entertainment & Recreation | 0 (0.0%) | 15 (100.0%) |
| Accommodation & Food Services | 168 (37.9%) | 275 (62.1%) |
| Public Administration | 60 (60.6%) | 39 (39.4%) |
| Total | 1,922 (47.6%) | 2,117 (52.4%) |
Education in Hubbard
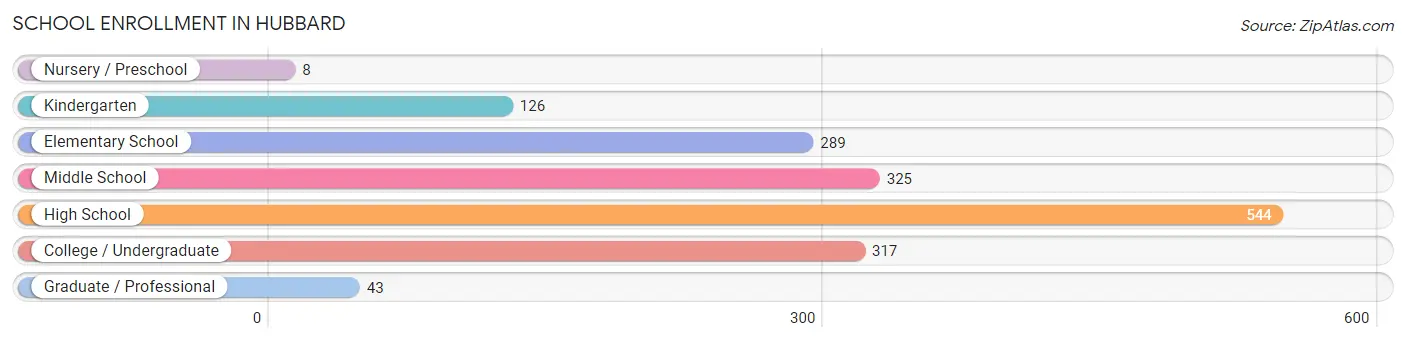
School Enrollment in Hubbard
The most common levels of schooling among the 1,652 students in Hubbard are high school (544 | 32.9%), middle school (325 | 19.7%), and college / undergraduate (317 | 19.2%).
| School Level | # Students | % Students |
| Nursery / Preschool | 8 | 0.5% |
| Kindergarten | 126 | 7.6% |
| Elementary School | 289 | 17.5% |
| Middle School | 325 | 19.7% |
| High School | 544 | 32.9% |
| College / Undergraduate | 317 | 19.2% |
| Graduate / Professional | 43 | 2.6% |
| Total | 1,652 | 100.0% |
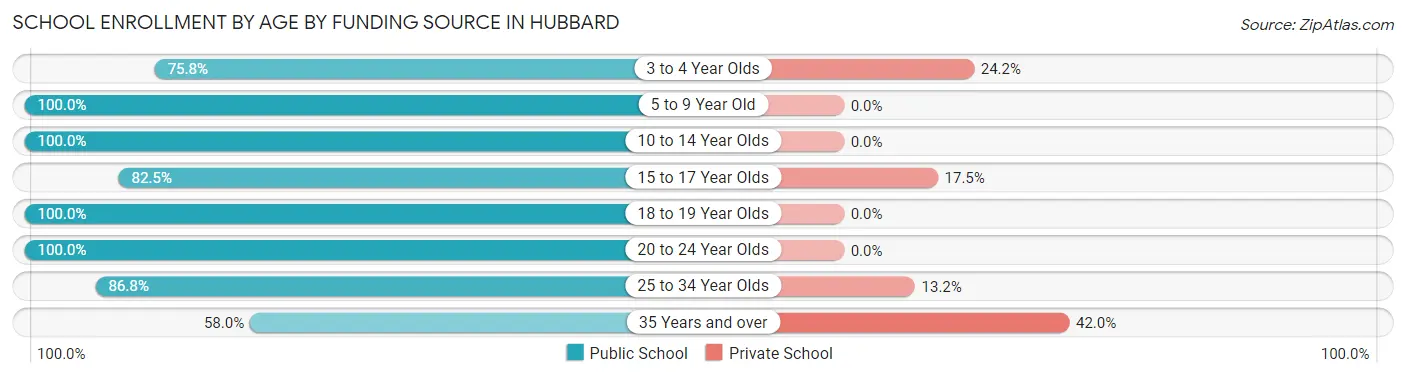
School Enrollment by Age by Funding Source in Hubbard
Out of a total of 1,652 students who are enrolled in schools in Hubbard, 119 (7.2%) attend a private institution, while the remaining 1,533 (92.8%) are enrolled in public schools. The age group of 35 years and over has the highest likelihood of being enrolled in private schools, with 34 (42.0% in the age bracket) enrolled. Conversely, the age group of 5 to 9 year old has the lowest likelihood of being enrolled in a private school, with 311 (100.0% in the age bracket) attending a public institution.
| Age Bracket | Public School | Private School |
| 3 to 4 Year Olds | 25 (75.8%) | 8 (24.2%) |
| 5 to 9 Year Old | 311 (100.0%) | 0 (0.0%) |
| 10 to 14 Year Olds | 456 (100.0%) | 0 (0.0%) |
| 15 to 17 Year Olds | 297 (82.5%) | 63 (17.5%) |
| 18 to 19 Year Olds | 139 (100.0%) | 0 (0.0%) |
| 20 to 24 Year Olds | 166 (100.0%) | 0 (0.0%) |
| 25 to 34 Year Olds | 92 (86.8%) | 14 (13.2%) |
| 35 Years and over | 47 (58.0%) | 34 (42.0%) |
| Total | 1,533 (92.8%) | 119 (7.2%) |
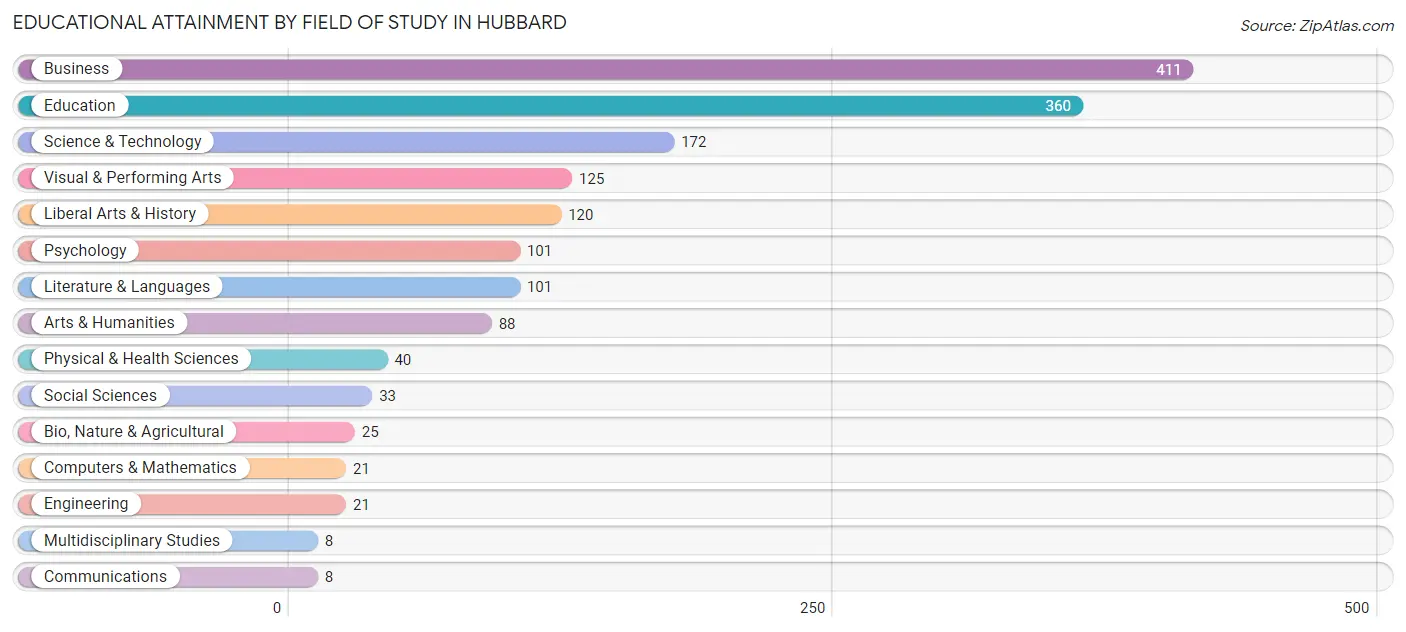
Educational Attainment by Field of Study in Hubbard
Business (411 | 25.2%), education (360 | 22.0%), science & technology (172 | 10.5%), visual & performing arts (125 | 7.6%), and liberal arts & history (120 | 7.3%) are the most common fields of study among 1,634 individuals in Hubbard who have obtained a bachelor's degree or higher.
| Field of Study | # Graduates | % Graduates |
| Computers & Mathematics | 21 | 1.3% |
| Bio, Nature & Agricultural | 25 | 1.5% |
| Physical & Health Sciences | 40 | 2.5% |
| Psychology | 101 | 6.2% |
| Social Sciences | 33 | 2.0% |
| Engineering | 21 | 1.3% |
| Multidisciplinary Studies | 8 | 0.5% |
| Science & Technology | 172 | 10.5% |
| Business | 411 | 25.2% |
| Education | 360 | 22.0% |
| Literature & Languages | 101 | 6.2% |
| Liberal Arts & History | 120 | 7.3% |
| Visual & Performing Arts | 125 | 7.6% |
| Communications | 8 | 0.5% |
| Arts & Humanities | 88 | 5.4% |
| Total | 1,634 | 100.0% |
Transportation & Commute in Hubbard
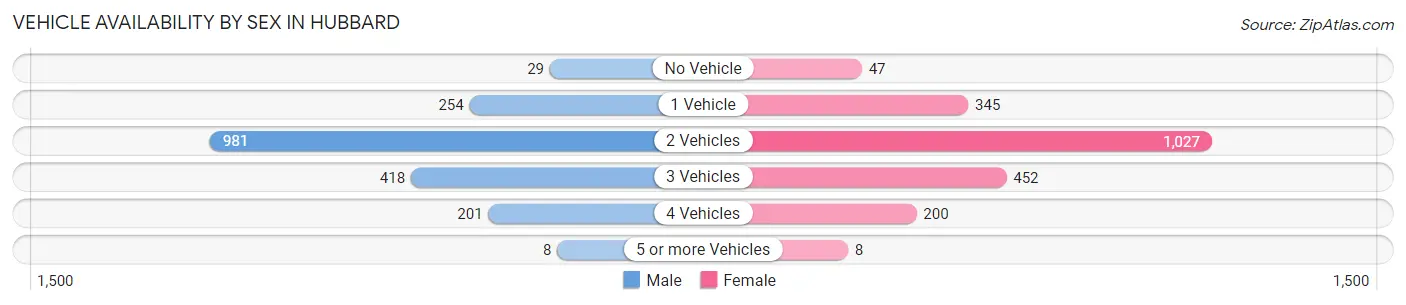
Vehicle Availability by Sex in Hubbard
The most prevalent vehicle ownership categories in Hubbard are males with 2 vehicles (981, accounting for 51.9%) and females with 2 vehicles (1,027, making up 47.2%).
| Vehicles Available | Male | Female |
| No Vehicle | 29 (1.5%) | 47 (2.3%) |
| 1 Vehicle | 254 (13.4%) | 345 (16.6%) |
| 2 Vehicles | 981 (51.9%) | 1,027 (49.4%) |
| 3 Vehicles | 418 (22.1%) | 452 (21.7%) |
| 4 Vehicles | 201 (10.6%) | 200 (9.6%) |
| 5 or more Vehicles | 8 (0.4%) | 8 (0.4%) |
| Total | 1,891 (100.0%) | 2,079 (100.0%) |
Commute Time in Hubbard
The most frequently occuring commute durations in Hubbard are 5 to 9 minutes (636 commuters, 17.3%), 30 to 34 minutes (615 commuters, 16.8%), and 20 to 24 minutes (594 commuters, 16.2%).
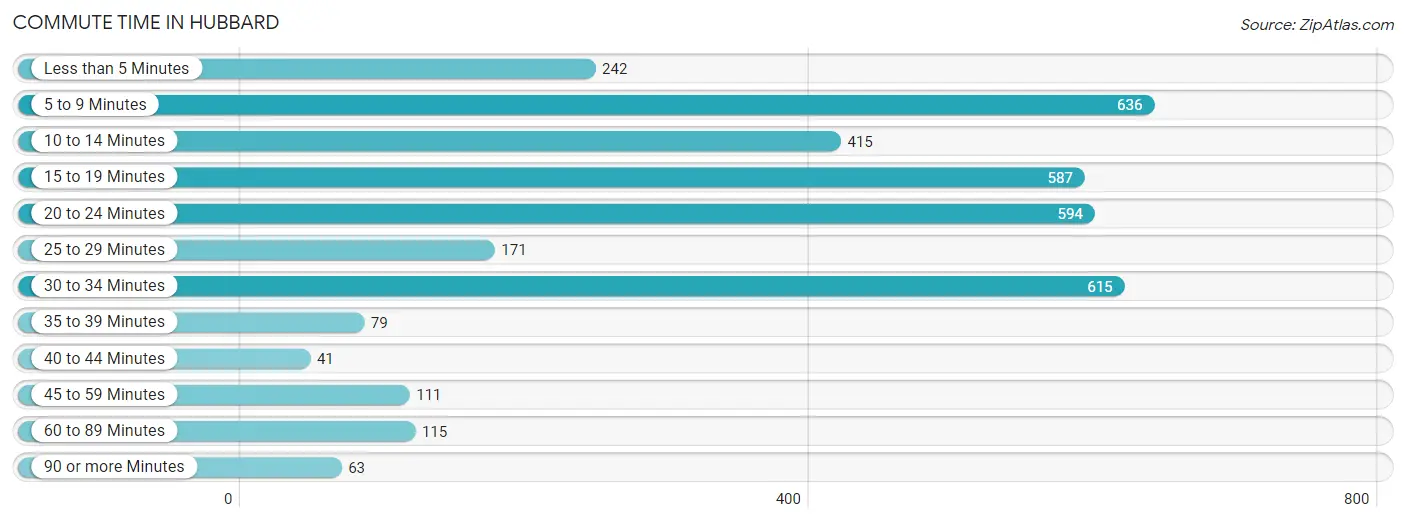
| Commute Time | # Commuters | % Commuters |
| Less than 5 Minutes | 242 | 6.6% |
| 5 to 9 Minutes | 636 | 17.3% |
| 10 to 14 Minutes | 415 | 11.3% |
| 15 to 19 Minutes | 587 | 16.0% |
| 20 to 24 Minutes | 594 | 16.2% |
| 25 to 29 Minutes | 171 | 4.7% |
| 30 to 34 Minutes | 615 | 16.8% |
| 35 to 39 Minutes | 79 | 2.1% |
| 40 to 44 Minutes | 41 | 1.1% |
| 45 to 59 Minutes | 111 | 3.0% |
| 60 to 89 Minutes | 115 | 3.1% |
| 90 or more Minutes | 63 | 1.7% |
Commute Time by Sex in Hubbard
The most common commute times in Hubbard are 15 to 19 minutes (371 commuters, 20.7%) for males and 5 to 9 minutes (433 commuters, 23.0%) for females.
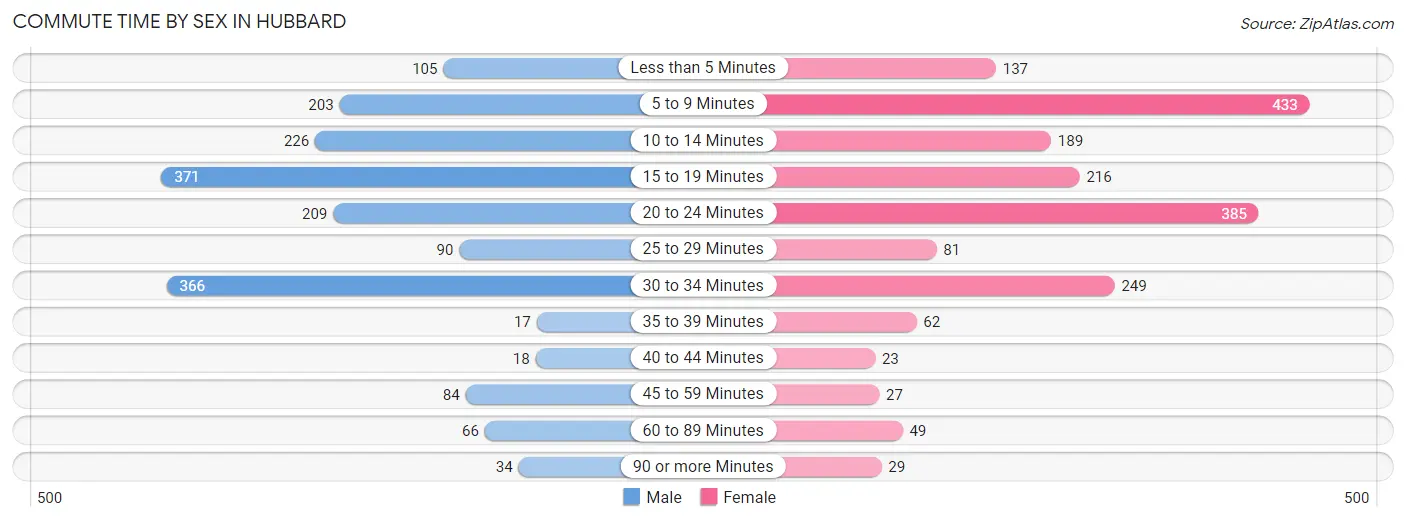
| Commute Time | Male | Female |
| Less than 5 Minutes | 105 (5.9%) | 137 (7.3%) |
| 5 to 9 Minutes | 203 (11.4%) | 433 (23.0%) |
| 10 to 14 Minutes | 226 (12.6%) | 189 (10.1%) |
| 15 to 19 Minutes | 371 (20.7%) | 216 (11.5%) |
| 20 to 24 Minutes | 209 (11.7%) | 385 (20.5%) |
| 25 to 29 Minutes | 90 (5.0%) | 81 (4.3%) |
| 30 to 34 Minutes | 366 (20.5%) | 249 (13.2%) |
| 35 to 39 Minutes | 17 (0.9%) | 62 (3.3%) |
| 40 to 44 Minutes | 18 (1.0%) | 23 (1.2%) |
| 45 to 59 Minutes | 84 (4.7%) | 27 (1.4%) |
| 60 to 89 Minutes | 66 (3.7%) | 49 (2.6%) |
| 90 or more Minutes | 34 (1.9%) | 29 (1.5%) |
Time of Departure to Work by Sex in Hubbard
The most frequent times of departure to work in Hubbard are 7:00 AM to 7:29 AM (500, 28.0%) for males and 4:00 PM to 11:59 PM (325, 17.3%) for females.
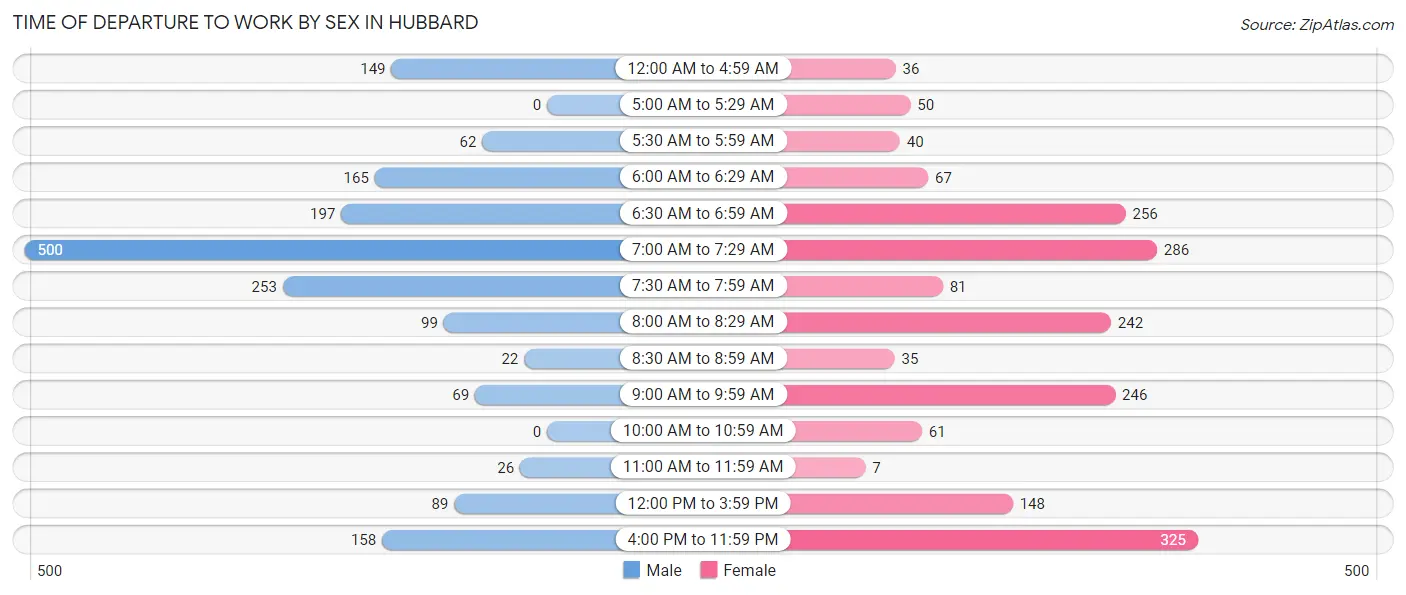
| Time of Departure | Male | Female |
| 12:00 AM to 4:59 AM | 149 (8.3%) | 36 (1.9%) |
| 5:00 AM to 5:29 AM | 0 (0.0%) | 50 (2.7%) |
| 5:30 AM to 5:59 AM | 62 (3.5%) | 40 (2.1%) |
| 6:00 AM to 6:29 AM | 165 (9.2%) | 67 (3.6%) |
| 6:30 AM to 6:59 AM | 197 (11.0%) | 256 (13.6%) |
| 7:00 AM to 7:29 AM | 500 (28.0%) | 286 (15.2%) |
| 7:30 AM to 7:59 AM | 253 (14.1%) | 81 (4.3%) |
| 8:00 AM to 8:29 AM | 99 (5.5%) | 242 (12.9%) |
| 8:30 AM to 8:59 AM | 22 (1.2%) | 35 (1.9%) |
| 9:00 AM to 9:59 AM | 69 (3.9%) | 246 (13.1%) |
| 10:00 AM to 10:59 AM | 0 (0.0%) | 61 (3.2%) |
| 11:00 AM to 11:59 AM | 26 (1.5%) | 7 (0.4%) |
| 12:00 PM to 3:59 PM | 89 (5.0%) | 148 (7.9%) |
| 4:00 PM to 11:59 PM | 158 (8.8%) | 325 (17.3%) |
| Total | 1,789 (100.0%) | 1,880 (100.0%) |
Housing Occupancy in Hubbard
Occupancy by Ownership in Hubbard
Of the total 3,380 dwellings in Hubbard, owner-occupied units account for 2,701 (79.9%), while renter-occupied units make up 679 (20.1%).
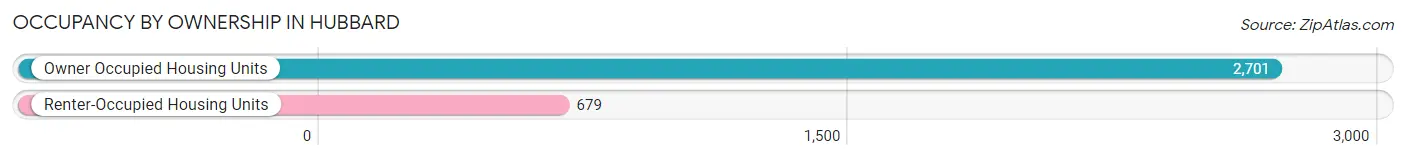
| Occupancy | # Housing Units | % Housing Units |
| Owner Occupied Housing Units | 2,701 | 79.9% |
| Renter-Occupied Housing Units | 679 | 20.1% |
| Total Occupied Housing Units | 3,380 | 100.0% |
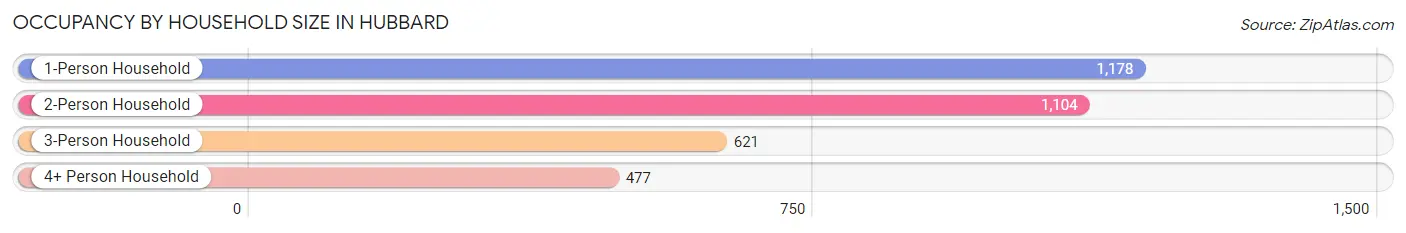
Occupancy by Household Size in Hubbard
| Household Size | # Housing Units | % Housing Units |
| 1-Person Household | 1,178 | 34.8% |
| 2-Person Household | 1,104 | 32.7% |
| 3-Person Household | 621 | 18.4% |
| 4+ Person Household | 477 | 14.1% |
| Total Housing Units | 3,380 | 100.0% |
Occupancy by Ownership by Household Size in Hubbard
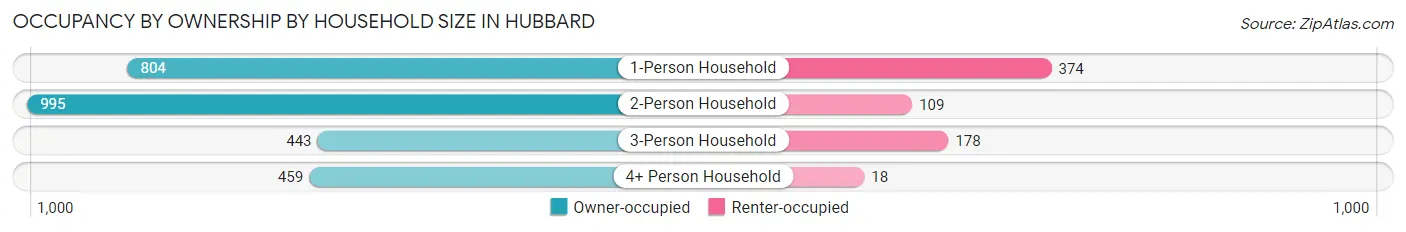
| Household Size | Owner-occupied | Renter-occupied |
| 1-Person Household | 804 (68.2%) | 374 (31.8%) |
| 2-Person Household | 995 (90.1%) | 109 (9.9%) |
| 3-Person Household | 443 (71.3%) | 178 (28.7%) |
| 4+ Person Household | 459 (96.2%) | 18 (3.8%) |
| Total Housing Units | 2,701 (79.9%) | 679 (20.1%) |
Occupancy by Educational Attainment in Hubbard
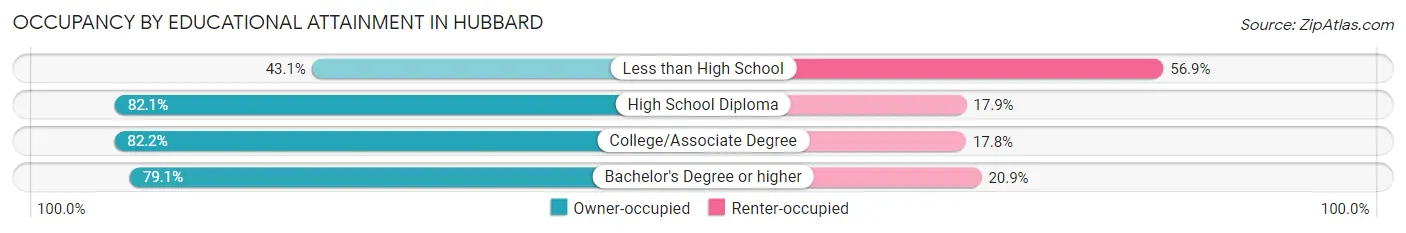
| Household Size | Owner-occupied | Renter-occupied |
| Less than High School | 56 (43.1%) | 74 (56.9%) |
| High School Diploma | 973 (82.1%) | 212 (17.9%) |
| College/Associate Degree | 1,016 (82.2%) | 220 (17.8%) |
| Bachelor's Degree or higher | 656 (79.1%) | 173 (20.9%) |
Occupancy by Age of Householder in Hubbard
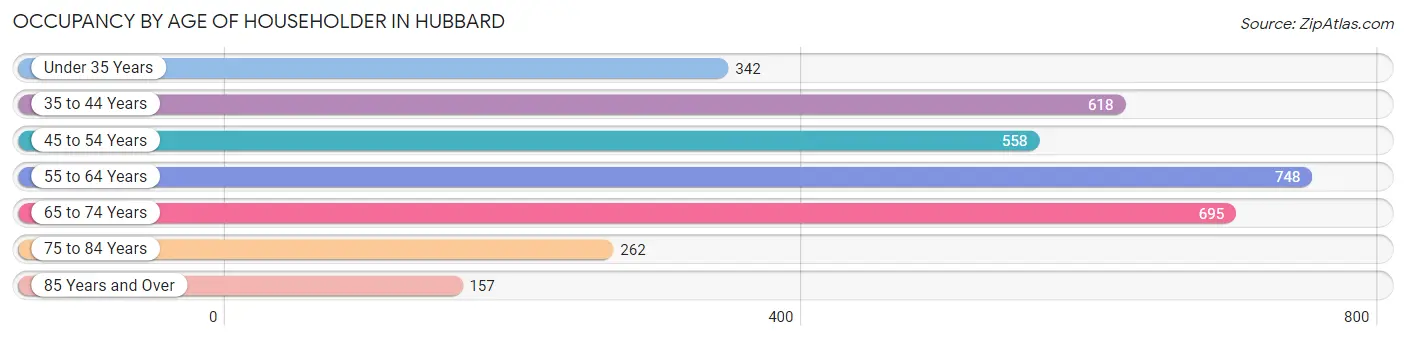
| Age Bracket | # Households | % Households |
| Under 35 Years | 342 | 10.1% |
| 35 to 44 Years | 618 | 18.3% |
| 45 to 54 Years | 558 | 16.5% |
| 55 to 64 Years | 748 | 22.1% |
| 65 to 74 Years | 695 | 20.6% |
| 75 to 84 Years | 262 | 7.7% |
| 85 Years and Over | 157 | 4.6% |
| Total | 3,380 | 100.0% |
Housing Finances in Hubbard
Median Income by Occupancy in Hubbard
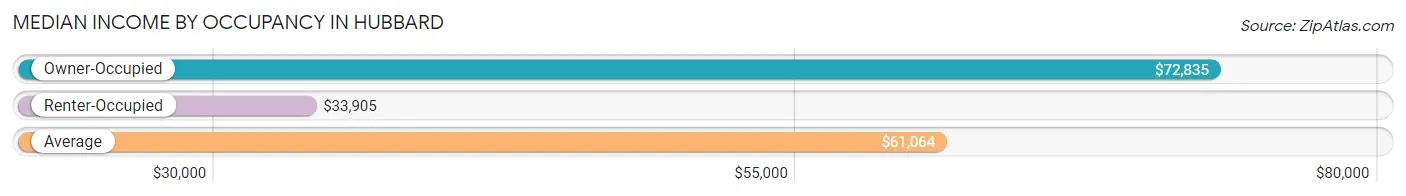
| Occupancy Type | # Households | Median Income |
| Owner-Occupied | 2,701 (79.9%) | $72,835 |
| Renter-Occupied | 679 (20.1%) | $33,905 |
| Average | 3,380 (100.0%) | $61,064 |
Occupancy by Householder Income Bracket in Hubbard
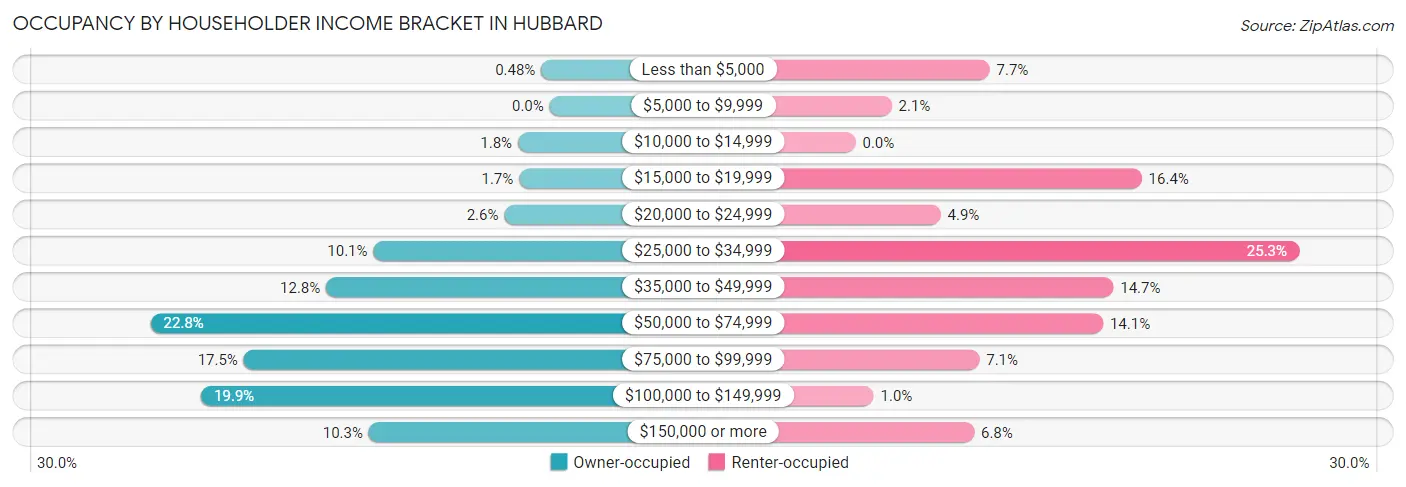
| Income Bracket | Owner-occupied | Renter-occupied |
| Less than $5,000 | 13 (0.5%) | 52 (7.7%) |
| $5,000 to $9,999 | 0 (0.0%) | 14 (2.1%) |
| $10,000 to $14,999 | 49 (1.8%) | 0 (0.0%) |
| $15,000 to $19,999 | 47 (1.7%) | 111 (16.4%) |
| $20,000 to $24,999 | 70 (2.6%) | 33 (4.9%) |
| $25,000 to $34,999 | 272 (10.1%) | 172 (25.3%) |
| $35,000 to $49,999 | 345 (12.8%) | 100 (14.7%) |
| $50,000 to $74,999 | 616 (22.8%) | 96 (14.1%) |
| $75,000 to $99,999 | 472 (17.5%) | 48 (7.1%) |
| $100,000 to $149,999 | 538 (19.9%) | 7 (1.0%) |
| $150,000 or more | 279 (10.3%) | 46 (6.8%) |
| Total | 2,701 (100.0%) | 679 (100.0%) |
Monthly Housing Cost Tiers in Hubbard
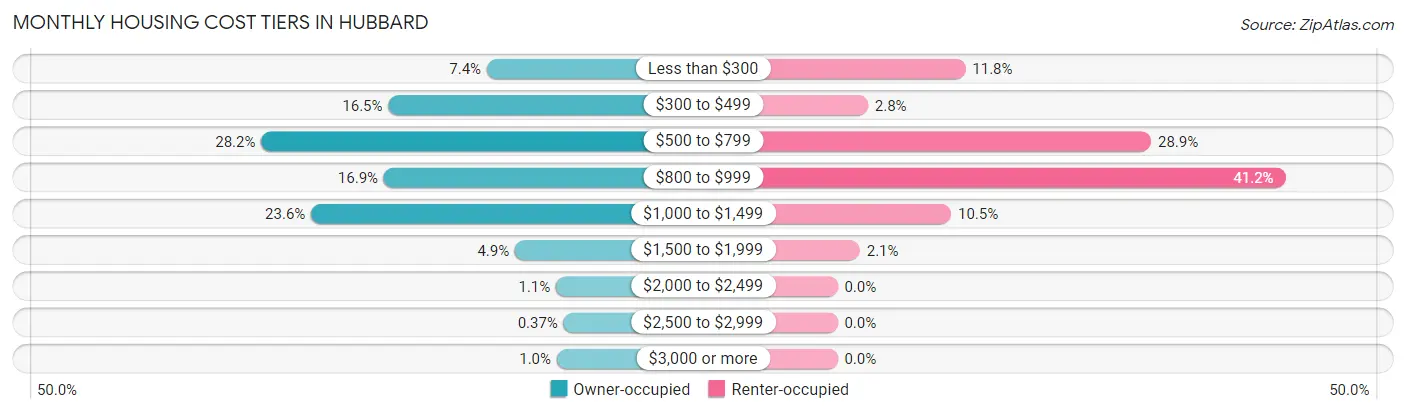
| Monthly Cost | Owner-occupied | Renter-occupied |
| Less than $300 | 201 (7.4%) | 80 (11.8%) |
| $300 to $499 | 446 (16.5%) | 19 (2.8%) |
| $500 to $799 | 762 (28.2%) | 196 (28.9%) |
| $800 to $999 | 457 (16.9%) | 280 (41.2%) |
| $1,000 to $1,499 | 638 (23.6%) | 71 (10.5%) |
| $1,500 to $1,999 | 131 (4.9%) | 14 (2.1%) |
| $2,000 to $2,499 | 29 (1.1%) | 0 (0.0%) |
| $2,500 to $2,999 | 10 (0.4%) | 0 (0.0%) |
| $3,000 or more | 27 (1.0%) | 0 (0.0%) |
| Total | 2,701 (100.0%) | 679 (100.0%) |
Physical Housing Characteristics in Hubbard
Housing Structures in Hubbard
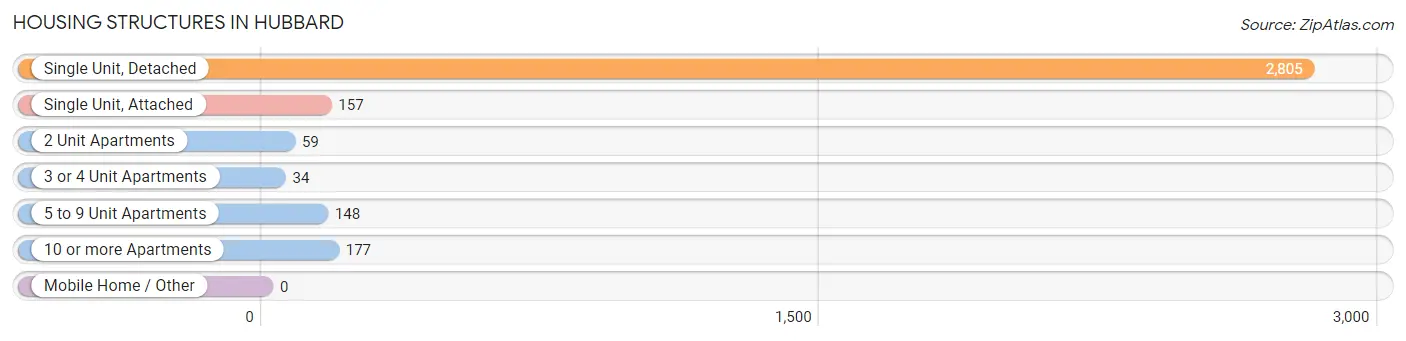
| Structure Type | # Housing Units | % Housing Units |
| Single Unit, Detached | 2,805 | 83.0% |
| Single Unit, Attached | 157 | 4.6% |
| 2 Unit Apartments | 59 | 1.8% |
| 3 or 4 Unit Apartments | 34 | 1.0% |
| 5 to 9 Unit Apartments | 148 | 4.4% |
| 10 or more Apartments | 177 | 5.2% |
| Mobile Home / Other | 0 | 0.0% |
| Total | 3,380 | 100.0% |
Housing Structures by Occupancy in Hubbard
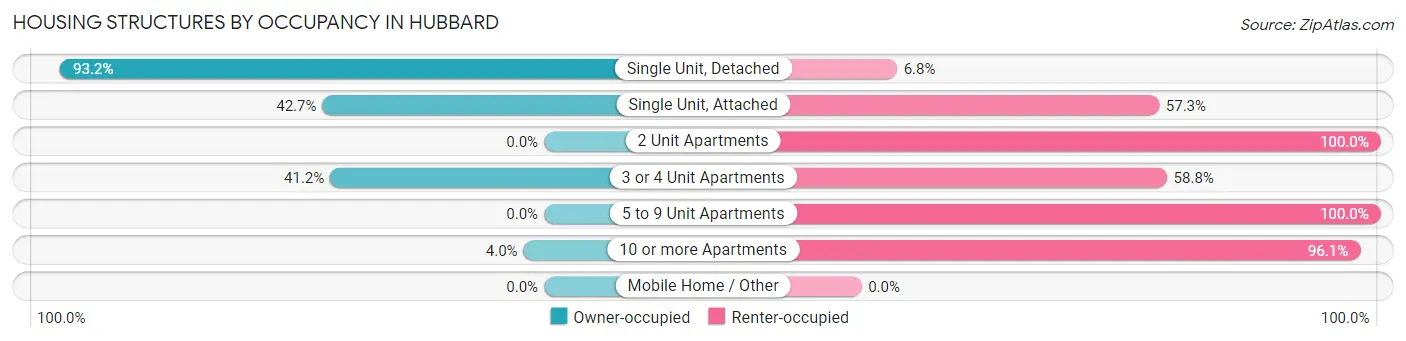
| Structure Type | Owner-occupied | Renter-occupied |
| Single Unit, Detached | 2,613 (93.2%) | 192 (6.8%) |
| Single Unit, Attached | 67 (42.7%) | 90 (57.3%) |
| 2 Unit Apartments | 0 (0.0%) | 59 (100.0%) |
| 3 or 4 Unit Apartments | 14 (41.2%) | 20 (58.8%) |
| 5 to 9 Unit Apartments | 0 (0.0%) | 148 (100.0%) |
| 10 or more Apartments | 7 (4.0%) | 170 (96.1%) |
| Mobile Home / Other | 0 (0.0%) | 0 (0.0%) |
| Total | 2,701 (79.9%) | 679 (20.1%) |
Housing Structures by Number of Rooms in Hubbard
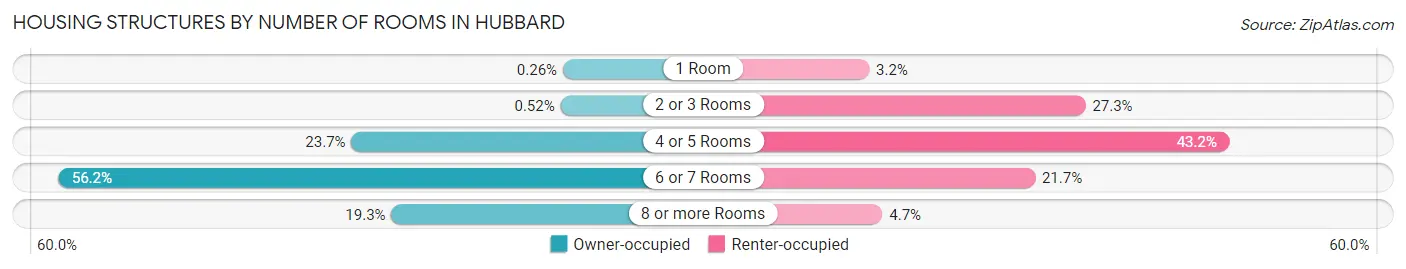
| Number of Rooms | Owner-occupied | Renter-occupied |
| 1 Room | 7 (0.3%) | 22 (3.2%) |
| 2 or 3 Rooms | 14 (0.5%) | 185 (27.3%) |
| 4 or 5 Rooms | 641 (23.7%) | 293 (43.1%) |
| 6 or 7 Rooms | 1,518 (56.2%) | 147 (21.6%) |
| 8 or more Rooms | 521 (19.3%) | 32 (4.7%) |
| Total | 2,701 (100.0%) | 679 (100.0%) |
Housing Structure by Heating Type in Hubbard
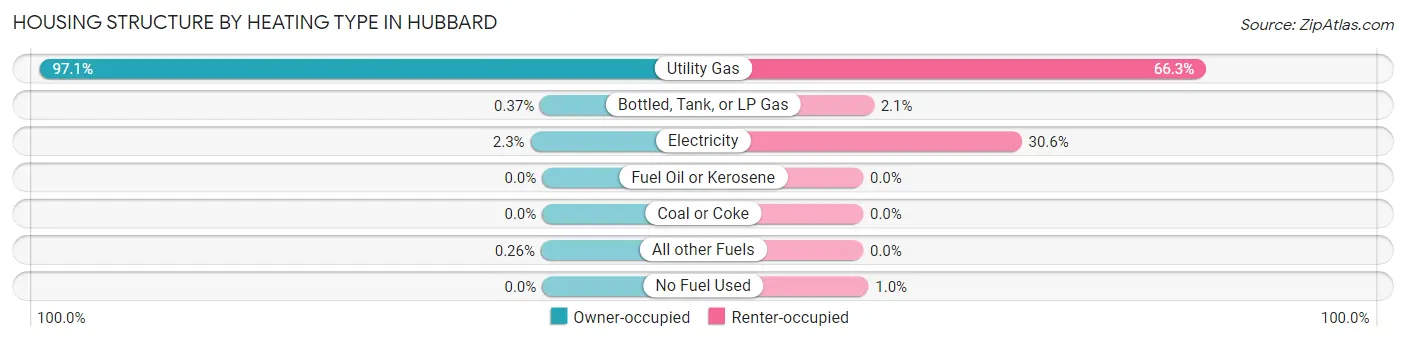
| Heating Type | Owner-occupied | Renter-occupied |
| Utility Gas | 2,623 (97.1%) | 450 (66.3%) |
| Bottled, Tank, or LP Gas | 10 (0.4%) | 14 (2.1%) |
| Electricity | 61 (2.3%) | 208 (30.6%) |
| Fuel Oil or Kerosene | 0 (0.0%) | 0 (0.0%) |
| Coal or Coke | 0 (0.0%) | 0 (0.0%) |
| All other Fuels | 7 (0.3%) | 0 (0.0%) |
| No Fuel Used | 0 (0.0%) | 7 (1.0%) |
| Total | 2,701 (100.0%) | 679 (100.0%) |
Household Vehicle Usage in Hubbard
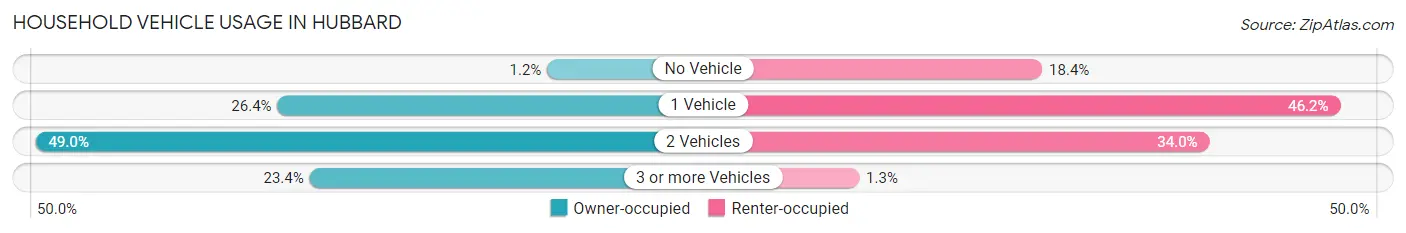
| Vehicles per Household | Owner-occupied | Renter-occupied |
| No Vehicle | 33 (1.2%) | 125 (18.4%) |
| 1 Vehicle | 713 (26.4%) | 314 (46.2%) |
| 2 Vehicles | 1,323 (49.0%) | 231 (34.0%) |
| 3 or more Vehicles | 632 (23.4%) | 9 (1.3%) |
| Total | 2,701 (100.0%) | 679 (100.0%) |
Real Estate & Mortgages in Hubbard
Real Estate and Mortgage Overview in Hubbard
| Characteristic | Without Mortgage | With Mortgage |
| Housing Units | 1,186 | 1,515 |
| Median Property Value | $116,000 | $119,500 |
| Median Household Income | $68,526 | $237 |
| Monthly Housing Costs | $480 | $27 |
| Real Estate Taxes | $1,549 | $14 |
Property Value by Mortgage Status in Hubbard
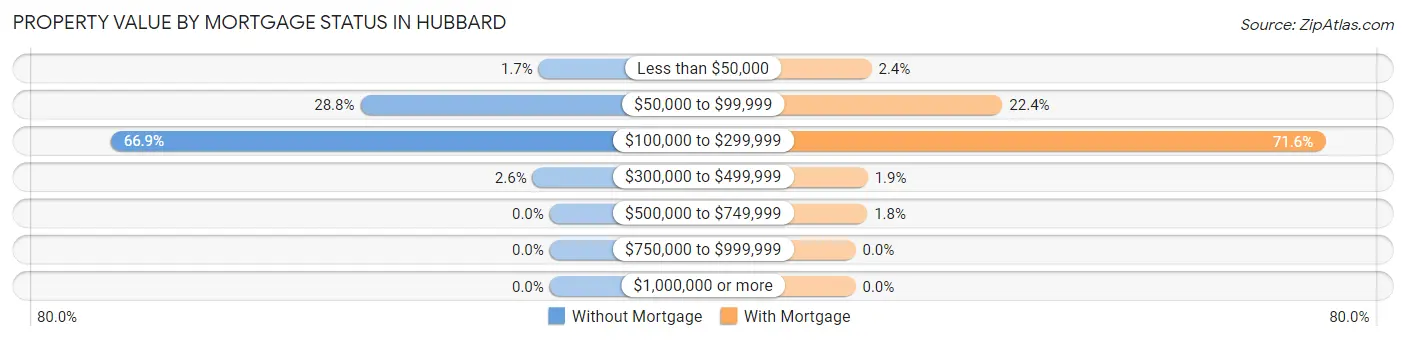
| Property Value | Without Mortgage | With Mortgage |
| Less than $50,000 | 20 (1.7%) | 37 (2.4%) |
| $50,000 to $99,999 | 342 (28.8%) | 339 (22.4%) |
| $100,000 to $299,999 | 793 (66.9%) | 1,084 (71.6%) |
| $300,000 to $499,999 | 31 (2.6%) | 28 (1.8%) |
| $500,000 to $749,999 | 0 (0.0%) | 27 (1.8%) |
| $750,000 to $999,999 | 0 (0.0%) | 0 (0.0%) |
| $1,000,000 or more | 0 (0.0%) | 0 (0.0%) |
| Total | 1,186 (100.0%) | 1,515 (100.0%) |
Household Income by Mortgage Status in Hubbard
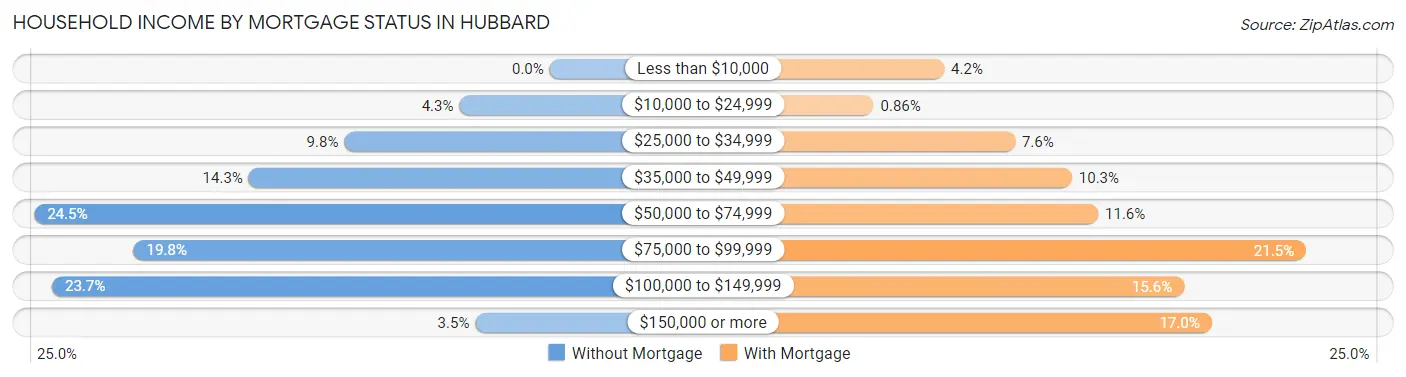
| Household Income | Without Mortgage | With Mortgage |
| Less than $10,000 | 0 (0.0%) | 64 (4.2%) |
| $10,000 to $24,999 | 51 (4.3%) | 13 (0.9%) |
| $25,000 to $34,999 | 116 (9.8%) | 115 (7.6%) |
| $35,000 to $49,999 | 170 (14.3%) | 156 (10.3%) |
| $50,000 to $74,999 | 291 (24.5%) | 175 (11.6%) |
| $75,000 to $99,999 | 235 (19.8%) | 325 (21.4%) |
| $100,000 to $149,999 | 281 (23.7%) | 237 (15.6%) |
| $150,000 or more | 42 (3.5%) | 257 (17.0%) |
| Total | 1,186 (100.0%) | 1,515 (100.0%) |
Property Value to Household Income Ratio in Hubbard
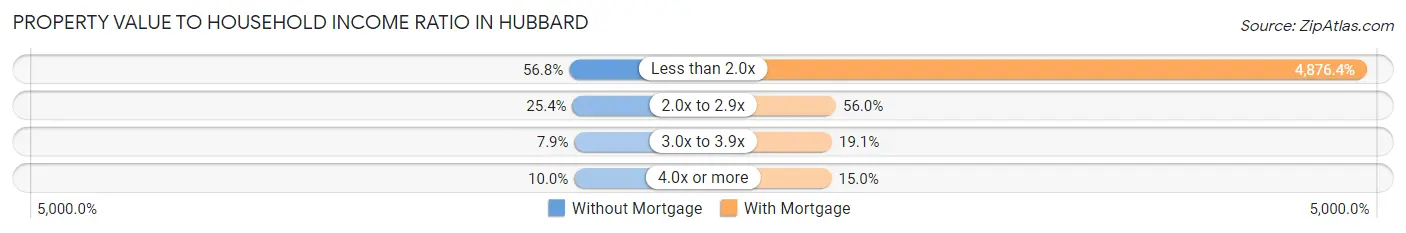
| Value-to-Income Ratio | Without Mortgage | With Mortgage |
| Less than 2.0x | 673 (56.8%) | 73,877 (4,876.4%) |
| 2.0x to 2.9x | 301 (25.4%) | 848 (56.0%) |
| 3.0x to 3.9x | 94 (7.9%) | 289 (19.1%) |
| 4.0x or more | 118 (10.0%) | 227 (15.0%) |
| Total | 1,186 (100.0%) | 1,515 (100.0%) |
Real Estate Taxes by Mortgage Status in Hubbard
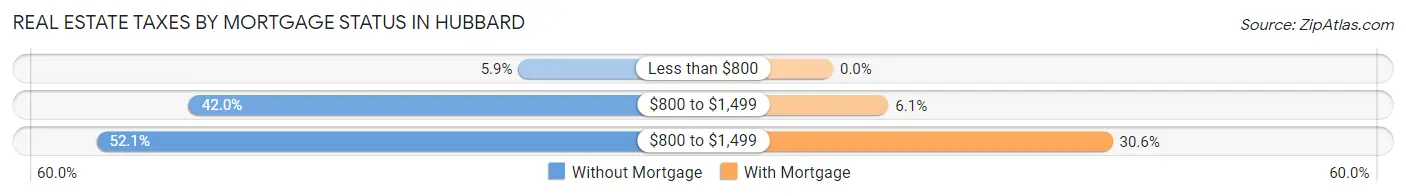
| Property Taxes | Without Mortgage | With Mortgage |
| Less than $800 | 70 (5.9%) | 0 (0.0%) |
| $800 to $1,499 | 498 (42.0%) | 92 (6.1%) |
| $800 to $1,499 | 618 (52.1%) | 464 (30.6%) |
| Total | 1,186 (100.0%) | 1,515 (100.0%) |
Health & Disability in Hubbard
Health Insurance Coverage by Age in Hubbard
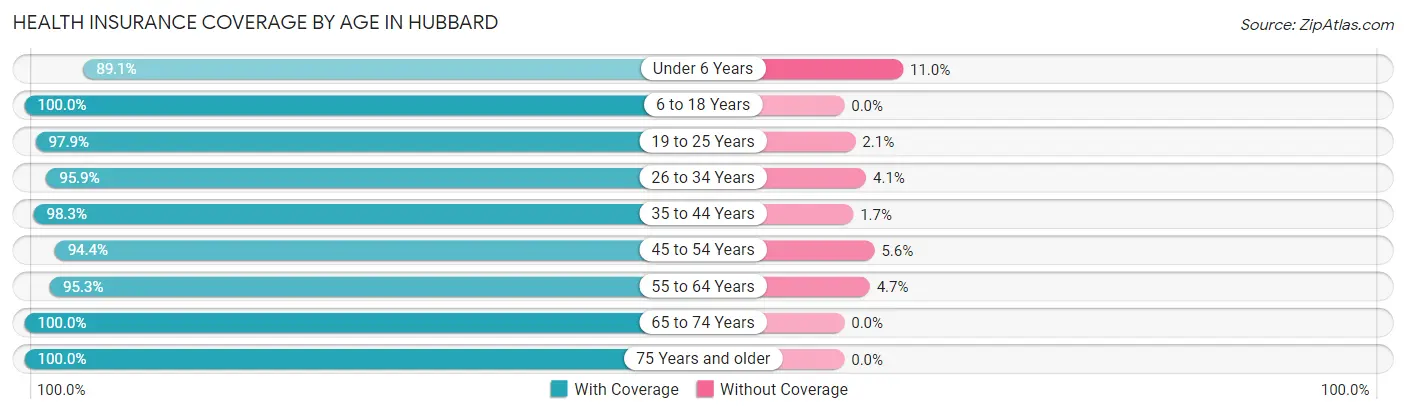
| Age Bracket | With Coverage | Without Coverage |
| Under 6 Years | 309 (89.0%) | 38 (11.0%) |
| 6 to 18 Years | 1,228 (100.0%) | 0 (0.0%) |
| 19 to 25 Years | 567 (97.9%) | 12 (2.1%) |
| 26 to 34 Years | 638 (95.9%) | 27 (4.1%) |
| 35 to 44 Years | 1,000 (98.3%) | 17 (1.7%) |
| 45 to 54 Years | 789 (94.4%) | 47 (5.6%) |
| 55 to 64 Years | 1,207 (95.3%) | 60 (4.7%) |
| 65 to 74 Years | 1,045 (100.0%) | 0 (0.0%) |
| 75 Years and older | 634 (100.0%) | 0 (0.0%) |
| Total | 7,417 (97.4%) | 201 (2.6%) |
Health Insurance Coverage by Citizenship Status in Hubbard
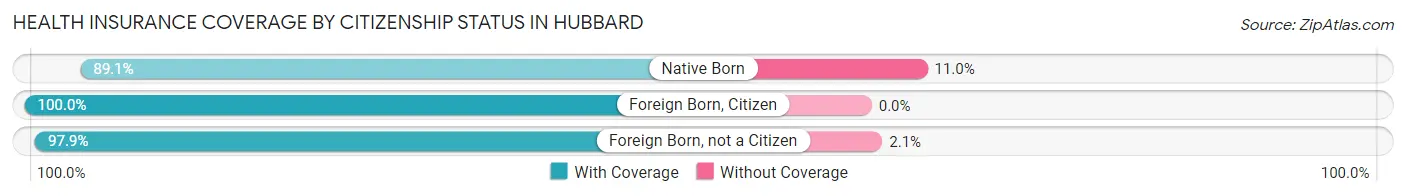
| Citizenship Status | With Coverage | Without Coverage |
| Native Born | 309 (89.0%) | 38 (11.0%) |
| Foreign Born, Citizen | 1,228 (100.0%) | 0 (0.0%) |
| Foreign Born, not a Citizen | 567 (97.9%) | 12 (2.1%) |
Health Insurance Coverage by Household Income in Hubbard
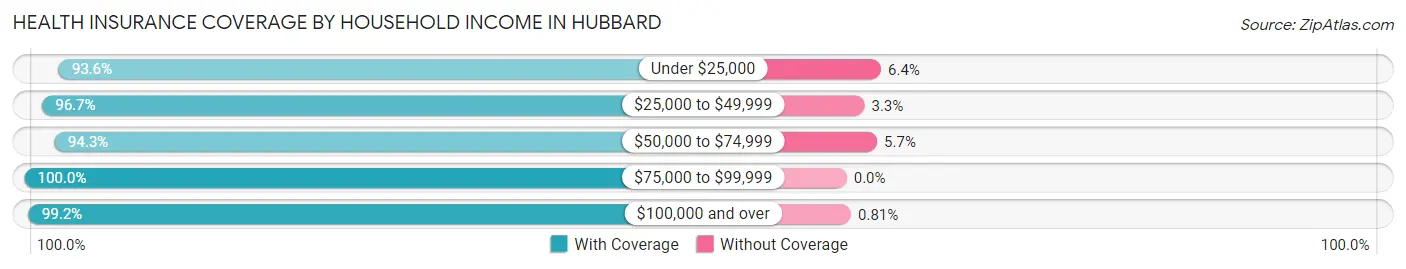
| Household Income | With Coverage | Without Coverage |
| Under $25,000 | 700 (93.6%) | 48 (6.4%) |
| $25,000 to $49,999 | 1,281 (96.7%) | 44 (3.3%) |
| $50,000 to $74,999 | 1,441 (94.3%) | 87 (5.7%) |
| $75,000 to $99,999 | 1,312 (100.0%) | 0 (0.0%) |
| $100,000 and over | 2,683 (99.2%) | 22 (0.8%) |
Public vs Private Health Insurance Coverage by Age in Hubbard
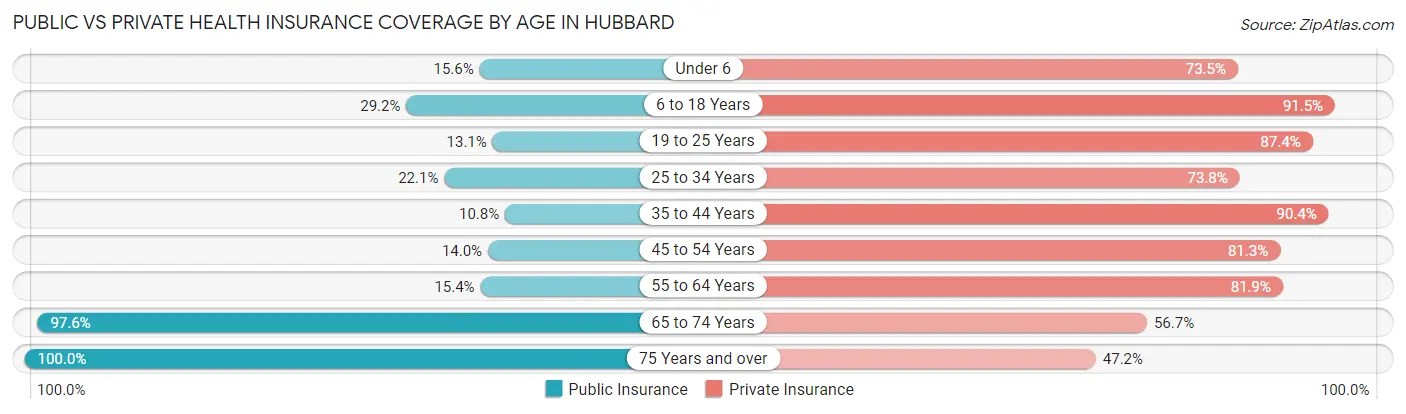
| Age Bracket | Public Insurance | Private Insurance |
| Under 6 | 54 (15.6%) | 255 (73.5%) |
| 6 to 18 Years | 358 (29.1%) | 1,124 (91.5%) |
| 19 to 25 Years | 76 (13.1%) | 506 (87.4%) |
| 25 to 34 Years | 147 (22.1%) | 491 (73.8%) |
| 35 to 44 Years | 110 (10.8%) | 919 (90.4%) |
| 45 to 54 Years | 117 (14.0%) | 680 (81.3%) |
| 55 to 64 Years | 195 (15.4%) | 1,037 (81.9%) |
| 65 to 74 Years | 1,020 (97.6%) | 592 (56.7%) |
| 75 Years and over | 634 (100.0%) | 299 (47.2%) |
| Total | 2,711 (35.6%) | 5,903 (77.5%) |
Disability Status by Sex by Age in Hubbard
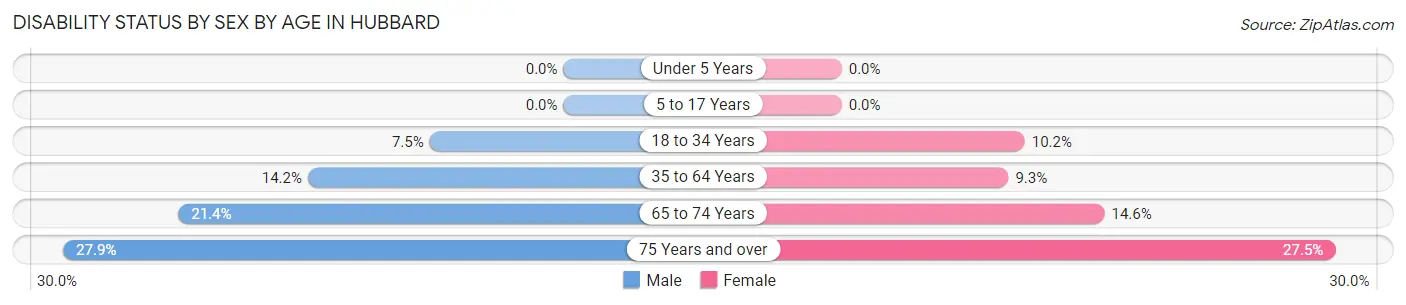
| Age Bracket | Male | Female |
| Under 5 Years | 0 (0.0%) | 0 (0.0%) |
| 5 to 17 Years | 0 (0.0%) | 0 (0.0%) |
| 18 to 34 Years | 55 (7.4%) | 65 (10.2%) |
| 35 to 64 Years | 214 (14.2%) | 150 (9.3%) |
| 65 to 74 Years | 101 (21.4%) | 84 (14.6%) |
| 75 Years and over | 61 (27.9%) | 114 (27.5%) |
Disability Class by Sex by Age in Hubbard
Disability Class: Hearing Difficulty
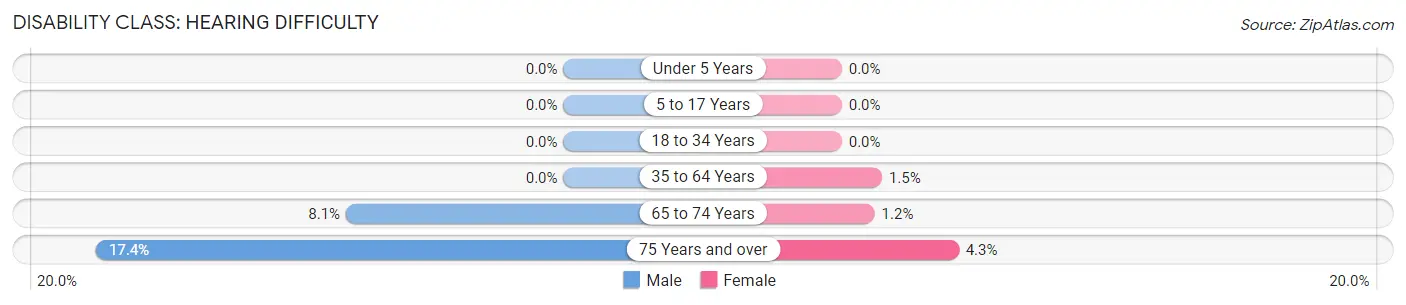
| Age Bracket | Male | Female |
| Under 5 Years | 0 (0.0%) | 0 (0.0%) |
| 5 to 17 Years | 0 (0.0%) | 0 (0.0%) |
| 18 to 34 Years | 0 (0.0%) | 0 (0.0%) |
| 35 to 64 Years | 0 (0.0%) | 24 (1.5%) |
| 65 to 74 Years | 38 (8.1%) | 7 (1.2%) |
| 75 Years and over | 38 (17.3%) | 18 (4.3%) |
Disability Class: Vision Difficulty
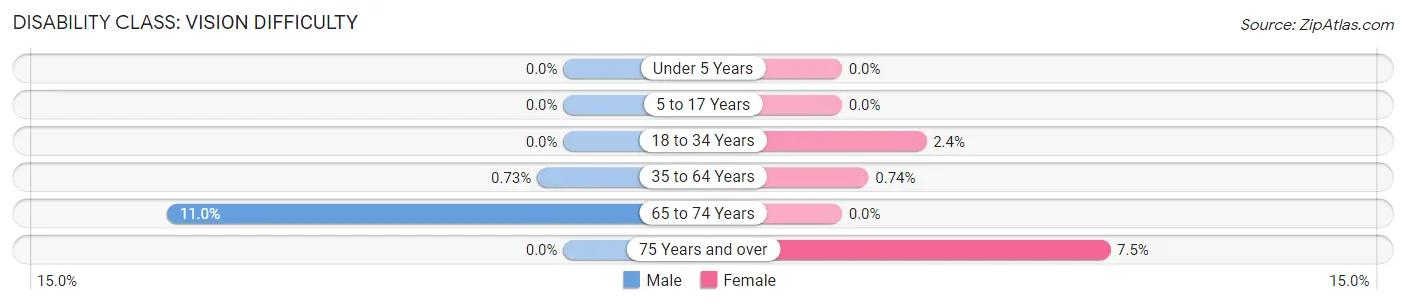
| Age Bracket | Male | Female |
| Under 5 Years | 0 (0.0%) | 0 (0.0%) |
| 5 to 17 Years | 0 (0.0%) | 0 (0.0%) |
| 18 to 34 Years | 0 (0.0%) | 15 (2.4%) |
| 35 to 64 Years | 11 (0.7%) | 12 (0.7%) |
| 65 to 74 Years | 52 (11.0%) | 0 (0.0%) |
| 75 Years and over | 0 (0.0%) | 31 (7.5%) |
Disability Class: Cognitive Difficulty
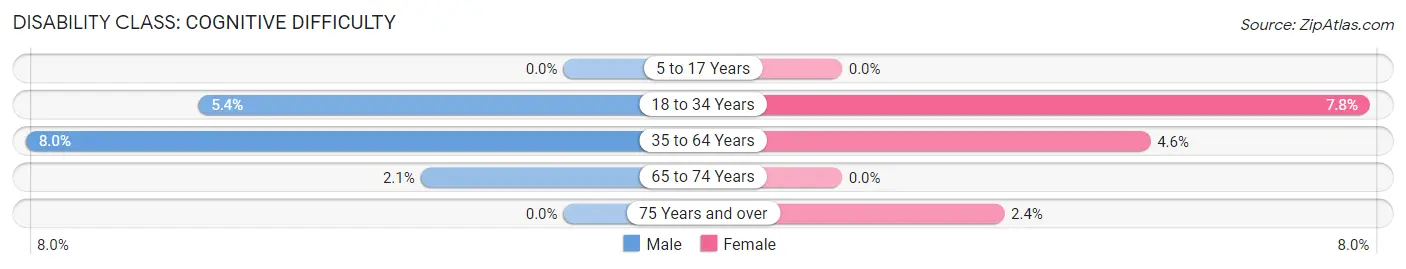
| Age Bracket | Male | Female |
| 5 to 17 Years | 0 (0.0%) | 0 (0.0%) |
| 18 to 34 Years | 40 (5.4%) | 50 (7.8%) |
| 35 to 64 Years | 120 (8.0%) | 74 (4.6%) |
| 65 to 74 Years | 10 (2.1%) | 0 (0.0%) |
| 75 Years and over | 0 (0.0%) | 10 (2.4%) |
Disability Class: Ambulatory Difficulty
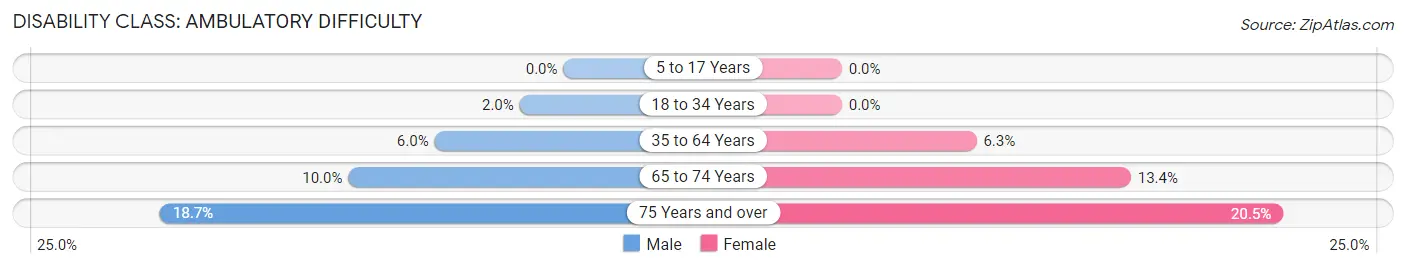
| Age Bracket | Male | Female |
| 5 to 17 Years | 0 (0.0%) | 0 (0.0%) |
| 18 to 34 Years | 15 (2.0%) | 0 (0.0%) |
| 35 to 64 Years | 90 (6.0%) | 101 (6.2%) |
| 65 to 74 Years | 47 (10.0%) | 77 (13.4%) |
| 75 Years and over | 41 (18.7%) | 85 (20.5%) |
Disability Class: Self-Care Difficulty
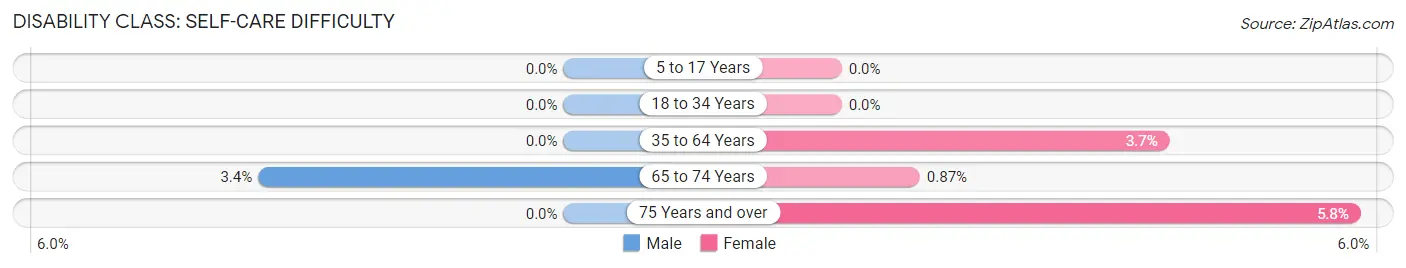
| Age Bracket | Male | Female |
| 5 to 17 Years | 0 (0.0%) | 0 (0.0%) |
| 18 to 34 Years | 0 (0.0%) | 0 (0.0%) |
| 35 to 64 Years | 0 (0.0%) | 59 (3.6%) |
| 65 to 74 Years | 16 (3.4%) | 5 (0.9%) |
| 75 Years and over | 0 (0.0%) | 24 (5.8%) |
Technology Access in Hubbard
Computing Device Access in Hubbard
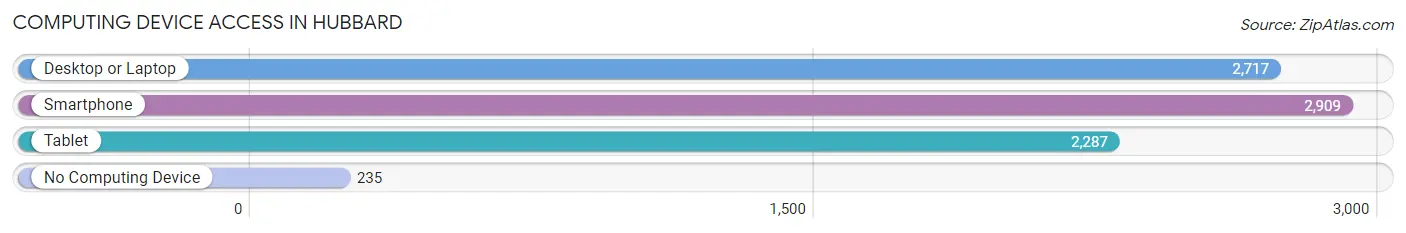
| Device Type | # Households | % Households |
| Desktop or Laptop | 2,717 | 80.4% |
| Smartphone | 2,909 | 86.1% |
| Tablet | 2,287 | 67.7% |
| No Computing Device | 235 | 7.0% |
| Total | 3,380 | 100.0% |
Internet Access in Hubbard
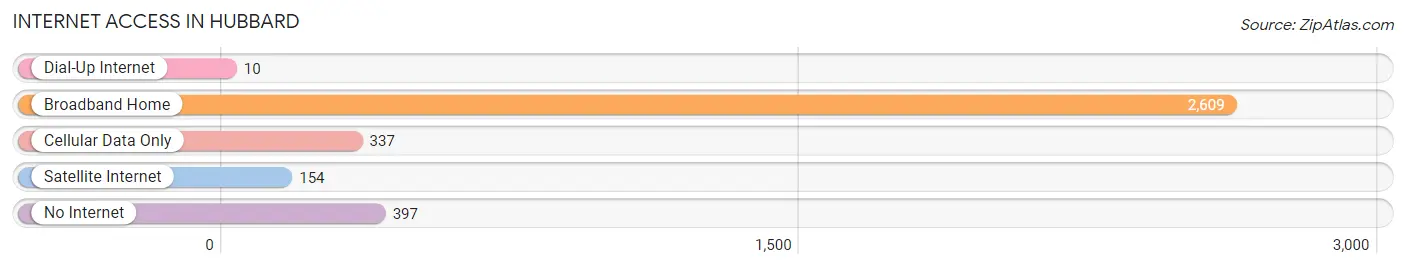
| Internet Type | # Households | % Households |
| Dial-Up Internet | 10 | 0.3% |
| Broadband Home | 2,609 | 77.2% |
| Cellular Data Only | 337 | 10.0% |
| Satellite Internet | 154 | 4.6% |
| No Internet | 397 | 11.7% |
| Total | 3,380 | 100.0% |
Hubbard Summary
Hubbard, Ohio is a small city located in Trumbull County, Ohio. It is situated in the Mahoning Valley region of the state, approximately 30 miles southeast of Youngstown. The city has a population of 8,717, according to the 2010 census.
History
The area that is now Hubbard was first settled in 1802 by a group of settlers from Connecticut. The town was originally known as Hubbard Township, and was named after its first settler, Samuel Hubbard. The township was incorporated in 1834, and the village of Hubbard was established in 1851.
The city of Hubbard was officially incorporated in 1875. At the time, the city was a major center for the production of iron and steel. The city was also home to several factories, including the Hubbard Foundry and Machine Company, which produced agricultural implements and machinery.
The city experienced a period of growth in the late 19th and early 20th centuries, as the population increased from 1,000 in 1880 to 4,000 in 1910. The city was also home to several large businesses, including the Hubbard Foundry and Machine Company, the Hubbard Manufacturing Company, and the Hubbard Iron and Steel Company.
Geography
Hubbard is located in the Mahoning Valley region of Ohio, approximately 30 miles southeast of Youngstown. The city is situated on the Mahoning River, which flows through the city. The city is located in a hilly area, with an elevation of 1,068 feet above sea level.
The city has a total area of 4.2 square miles, of which 4.1 square miles is land and 0.1 square miles is water. The city is bordered by Liberty Township to the north, Brookfield Township to the east, Vienna Township to the south, and Weathersfield Township to the west.
Economy
The economy of Hubbard is largely based on manufacturing and agriculture. The city is home to several factories, including the Hubbard Foundry and Machine Company, the Hubbard Manufacturing Company, and the Hubbard Iron and Steel Company. The city is also home to several agricultural businesses, including the Hubbard Dairy Farm and the Hubbard Fruit Farm.
The city is also home to several retail businesses, including several restaurants, grocery stores, and other retail stores. The city is also home to several medical facilities, including the Hubbard Community Hospital and the Hubbard Medical Center.
Demographics
According to the 2010 census, the population of Hubbard was 8,717. The racial makeup of the city was 94.3% White, 2.3% African American, 0.3% Native American, 0.7% Asian, 0.1% Pacific Islander, 0.7% from other races, and 1.6% from two or more races. Hispanic or Latino of any race were 2.2% of the population.
The median household income in Hubbard was $37,917, and the median family income was $45,917. The per capita income in the city was $19,917. About 11.3% of the population was below the poverty line.
Common Questions
What is Per Capita Income in Hubbard?
Per Capita income in Hubbard is $37,687.
What is the Median Family Income in Hubbard?
Median Family Income in Hubbard is $83,587.
What is the Median Household income in Hubbard?
Median Household Income in Hubbard is $61,064.
What is Income or Wage Gap in Hubbard?
Income or Wage Gap in Hubbard is 38.7%.
Women in Hubbard earn 61.3 cents for every dollar earned by a man.
What is Inequality or Gini Index in Hubbard?
Inequality or Gini Index in Hubbard is 0.42.
What is the Total Population of Hubbard?
Total Population of Hubbard is 7,618.
What is the Total Male Population of Hubbard?
Total Male Population of Hubbard is 3,584.
What is the Total Female Population of Hubbard?
Total Female Population of Hubbard is 4,034.
What is the Ratio of Males per 100 Females in Hubbard?
There are 88.84 Males per 100 Females in Hubbard.
What is the Ratio of Females per 100 Males in Hubbard?
There are 112.56 Females per 100 Males in Hubbard.
What is the Median Population Age in Hubbard?
Median Population Age in Hubbard is 44.7 Years.
What is the Average Family Size in Hubbard
Average Family Size in Hubbard is 2.9 People.
What is the Average Household Size in Hubbard
Average Household Size in Hubbard is 2.2 People.
How Large is the Labor Force in Hubbard?
There are 4,143 People in the Labor Forcein in Hubbard.
What is the Percentage of People in the Labor Force in Hubbard?
64.4% of People are in the Labor Force in Hubbard.
What is the Unemployment Rate in Hubbard?
Unemployment Rate in Hubbard is 2.6%.