East Palestine, OH Map & Demographics
East Palestine Map
East Palestine Overview
$30,057
PER CAPITA INCOME
$57,614
AVG FAMILY INCOME
$49,766
AVG HOUSEHOLD INCOME
33.1%
WAGE / INCOME GAP [ % ]
66.9¢/ $1
WAGE / INCOME GAP [ $ ]
0.41
INEQUALITY / GINI INDEX
4,723
TOTAL POPULATION
2,388
MALE POPULATION
2,335
FEMALE POPULATION
102.27
MALES / 100 FEMALES
97.78
FEMALES / 100 MALES
40.4
MEDIAN AGE
2.9
AVG FAMILY SIZE
2.4
AVG HOUSEHOLD SIZE
2,171
LABOR FORCE [ PEOPLE ]
58.3%
PERCENT IN LABOR FORCE
3.7%
UNEMPLOYMENT RATE
East Palestine Zip Codes
East Palestine Area Codes
Income in East Palestine
Income Overview in East Palestine
Per Capita Income in East Palestine is $30,057, while median incomes of families and households are $57,614 and $49,766 respectively.
| Characteristic | Number | Measure |
| Per Capita Income | 4,723 | $30,057 |
| Median Family Income | 1,246 | $57,614 |
| Mean Family Income | 1,246 | $80,794 |
| Median Household Income | 1,981 | $49,766 |
| Mean Household Income | 1,981 | $69,132 |
| Income Deficit | 1,246 | $0 |
| Wage / Income Gap (%) | 4,723 | 33.09% |
| Wage / Income Gap ($) | 4,723 | 66.91¢ per $1 |
| Gini / Inequality Index | 4,723 | 0.41 |
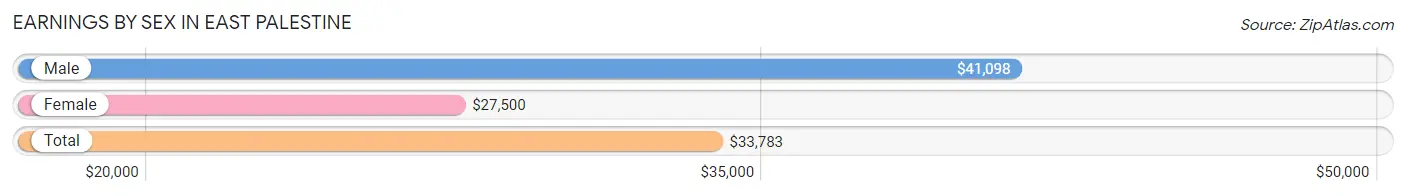
Earnings by Sex in East Palestine
Average Earnings in East Palestine are $33,783, $41,098 for men and $27,500 for women, a difference of 33.1%.
| Sex | Number | Average Earnings |
| Male | 1,071 (49.1%) | $41,098 |
| Female | 1,110 (50.9%) | $27,500 |
| Total | 2,181 (100.0%) | $33,783 |
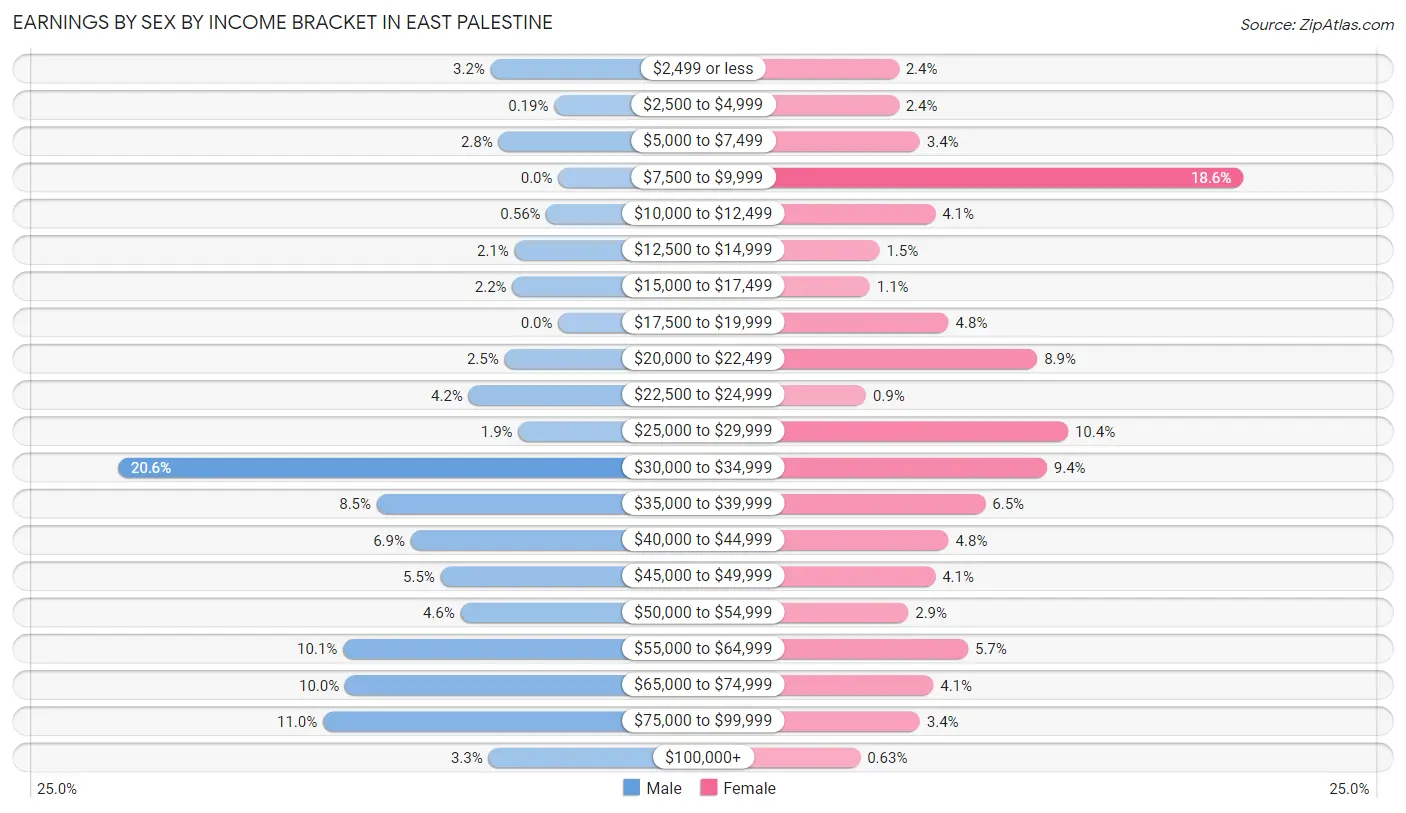
Earnings by Sex by Income Bracket in East Palestine
The most common earnings brackets in East Palestine are $30,000 to $34,999 for men (221 | 20.6%) and $7,500 to $9,999 for women (206 | 18.6%).
| Income | Male | Female |
| $2,499 or less | 34 (3.2%) | 27 (2.4%) |
| $2,500 to $4,999 | 2 (0.2%) | 27 (2.4%) |
| $5,000 to $7,499 | 30 (2.8%) | 38 (3.4%) |
| $7,500 to $9,999 | 0 (0.0%) | 206 (18.6%) |
| $10,000 to $12,499 | 6 (0.6%) | 46 (4.1%) |
| $12,500 to $14,999 | 22 (2.1%) | 17 (1.5%) |
| $15,000 to $17,499 | 23 (2.1%) | 12 (1.1%) |
| $17,500 to $19,999 | 0 (0.0%) | 53 (4.8%) |
| $20,000 to $22,499 | 27 (2.5%) | 99 (8.9%) |
| $22,500 to $24,999 | 45 (4.2%) | 10 (0.9%) |
| $25,000 to $29,999 | 20 (1.9%) | 115 (10.4%) |
| $30,000 to $34,999 | 221 (20.6%) | 104 (9.4%) |
| $35,000 to $39,999 | 91 (8.5%) | 72 (6.5%) |
| $40,000 to $44,999 | 74 (6.9%) | 53 (4.8%) |
| $45,000 to $49,999 | 59 (5.5%) | 46 (4.1%) |
| $50,000 to $54,999 | 49 (4.6%) | 32 (2.9%) |
| $55,000 to $64,999 | 108 (10.1%) | 63 (5.7%) |
| $65,000 to $74,999 | 107 (10.0%) | 45 (4.1%) |
| $75,000 to $99,999 | 118 (11.0%) | 38 (3.4%) |
| $100,000+ | 35 (3.3%) | 7 (0.6%) |
| Total | 1,071 (100.0%) | 1,110 (100.0%) |
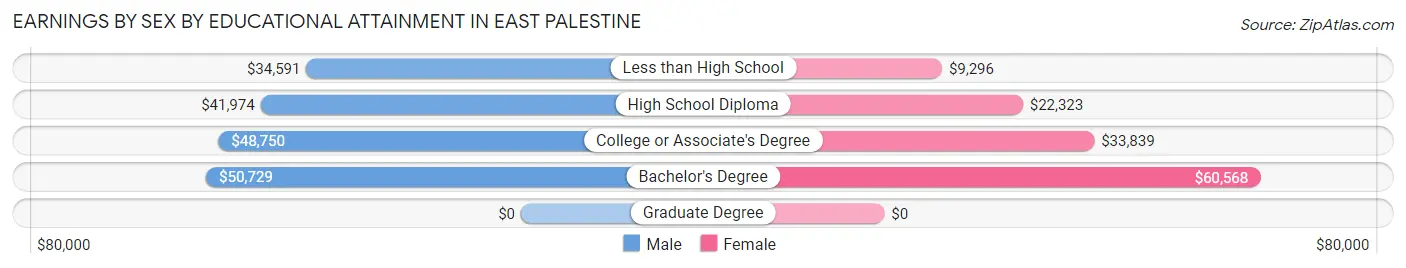
Earnings by Sex by Educational Attainment in East Palestine
Average earnings in East Palestine are $43,581 for men and $29,118 for women, a difference of 33.2%. Men with an educational attainment of bachelor's degree enjoy the highest average annual earnings of $50,729, while those with less than high school education earn the least with $34,591. Women with an educational attainment of bachelor's degree earn the most with the average annual earnings of $60,568, while those with less than high school education have the smallest earnings of $9,296.
| Educational Attainment | Male Income | Female Income |
| Less than High School | $34,591 | $9,296 |
| High School Diploma | $41,974 | $22,323 |
| College or Associate's Degree | $48,750 | $33,839 |
| Bachelor's Degree | $50,729 | $60,568 |
| Graduate Degree | - | - |
| Total | $43,581 | $29,118 |
Family Income in East Palestine
Family Income Brackets in East Palestine
According to the East Palestine family income data, there are 314 families falling into the $50,000 to $74,999 income range, which is the most common income bracket and makes up 25.2% of all families. Conversely, the $15,000 to $24,999 income bracket is the least frequent group with only 17 families (1.4%) belonging to this category.
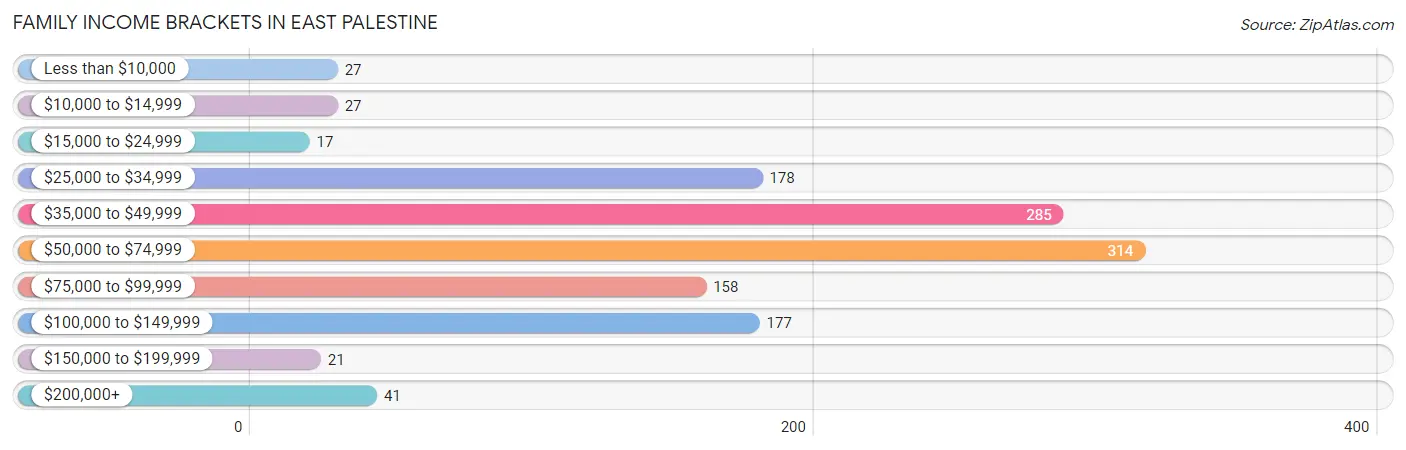
| Income Bracket | # Families | % Families |
| Less than $10,000 | 27 | 2.2% |
| $10,000 to $14,999 | 27 | 2.2% |
| $15,000 to $24,999 | 17 | 1.4% |
| $25,000 to $34,999 | 178 | 14.3% |
| $35,000 to $49,999 | 285 | 22.9% |
| $50,000 to $74,999 | 314 | 25.2% |
| $75,000 to $99,999 | 158 | 12.7% |
| $100,000 to $149,999 | 177 | 14.2% |
| $150,000 to $199,999 | 21 | 1.7% |
| $200,000+ | 41 | 3.3% |
Family Income by Famaliy Size in East Palestine
6-person families (54 | 4.3%) account for the highest median family income in East Palestine with $92,672 per family, while 2-person families (627 | 50.3%) have the highest median income of $29,812 per family member.
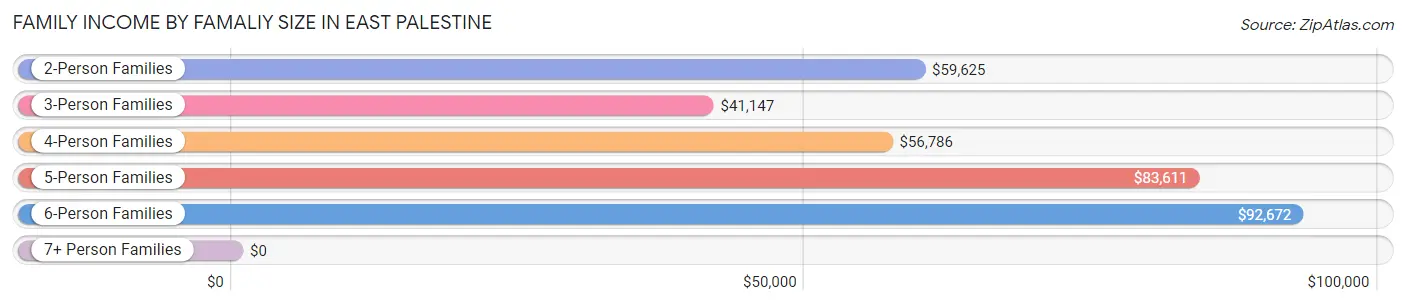
| Income Bracket | # Families | Median Income |
| 2-Person Families | 627 (50.3%) | $59,625 |
| 3-Person Families | 327 (26.2%) | $41,147 |
| 4-Person Families | 202 (16.2%) | $56,786 |
| 5-Person Families | 36 (2.9%) | $83,611 |
| 6-Person Families | 54 (4.3%) | $92,672 |
| 7+ Person Families | 0 (0.0%) | $0 |
| Total | 1,246 (100.0%) | $57,614 |
Family Income by Number of Earners in East Palestine
The median family income in East Palestine is $57,614, with families comprising 2 earners (473) having the highest median family income of $77,639, while families with 1 earner (368) have the lowest median family income of $35,948, accounting for 38.0% and 29.5% of families, respectively.
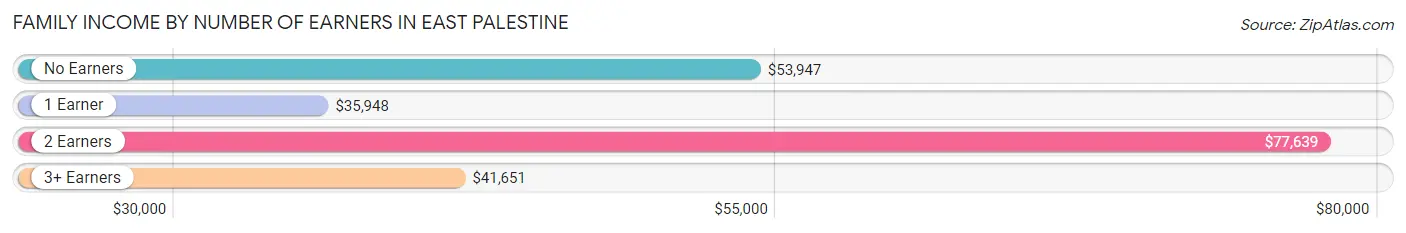
| Number of Earners | # Families | Median Income |
| No Earners | 302 (24.2%) | $53,947 |
| 1 Earner | 368 (29.5%) | $35,948 |
| 2 Earners | 473 (38.0%) | $77,639 |
| 3+ Earners | 103 (8.3%) | $41,651 |
| Total | 1,246 (100.0%) | $57,614 |
Household Income in East Palestine
Household Income Brackets in East Palestine
With 551 households falling in the category, the $35,000 to $49,999 income range is the most frequent in East Palestine, accounting for 27.8% of all households. In contrast, only 22 households (1.1%) fall into the $150,000 to $199,999 income bracket, making it the least populous group.
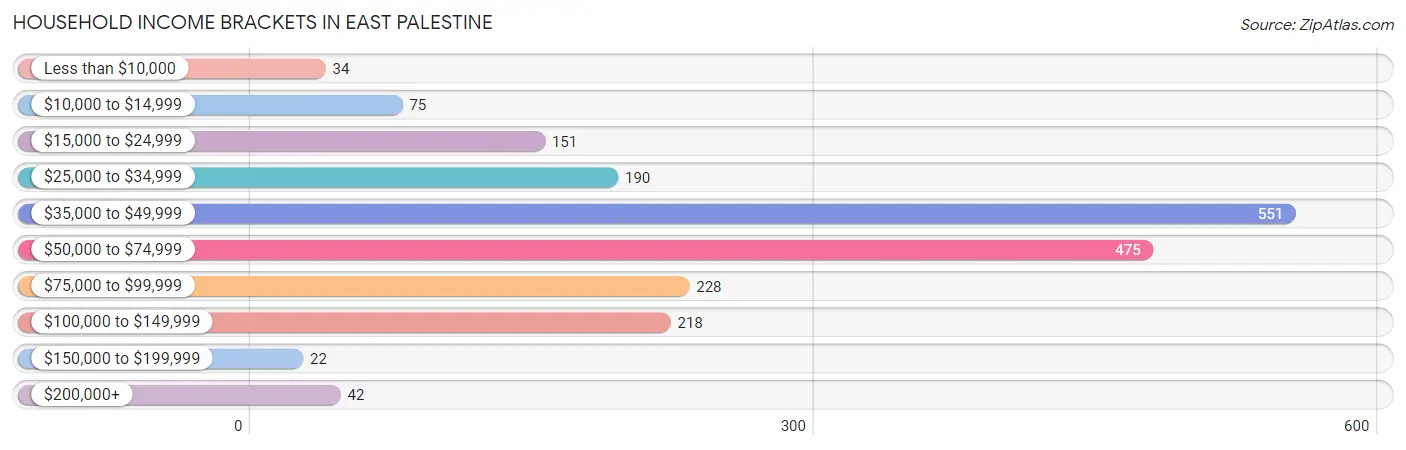
| Income Bracket | # Households | % Households |
| Less than $10,000 | 34 | 1.7% |
| $10,000 to $14,999 | 75 | 3.8% |
| $15,000 to $24,999 | 151 | 7.6% |
| $25,000 to $34,999 | 190 | 9.6% |
| $35,000 to $49,999 | 551 | 27.8% |
| $50,000 to $74,999 | 475 | 24.0% |
| $75,000 to $99,999 | 228 | 11.5% |
| $100,000 to $149,999 | 218 | 11.0% |
| $150,000 to $199,999 | 22 | 1.1% |
| $200,000+ | 42 | 2.1% |
Household Income by Householder Age in East Palestine
The median household income in East Palestine is $49,766, with the highest median household income of $54,856 found in the 45 to 64 years age bracket for the primary householder. A total of 627 households (31.7%) fall into this category. Meanwhile, the 65+ years age bracket for the primary householder has the lowest median household income of $43,917, with 652 households (32.9%) in this group.
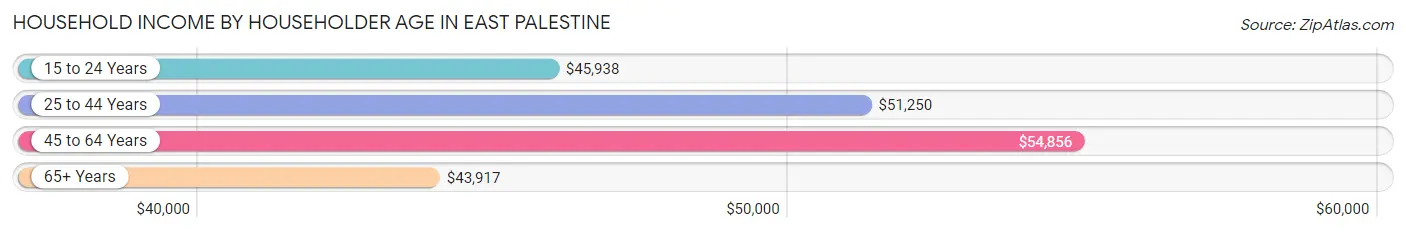
| Income Bracket | # Households | Median Income |
| 15 to 24 Years | 49 (2.5%) | $45,938 |
| 25 to 44 Years | 653 (33.0%) | $51,250 |
| 45 to 64 Years | 627 (31.7%) | $54,856 |
| 65+ Years | 652 (32.9%) | $43,917 |
| Total | 1,981 (100.0%) | $49,766 |
Poverty in East Palestine
Income Below Poverty by Sex and Age in East Palestine
With 4.6% poverty level for males and 11.8% for females among the residents of East Palestine, 5 year old males and 45 to 54 year old females are the most vulnerable to poverty, with 15 males (48.4%) and 96 females (48.7%) in their respective age groups living below the poverty level.
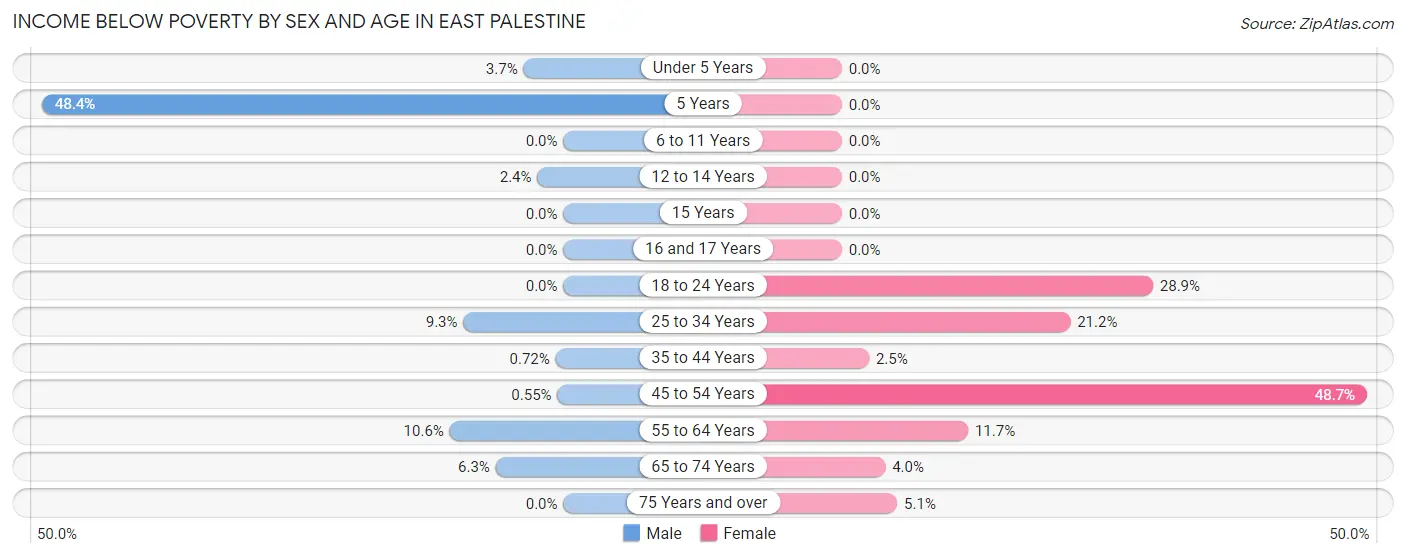
| Age Bracket | Male | Female |
| Under 5 Years | 10 (3.7%) | 0 (0.0%) |
| 5 Years | 15 (48.4%) | 0 (0.0%) |
| 6 to 11 Years | 0 (0.0%) | 0 (0.0%) |
| 12 to 14 Years | 2 (2.4%) | 0 (0.0%) |
| 15 Years | 0 (0.0%) | 0 (0.0%) |
| 16 and 17 Years | 0 (0.0%) | 0 (0.0%) |
| 18 to 24 Years | 0 (0.0%) | 28 (28.9%) |
| 25 to 34 Years | 22 (9.3%) | 74 (21.2%) |
| 35 to 44 Years | 2 (0.7%) | 8 (2.5%) |
| 45 to 54 Years | 1 (0.5%) | 96 (48.7%) |
| 55 to 64 Years | 44 (10.5%) | 35 (11.7%) |
| 65 to 74 Years | 14 (6.3%) | 10 (4.0%) |
| 75 Years and over | 0 (0.0%) | 13 (5.1%) |
| Total | 110 (4.6%) | 264 (11.8%) |
Income Above Poverty by Sex and Age in East Palestine
According to the poverty statistics in East Palestine, males aged 6 to 11 years and females aged under 5 years are the age groups that are most secure financially, with 100.0% of males and 100.0% of females in these age groups living above the poverty line.
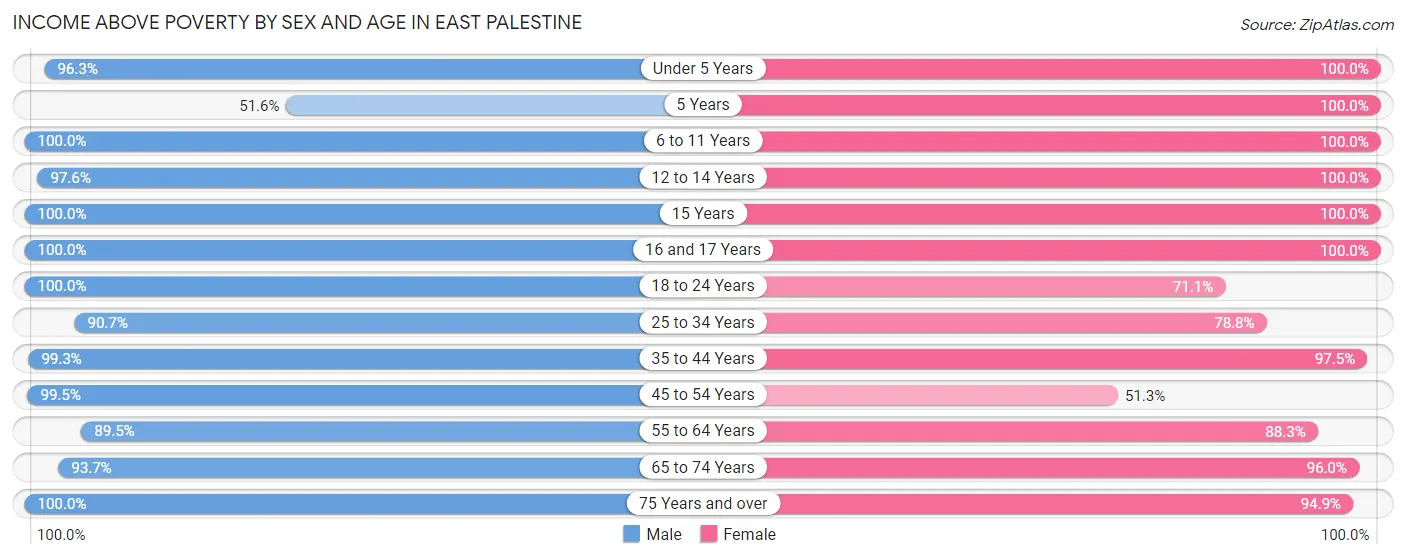
| Age Bracket | Male | Female |
| Under 5 Years | 260 (96.3%) | 121 (100.0%) |
| 5 Years | 16 (51.6%) | 59 (100.0%) |
| 6 to 11 Years | 202 (100.0%) | 148 (100.0%) |
| 12 to 14 Years | 81 (97.6%) | 10 (100.0%) |
| 15 Years | 10 (100.0%) | 7 (100.0%) |
| 16 and 17 Years | 99 (100.0%) | 131 (100.0%) |
| 18 to 24 Years | 110 (100.0%) | 69 (71.1%) |
| 25 to 34 Years | 215 (90.7%) | 275 (78.8%) |
| 35 to 44 Years | 277 (99.3%) | 309 (97.5%) |
| 45 to 54 Years | 181 (99.5%) | 101 (51.3%) |
| 55 to 64 Years | 373 (89.4%) | 264 (88.3%) |
| 65 to 74 Years | 209 (93.7%) | 238 (96.0%) |
| 75 Years and over | 223 (100.0%) | 240 (94.9%) |
| Total | 2,256 (95.4%) | 1,972 (88.2%) |
Income Below Poverty Among Married-Couple Families in East Palestine
The poverty statistics for married-couple families in East Palestine show that 3.2% or 25 of the total 789 families live below the poverty line. Families with no children have the highest poverty rate of 5.0%, comprising of 25 families. On the other hand, families with 1 or 2 children have the lowest poverty rate of 0.0%, which includes 0 families.
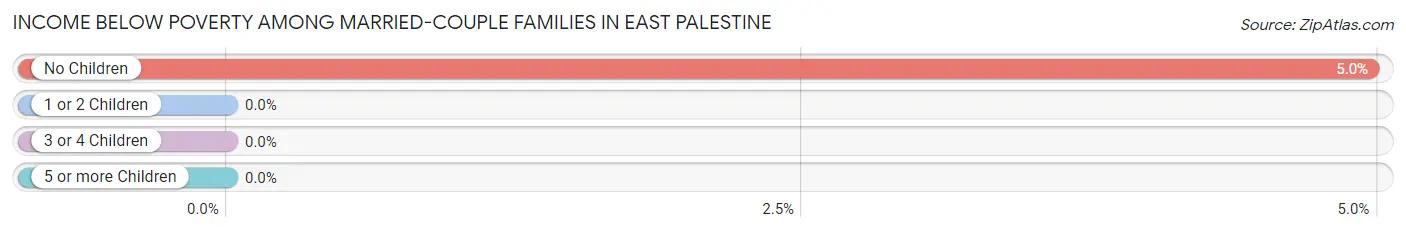
| Children | Above Poverty | Below Poverty |
| No Children | 478 (95.0%) | 25 (5.0%) |
| 1 or 2 Children | 219 (100.0%) | 0 (0.0%) |
| 3 or 4 Children | 67 (100.0%) | 0 (0.0%) |
| 5 or more Children | 0 (0.0%) | 0 (0.0%) |
| Total | 764 (96.8%) | 25 (3.2%) |
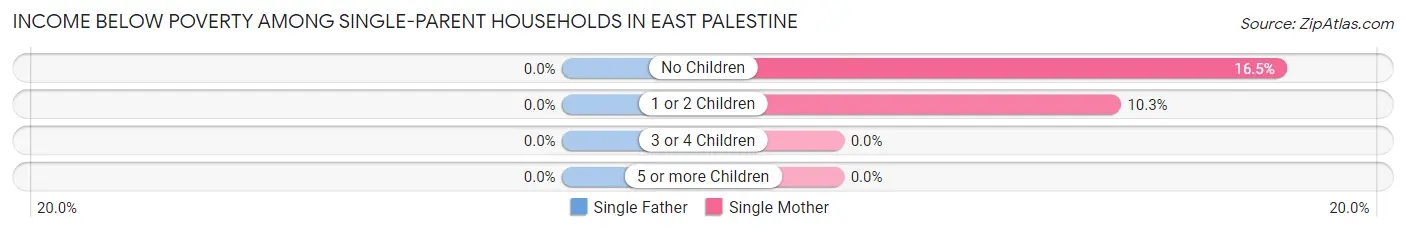
Income Below Poverty Among Single-Parent Households in East Palestine
| Children | Single Father | Single Mother |
| No Children | 0 (0.0%) | 17 (16.5%) |
| 1 or 2 Children | 0 (0.0%) | 20 (10.3%) |
| 3 or 4 Children | 0 (0.0%) | 0 (0.0%) |
| 5 or more Children | 0 (0.0%) | 0 (0.0%) |
| Total | 0 (0.0%) | 37 (12.5%) |
Income Below Poverty Among Married-Couple vs Single-Parent Households in East Palestine
The poverty data for East Palestine shows that 25 of the married-couple family households (3.2%) and 37 of the single-parent households (8.1%) are living below the poverty level. Within the married-couple family households, those with no children have the highest poverty rate, with 25 households (5.0%) falling below the poverty line. Among the single-parent households, those with no children have the highest poverty rate, with 17 household (10.7%) living below poverty.
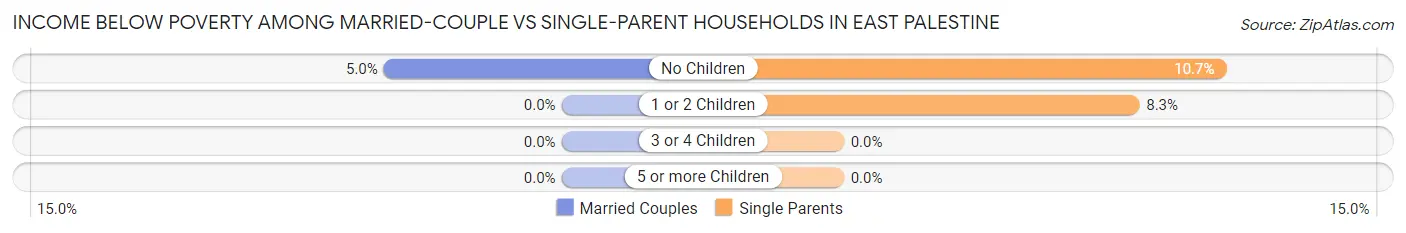
| Children | Married-Couple Families | Single-Parent Households |
| No Children | 25 (5.0%) | 17 (10.7%) |
| 1 or 2 Children | 0 (0.0%) | 20 (8.3%) |
| 3 or 4 Children | 0 (0.0%) | 0 (0.0%) |
| 5 or more Children | 0 (0.0%) | 0 (0.0%) |
| Total | 25 (3.2%) | 37 (8.1%) |
Race in East Palestine
The most populous races in East Palestine are White / Caucasian (4,363 | 92.4%), Hispanic or Latino (424 | 9.0%), and Two or more Races (211 | 4.5%).
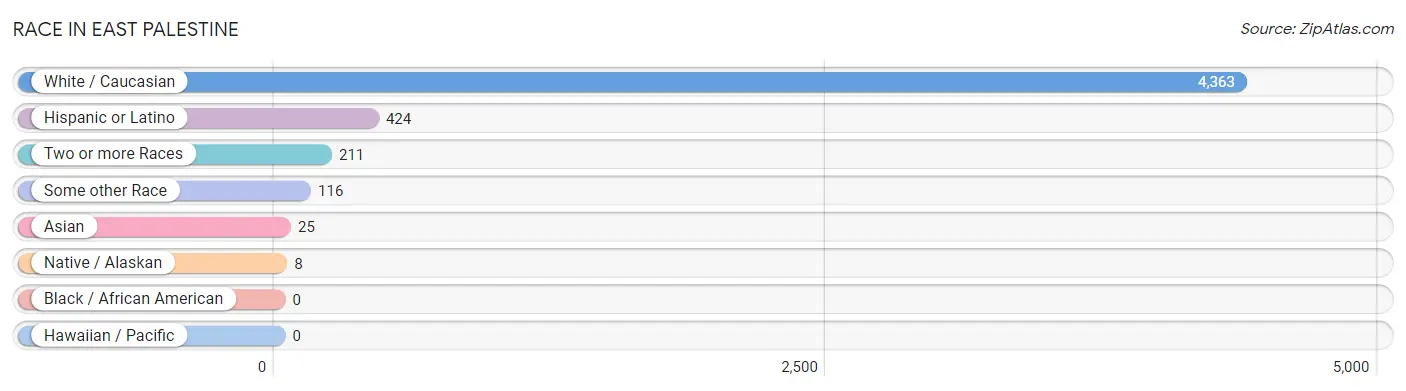
| Race | # Population | % Population |
| Asian | 25 | 0.5% |
| Black / African American | 0 | 0.0% |
| Hawaiian / Pacific | 0 | 0.0% |
| Hispanic or Latino | 424 | 9.0% |
| Native / Alaskan | 8 | 0.2% |
| White / Caucasian | 4,363 | 92.4% |
| Two or more Races | 211 | 4.5% |
| Some other Race | 116 | 2.5% |
| Total | 4,723 | 100.0% |
Ancestry in East Palestine
The most populous ancestries reported in East Palestine are German (1,493 | 31.6%), Irish (1,457 | 30.8%), English (638 | 13.5%), American (416 | 8.8%), and Mexican (399 | 8.5%), together accounting for 93.2% of all East Palestine residents.
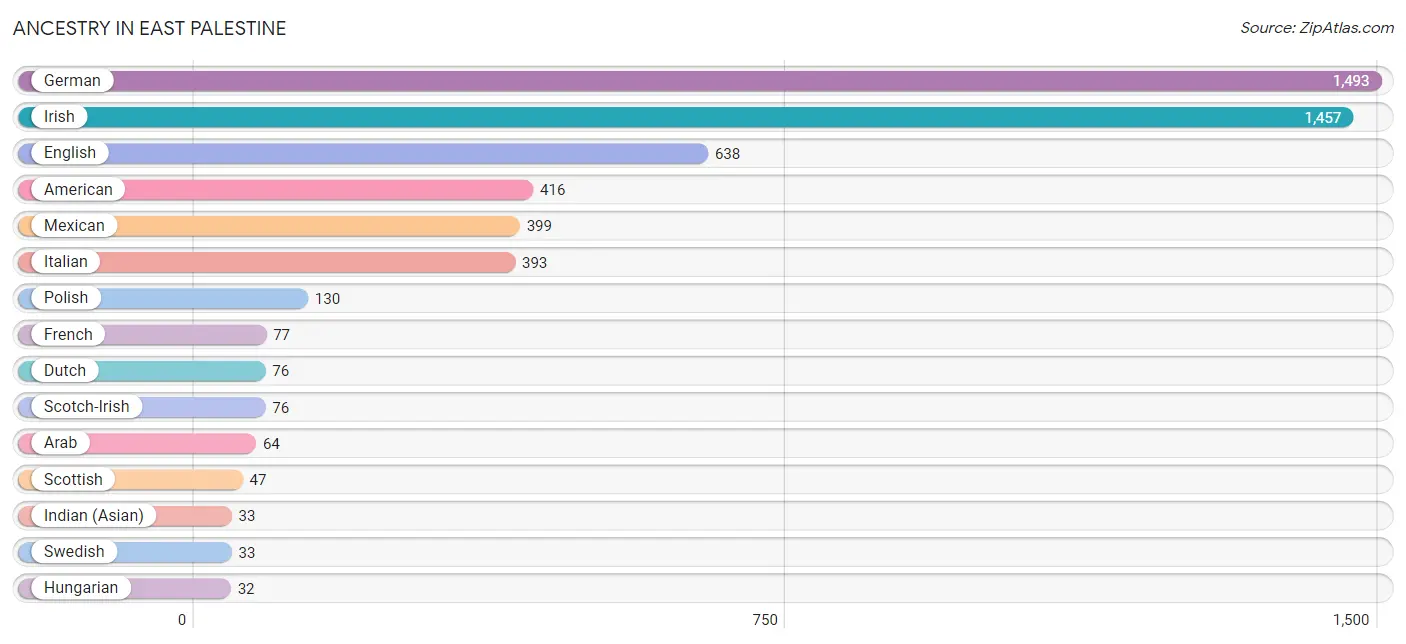
| Ancestry | # Population | % Population |
| American | 416 | 8.8% |
| Arab | 64 | 1.4% |
| Blackfeet | 7 | 0.2% |
| Brazilian | 8 | 0.2% |
| British | 8 | 0.2% |
| Canadian | 14 | 0.3% |
| Carpatho Rusyn | 9 | 0.2% |
| Cherokee | 16 | 0.3% |
| Croatian | 8 | 0.2% |
| Czech | 14 | 0.3% |
| Czechoslovakian | 16 | 0.3% |
| Dutch | 76 | 1.6% |
| English | 638 | 13.5% |
| European | 10 | 0.2% |
| French | 77 | 1.6% |
| German | 1,493 | 31.6% |
| Hungarian | 32 | 0.7% |
| Indian (Asian) | 33 | 0.7% |
| Irish | 1,457 | 30.8% |
| Italian | 393 | 8.3% |
| Korean | 25 | 0.5% |
| Mexican | 399 | 8.5% |
| Northern European | 11 | 0.2% |
| Polish | 130 | 2.8% |
| Scotch-Irish | 76 | 1.6% |
| Scottish | 47 | 1.0% |
| Serbian | 16 | 0.3% |
| Spaniard | 25 | 0.5% |
| Swedish | 33 | 0.7% |
| Ukrainian | 23 | 0.5% |
| Welsh | 22 | 0.5% | View All 31 Rows |
Immigrants in East Palestine
The most numerous immigrant groups reported in East Palestine came from Latin America (73 | 1.5%), Central America (65 | 1.4%), Mexico (65 | 1.4%), Asia (25 | 0.5%), and Philippines (25 | 0.5%), together accounting for 5.4% of all East Palestine residents.
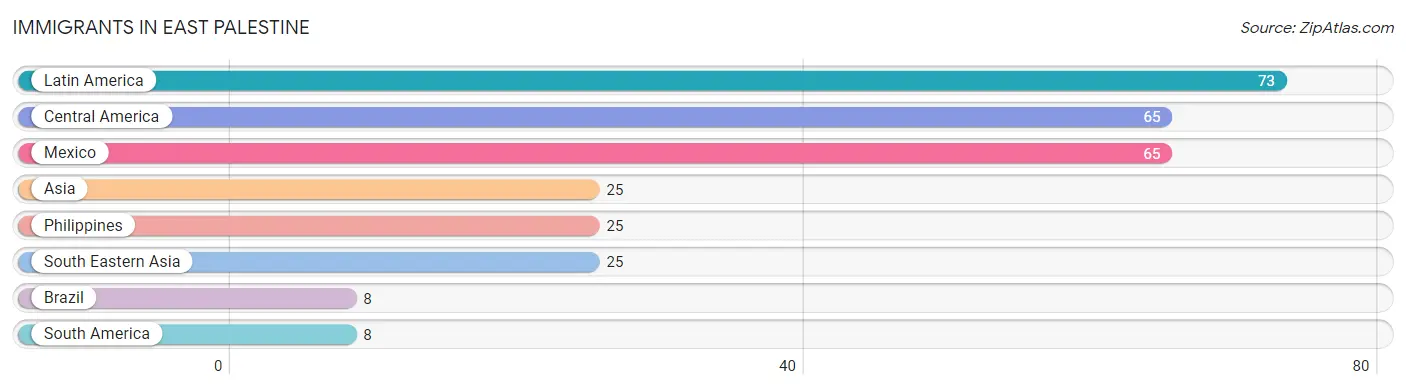
| Immigration Origin | # Population | % Population |
| Asia | 25 | 0.5% |
| Brazil | 8 | 0.2% |
| Central America | 65 | 1.4% |
| Latin America | 73 | 1.5% |
| Mexico | 65 | 1.4% |
| Philippines | 25 | 0.5% |
| South America | 8 | 0.2% |
| South Eastern Asia | 25 | 0.5% | View All 8 Rows |
Sex and Age in East Palestine
Sex and Age in East Palestine
The most populous age groups in East Palestine are Under 5 Years (270 | 11.3%) for men and 40 to 44 Years (208 | 8.9%) for women.
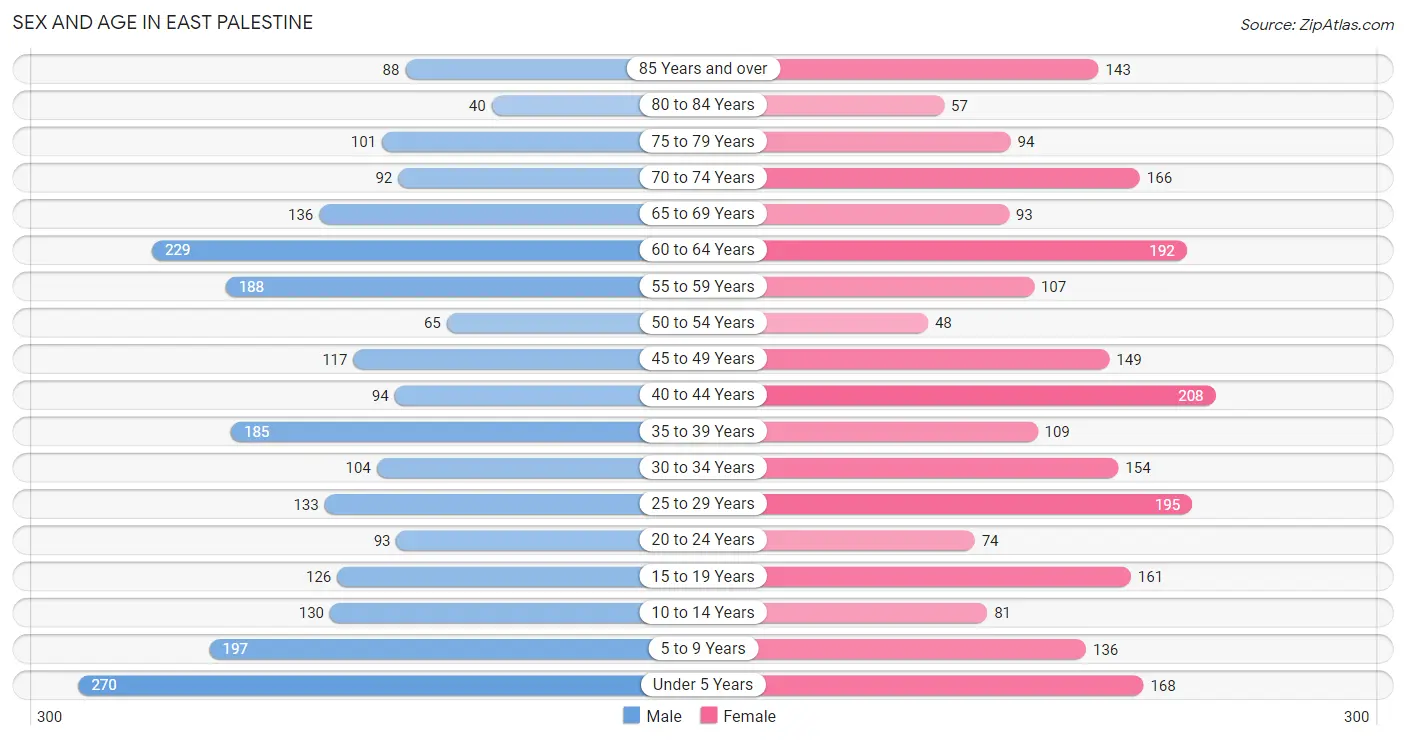
| Age Bracket | Male | Female |
| Under 5 Years | 270 (11.3%) | 168 (7.2%) |
| 5 to 9 Years | 197 (8.3%) | 136 (5.8%) |
| 10 to 14 Years | 130 (5.4%) | 81 (3.5%) |
| 15 to 19 Years | 126 (5.3%) | 161 (6.9%) |
| 20 to 24 Years | 93 (3.9%) | 74 (3.2%) |
| 25 to 29 Years | 133 (5.6%) | 195 (8.4%) |
| 30 to 34 Years | 104 (4.4%) | 154 (6.6%) |
| 35 to 39 Years | 185 (7.7%) | 109 (4.7%) |
| 40 to 44 Years | 94 (3.9%) | 208 (8.9%) |
| 45 to 49 Years | 117 (4.9%) | 149 (6.4%) |
| 50 to 54 Years | 65 (2.7%) | 48 (2.1%) |
| 55 to 59 Years | 188 (7.9%) | 107 (4.6%) |
| 60 to 64 Years | 229 (9.6%) | 192 (8.2%) |
| 65 to 69 Years | 136 (5.7%) | 93 (4.0%) |
| 70 to 74 Years | 92 (3.8%) | 166 (7.1%) |
| 75 to 79 Years | 101 (4.2%) | 94 (4.0%) |
| 80 to 84 Years | 40 (1.7%) | 57 (2.4%) |
| 85 Years and over | 88 (3.7%) | 143 (6.1%) |
| Total | 2,388 (100.0%) | 2,335 (100.0%) |
Families and Households in East Palestine
Median Family Size in East Palestine
The median family size in East Palestine is 2.87 persons per family, with single male/father families (160 | 12.8%) accounting for the largest median family size of 3.76 persons per family. On the other hand, single female/mother families (297 | 23.8%) represent the smallest median family size with 2.59 persons per family.
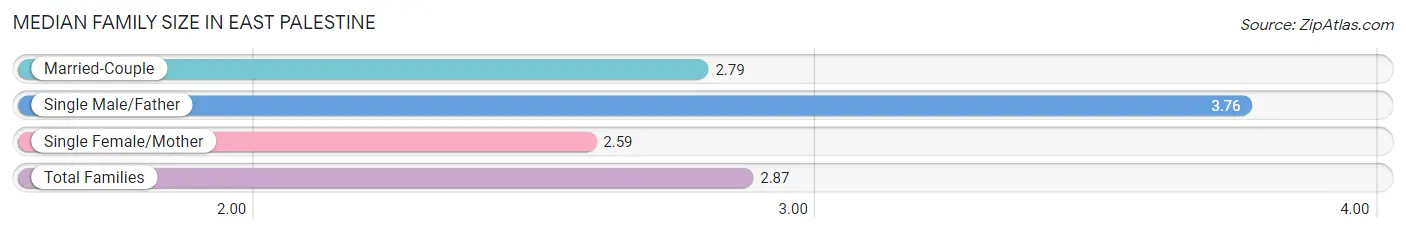
| Family Type | # Families | Family Size |
| Married-Couple | 789 (63.3%) | 2.79 |
| Single Male/Father | 160 (12.8%) | 3.76 |
| Single Female/Mother | 297 (23.8%) | 2.59 |
| Total Families | 1,246 (100.0%) | 2.87 |
Median Household Size in East Palestine
The median household size in East Palestine is 2.35 persons per household, with single male/father households (160 | 8.1%) accounting for the largest median household size of 4.43 persons per household. non-family households (735 | 37.1%) represent the smallest median household size with 1.23 persons per household.
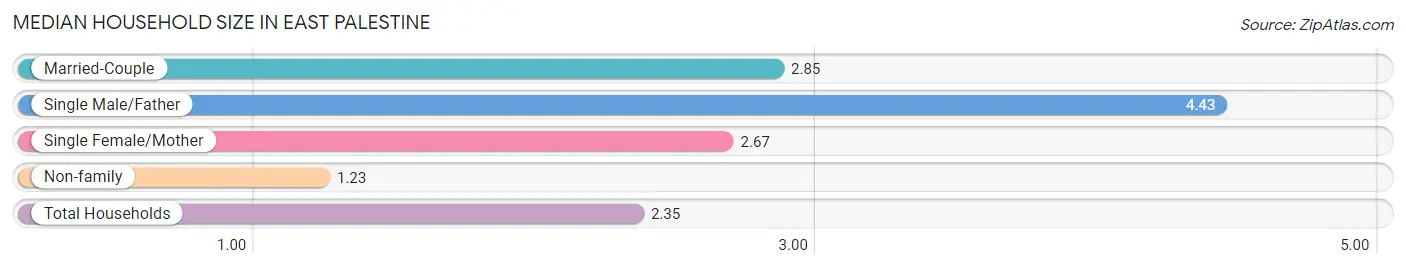
| Household Type | # Households | Household Size |
| Married-Couple | 789 (39.8%) | 2.85 |
| Single Male/Father | 160 (8.1%) | 4.43 |
| Single Female/Mother | 297 (15.0%) | 2.67 |
| Non-family | 735 (37.1%) | 1.23 |
| Total Households | 1,981 (100.0%) | 2.35 |
Household Size by Marriage Status in East Palestine
Out of a total of 1,981 households in East Palestine, 1,246 (62.9%) are family households, while 735 (37.1%) are nonfamily households. The most numerous type of family households are 2-person households, comprising 567, and the most common type of nonfamily households are 1-person households, comprising 601.
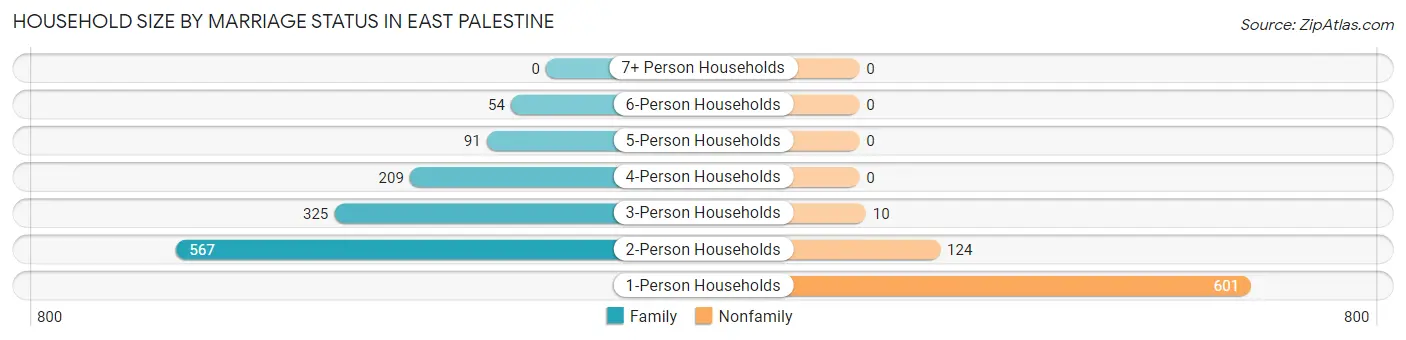
| Household Size | Family Households | Nonfamily Households |
| 1-Person Households | - | 601 (30.3%) |
| 2-Person Households | 567 (28.6%) | 124 (6.3%) |
| 3-Person Households | 325 (16.4%) | 10 (0.5%) |
| 4-Person Households | 209 (10.5%) | 0 (0.0%) |
| 5-Person Households | 91 (4.6%) | 0 (0.0%) |
| 6-Person Households | 54 (2.7%) | 0 (0.0%) |
| 7+ Person Households | 0 (0.0%) | 0 (0.0%) |
| Total | 1,246 (62.9%) | 735 (37.1%) |
Female Fertility in East Palestine
Fertility by Age in East Palestine
Average fertility rate in East Palestine is 119.0 births per 1,000 women. Women in the age bracket of 20 to 34 years have the highest fertility rate with 298.0 births per 1,000 women. Women in the age bracket of 20 to 34 years acount for 100.0% of all women with births.
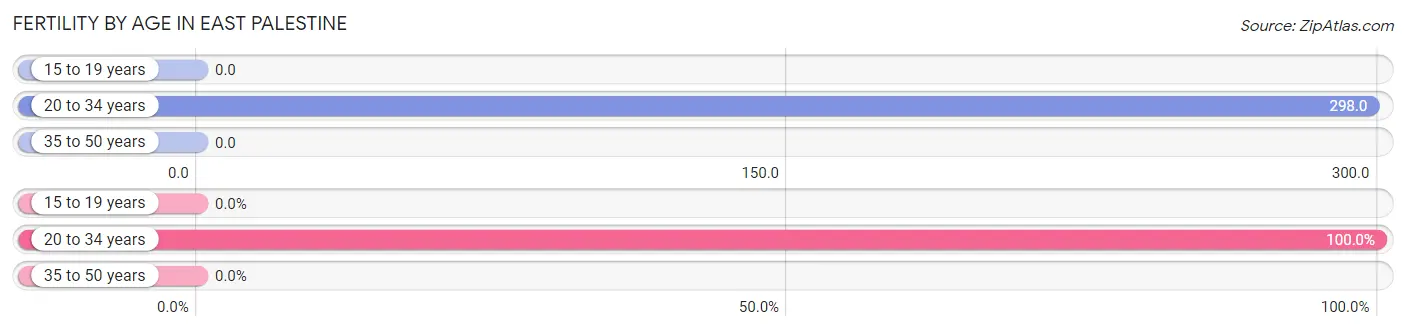
| Age Bracket | Women with Births | Births / 1,000 Women |
| 15 to 19 years | 0 (0.0%) | 0.0 |
| 20 to 34 years | 126 (100.0%) | 298.0 |
| 35 to 50 years | 0 (0.0%) | 0.0 |
| Total | 126 (100.0%) | 119.0 |
Fertility by Age by Marriage Status in East Palestine
68.3% of women with births (126) in East Palestine are married. The highest percentage of unmarried women with births falls into 20 to 34 years age bracket with 31.8% of them unmarried at the time of birth, while the lowest percentage of unmarried women with births belong to 20 to 34 years age bracket with 31.8% of them unmarried.
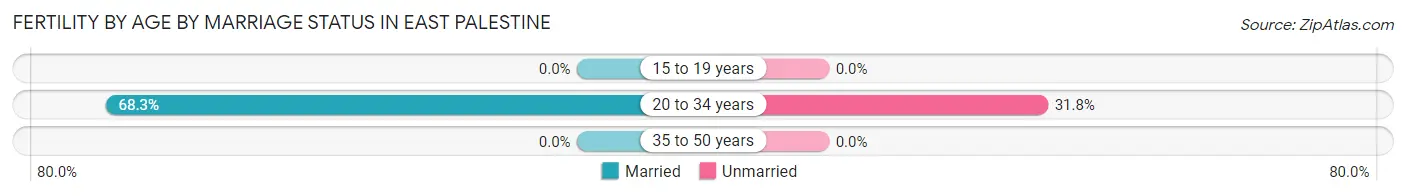
| Age Bracket | Married | Unmarried |
| 15 to 19 years | 0 (0.0%) | 0 (0.0%) |
| 20 to 34 years | 86 (68.2%) | 40 (31.8%) |
| 35 to 50 years | 0 (0.0%) | 0 (0.0%) |
| Total | 86 (68.2%) | 40 (31.8%) |
Fertility by Education in East Palestine
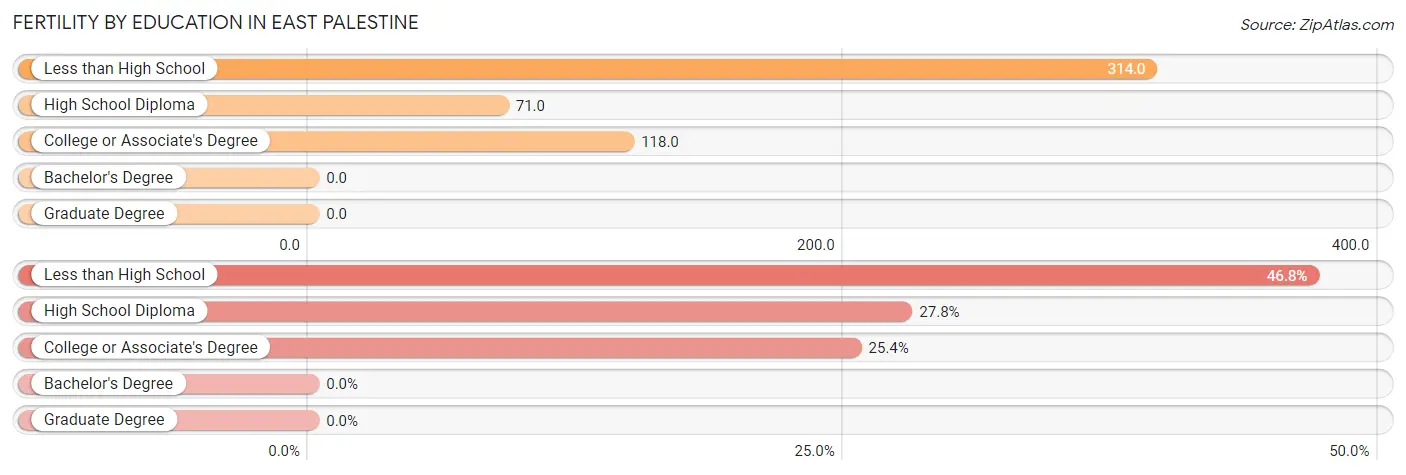
| Educational Attainment | Women with Births | Births / 1,000 Women |
| Less than High School | 59 (46.8%) | 314.0 |
| High School Diploma | 35 (27.8%) | 71.0 |
| College or Associate's Degree | 32 (25.4%) | 118.0 |
| Bachelor's Degree | 0 (0.0%) | 0.0 |
| Graduate Degree | 0 (0.0%) | 0.0 |
| Total | 126 (100.0%) | 119.0 |
Fertility by Education by Marriage Status in East Palestine
31.8% of women with births in East Palestine are unmarried. Women with the educational attainment of high school diploma are most likely to be married with 100.0% of them married at childbirth, while women with the educational attainment of less than high school are least likely to be married with 67.8% of them unmarried at childbirth.
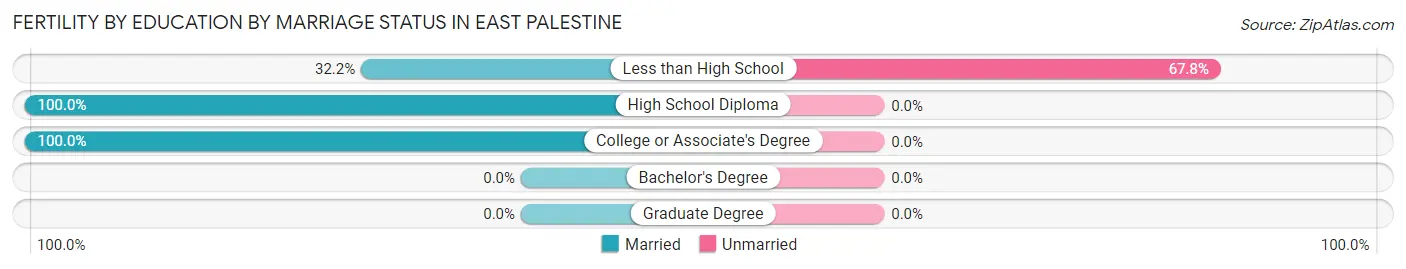
| Educational Attainment | Married | Unmarried |
| Less than High School | 19 (32.2%) | 40 (67.8%) |
| High School Diploma | 35 (100.0%) | 0 (0.0%) |
| College or Associate's Degree | 32 (100.0%) | 0 (0.0%) |
| Bachelor's Degree | 0 (0.0%) | 0 (0.0%) |
| Graduate Degree | 0 (0.0%) | 0 (0.0%) |
| Total | 86 (68.2%) | 40 (31.8%) |
Employment Characteristics in East Palestine
Employment by Class of Employer in East Palestine
Among the 2,061 employed individuals in East Palestine, private company employees (1,545 | 75.0%), local government employees (223 | 10.8%), and not-for-profit organizations (103 | 5.0%) make up the most common classes of employment.
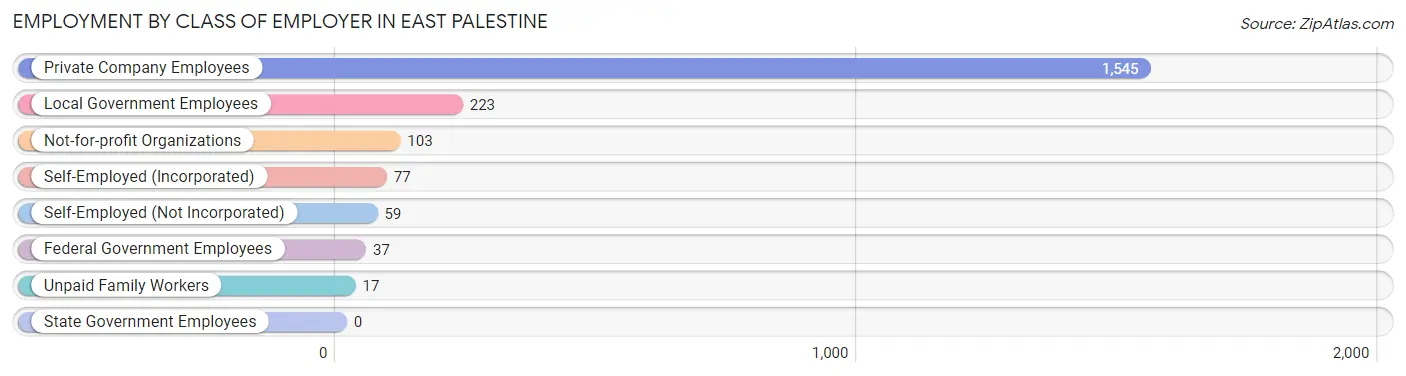
| Employer Class | # Employees | % Employees |
| Private Company Employees | 1,545 | 75.0% |
| Self-Employed (Incorporated) | 77 | 3.7% |
| Self-Employed (Not Incorporated) | 59 | 2.9% |
| Not-for-profit Organizations | 103 | 5.0% |
| Local Government Employees | 223 | 10.8% |
| State Government Employees | 0 | 0.0% |
| Federal Government Employees | 37 | 1.8% |
| Unpaid Family Workers | 17 | 0.8% |
| Total | 2,061 | 100.0% |
Employment Status by Age in East Palestine
According to the labor force statistics for East Palestine, out of the total population over 16 years of age (3,724), 58.3% or 2,171 individuals are in the labor force, with 3.7% or 80 of them unemployed. The age group with the highest labor force participation rate is 25 to 29 years, with 92.1% or 302 individuals in the labor force. Within the labor force, the 25 to 29 years age range has the highest percentage of unemployed individuals, with 8.9% or 27 of them being unemployed.
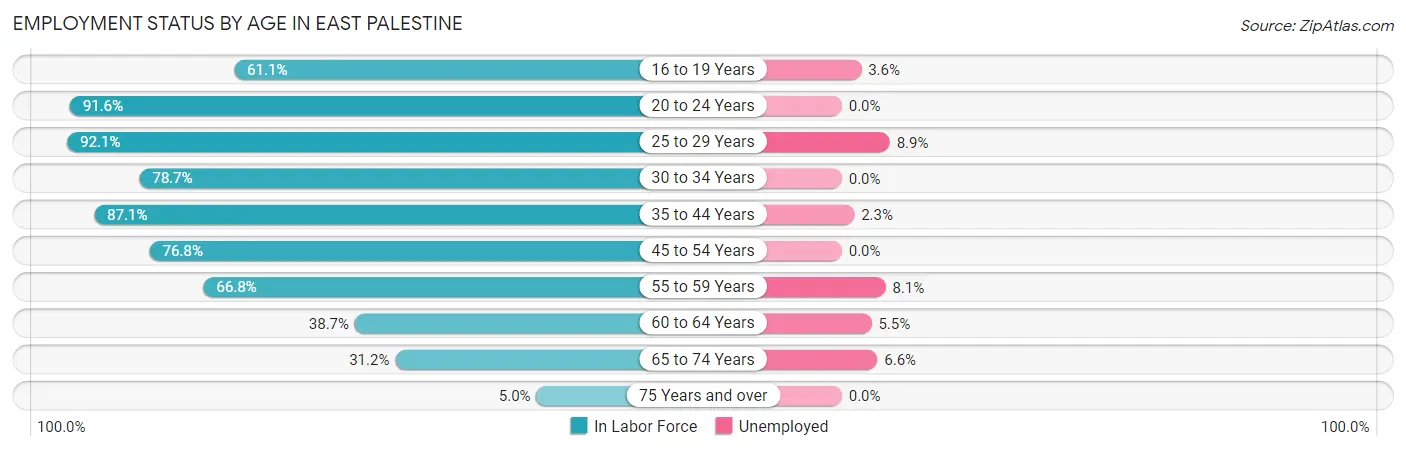
| Age Bracket | In Labor Force | Unemployed |
| 16 to 19 Years | 165 (61.1%) | 6 (3.6%) |
| 20 to 24 Years | 153 (91.6%) | 0 (0.0%) |
| 25 to 29 Years | 302 (92.1%) | 27 (8.9%) |
| 30 to 34 Years | 203 (78.7%) | 0 (0.0%) |
| 35 to 44 Years | 519 (87.1%) | 12 (2.3%) |
| 45 to 54 Years | 291 (76.8%) | 0 (0.0%) |
| 55 to 59 Years | 197 (66.8%) | 16 (8.1%) |
| 60 to 64 Years | 163 (38.7%) | 9 (5.5%) |
| 65 to 74 Years | 152 (31.2%) | 10 (6.6%) |
| 75 Years and over | 26 (5.0%) | 0 (0.0%) |
| Total | 2,171 (58.3%) | 80 (3.7%) |
Employment Status by Educational Attainment in East Palestine
According to labor force statistics for East Palestine, 73.6% of individuals (1,676) out of the total population between 25 and 64 years of age (2,277) are in the labor force, with 3.8% or 64 of them being unemployed. The group with the highest labor force participation rate are those with the educational attainment of high school diploma, with 80.1% or 833 individuals in the labor force. Within the labor force, individuals with less than high school education have the highest percentage of unemployment, with 13.5% or 27 of them being unemployed.
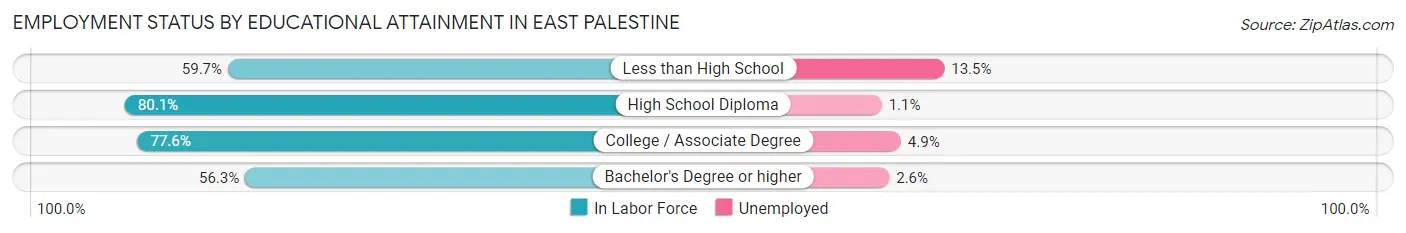
| Educational Attainment | In Labor Force | Unemployed |
| Less than High School | 200 (59.7%) | 45 (13.5%) |
| High School Diploma | 833 (80.1%) | 11 (1.1%) |
| College / Associate Degree | 489 (77.6%) | 31 (4.9%) |
| Bachelor's Degree or higher | 153 (56.3%) | 7 (2.6%) |
| Total | 1,676 (73.6%) | 87 (3.8%) |
Employment Occupations by Sex in East Palestine
Management, Business, Science and Arts Occupations
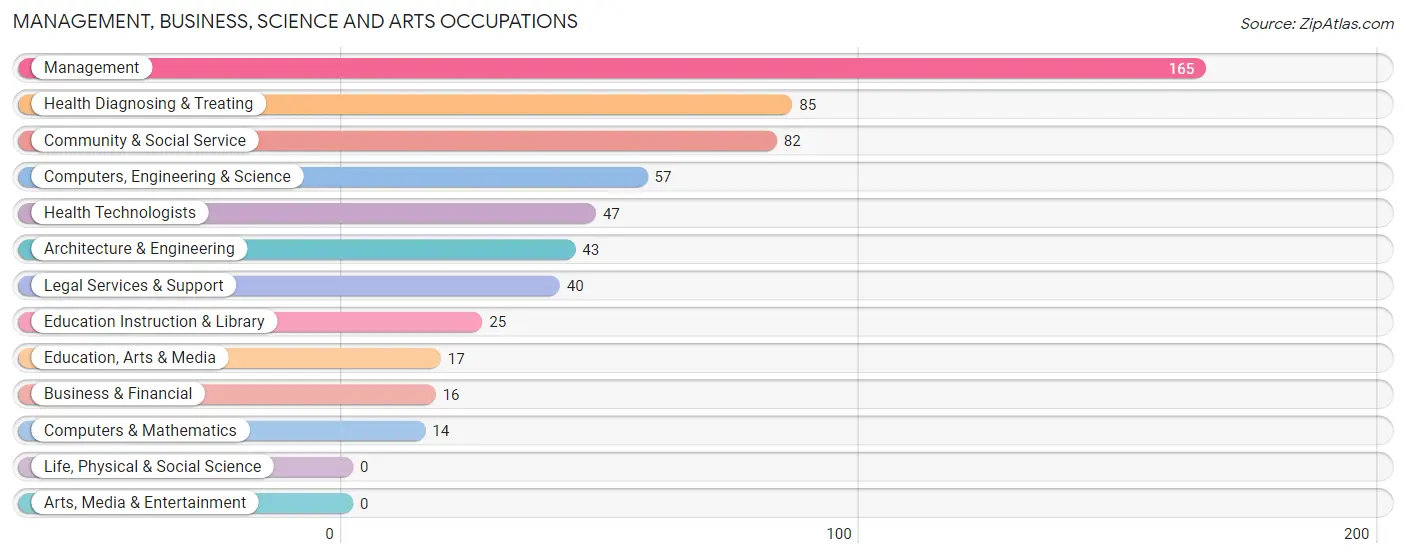
The most common Management, Business, Science and Arts occupations in East Palestine are Management (165 | 7.9%), Health Diagnosing & Treating (85 | 4.1%), Community & Social Service (82 | 3.9%), Computers, Engineering & Science (57 | 2.7%), and Health Technologists (47 | 2.2%).
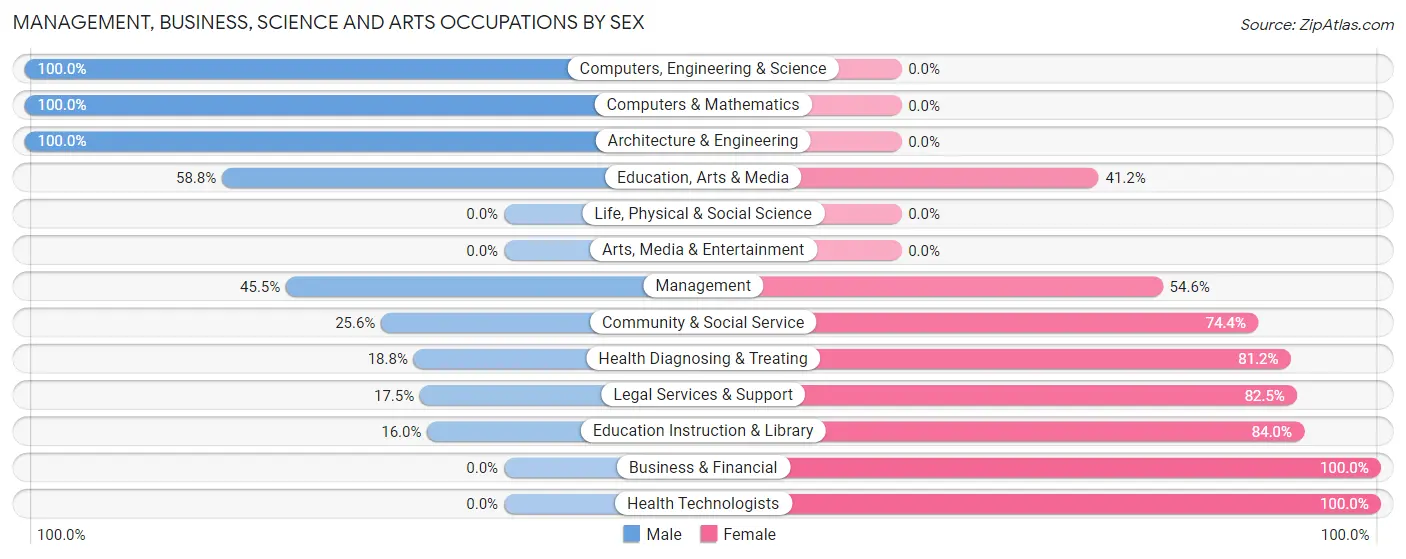
Management, Business, Science and Arts Occupations by Sex
Within the Management, Business, Science and Arts occupations in East Palestine, the most male-oriented occupations are Computers, Engineering & Science (100.0%), Computers & Mathematics (100.0%), and Architecture & Engineering (100.0%), while the most female-oriented occupations are Business & Financial (100.0%), Health Technologists (100.0%), and Education Instruction & Library (84.0%).
| Occupation | Male | Female |
| Management | 75 (45.5%) | 90 (54.5%) |
| Business & Financial | 0 (0.0%) | 16 (100.0%) |
| Computers, Engineering & Science | 57 (100.0%) | 0 (0.0%) |
| Computers & Mathematics | 14 (100.0%) | 0 (0.0%) |
| Architecture & Engineering | 43 (100.0%) | 0 (0.0%) |
| Life, Physical & Social Science | 0 (0.0%) | 0 (0.0%) |
| Community & Social Service | 21 (25.6%) | 61 (74.4%) |
| Education, Arts & Media | 10 (58.8%) | 7 (41.2%) |
| Legal Services & Support | 7 (17.5%) | 33 (82.5%) |
| Education Instruction & Library | 4 (16.0%) | 21 (84.0%) |
| Arts, Media & Entertainment | 0 (0.0%) | 0 (0.0%) |
| Health Diagnosing & Treating | 16 (18.8%) | 69 (81.2%) |
| Health Technologists | 0 (0.0%) | 47 (100.0%) |
| Total (Category) | 169 (41.7%) | 236 (58.3%) |
| Total (Overall) | 1,031 (49.3%) | 1,060 (50.7%) |
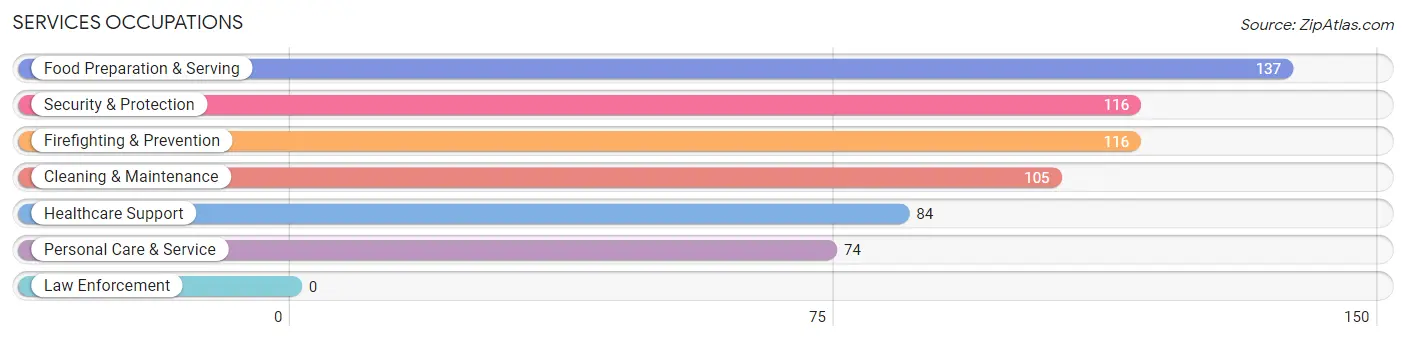
Services Occupations
The most common Services occupations in East Palestine are Food Preparation & Serving (137 | 6.6%), Security & Protection (116 | 5.6%), Firefighting & Prevention (116 | 5.6%), Cleaning & Maintenance (105 | 5.0%), and Healthcare Support (84 | 4.0%).
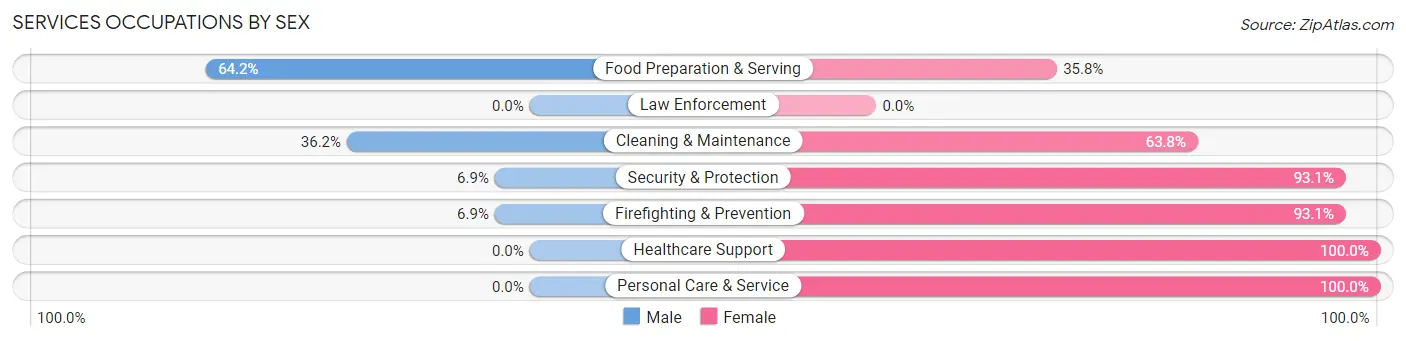
Services Occupations by Sex
Within the Services occupations in East Palestine, the most male-oriented occupations are Food Preparation & Serving (64.2%), Cleaning & Maintenance (36.2%), and Security & Protection (6.9%), while the most female-oriented occupations are Healthcare Support (100.0%), Personal Care & Service (100.0%), and Security & Protection (93.1%).
| Occupation | Male | Female |
| Healthcare Support | 0 (0.0%) | 84 (100.0%) |
| Security & Protection | 8 (6.9%) | 108 (93.1%) |
| Firefighting & Prevention | 8 (6.9%) | 108 (93.1%) |
| Law Enforcement | 0 (0.0%) | 0 (0.0%) |
| Food Preparation & Serving | 88 (64.2%) | 49 (35.8%) |
| Cleaning & Maintenance | 38 (36.2%) | 67 (63.8%) |
| Personal Care & Service | 0 (0.0%) | 74 (100.0%) |
| Total (Category) | 134 (26.0%) | 382 (74.0%) |
| Total (Overall) | 1,031 (49.3%) | 1,060 (50.7%) |
Sales and Office Occupations
The most common Sales and Office occupations in East Palestine are Office & Administration (289 | 13.8%), and Sales & Related (253 | 12.1%).

Sales and Office Occupations by Sex
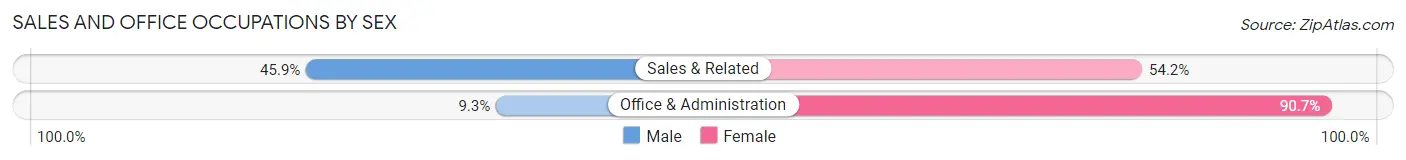
| Occupation | Male | Female |
| Sales & Related | 116 (45.9%) | 137 (54.1%) |
| Office & Administration | 27 (9.3%) | 262 (90.7%) |
| Total (Category) | 143 (26.4%) | 399 (73.6%) |
| Total (Overall) | 1,031 (49.3%) | 1,060 (50.7%) |
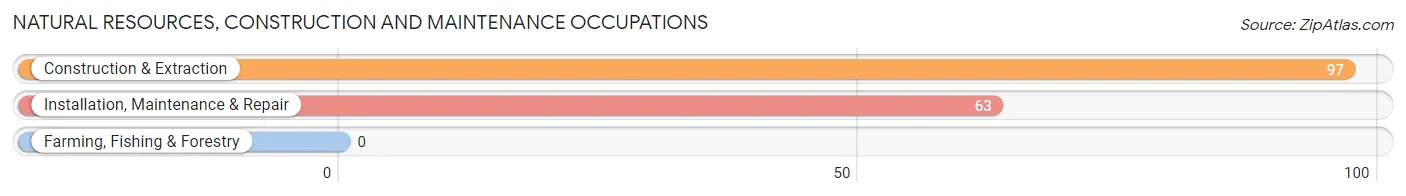
Natural Resources, Construction and Maintenance Occupations
The most common Natural Resources, Construction and Maintenance occupations in East Palestine are Construction & Extraction (97 | 4.6%), and Installation, Maintenance & Repair (63 | 3.0%).
Natural Resources, Construction and Maintenance Occupations by Sex
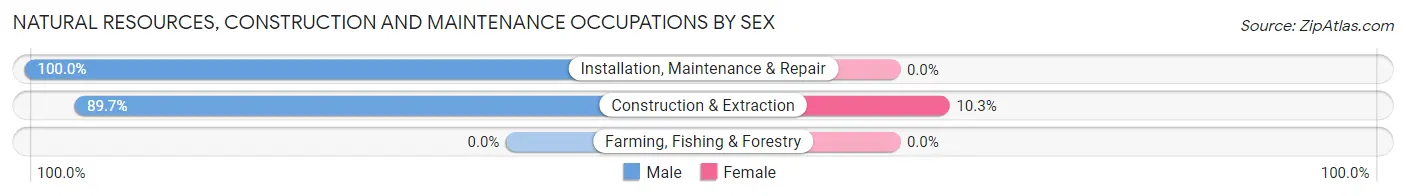
| Occupation | Male | Female |
| Farming, Fishing & Forestry | 0 (0.0%) | 0 (0.0%) |
| Construction & Extraction | 87 (89.7%) | 10 (10.3%) |
| Installation, Maintenance & Repair | 63 (100.0%) | 0 (0.0%) |
| Total (Category) | 150 (93.8%) | 10 (6.2%) |
| Total (Overall) | 1,031 (49.3%) | 1,060 (50.7%) |
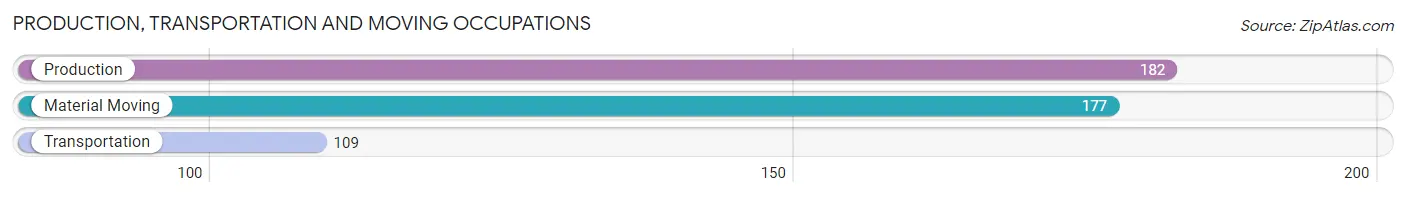
Production, Transportation and Moving Occupations
The most common Production, Transportation and Moving occupations in East Palestine are Production (182 | 8.7%), Material Moving (177 | 8.5%), and Transportation (109 | 5.2%).
Production, Transportation and Moving Occupations by Sex
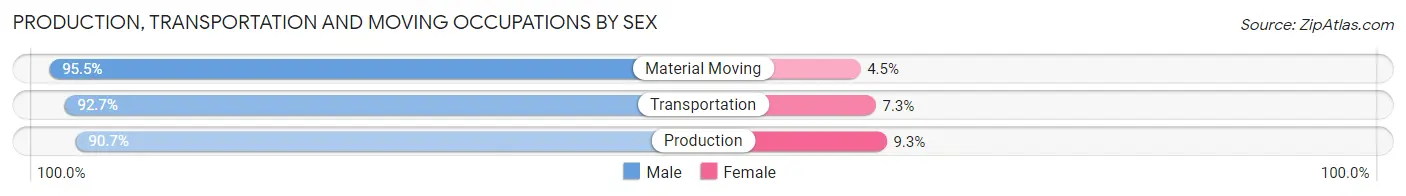
| Occupation | Male | Female |
| Production | 165 (90.7%) | 17 (9.3%) |
| Transportation | 101 (92.7%) | 8 (7.3%) |
| Material Moving | 169 (95.5%) | 8 (4.5%) |
| Total (Category) | 435 (92.9%) | 33 (7.0%) |
| Total (Overall) | 1,031 (49.3%) | 1,060 (50.7%) |
Employment Industries by Sex in East Palestine
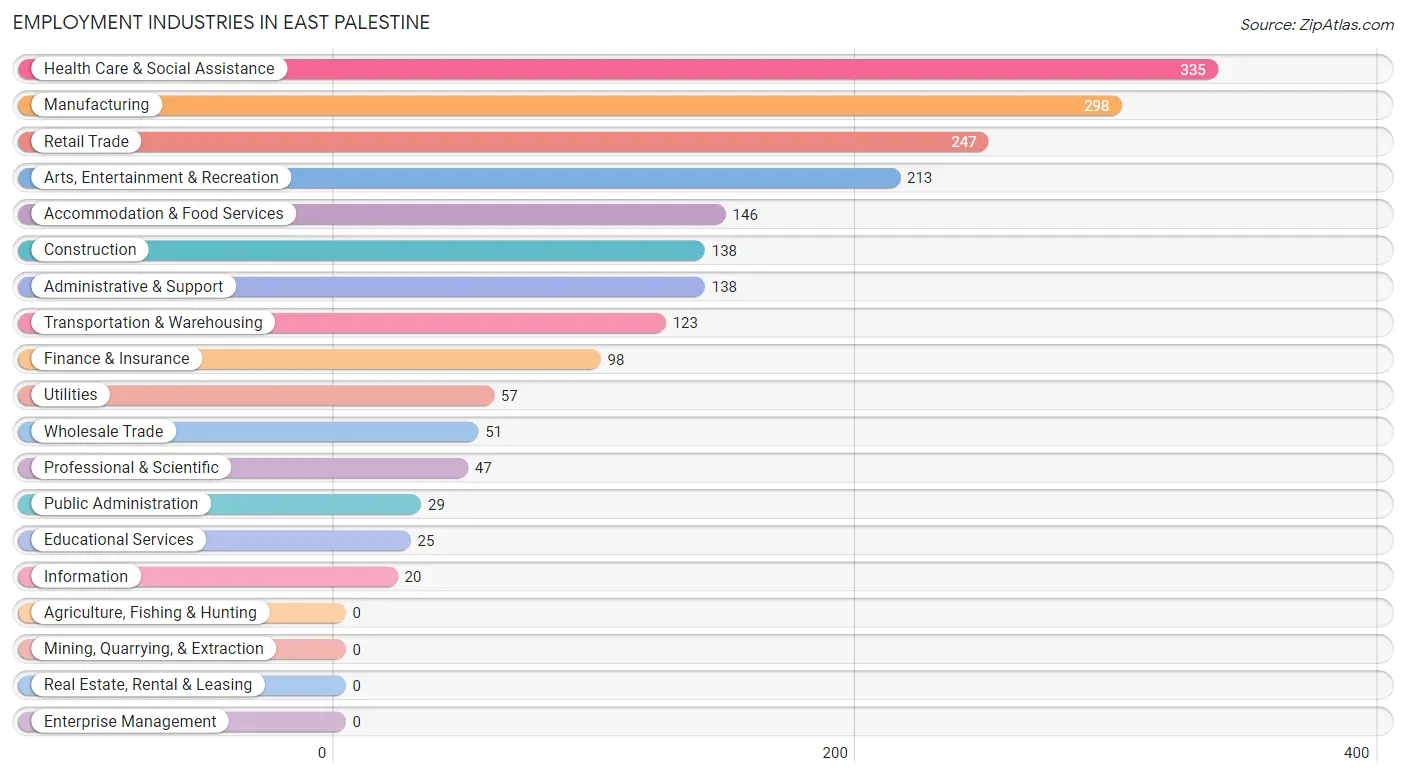
Employment Industries in East Palestine
The major employment industries in East Palestine include Health Care & Social Assistance (335 | 16.0%), Manufacturing (298 | 14.2%), Retail Trade (247 | 11.8%), Arts, Entertainment & Recreation (213 | 10.2%), and Accommodation & Food Services (146 | 7.0%).
Employment Industries by Sex in East Palestine
The East Palestine industries that see more men than women are Utilities (100.0%), Information (100.0%), and Public Administration (100.0%), whereas the industries that tend to have a higher number of women are Finance & Insurance (100.0%), Arts, Entertainment & Recreation (96.2%), and Health Care & Social Assistance (92.2%).
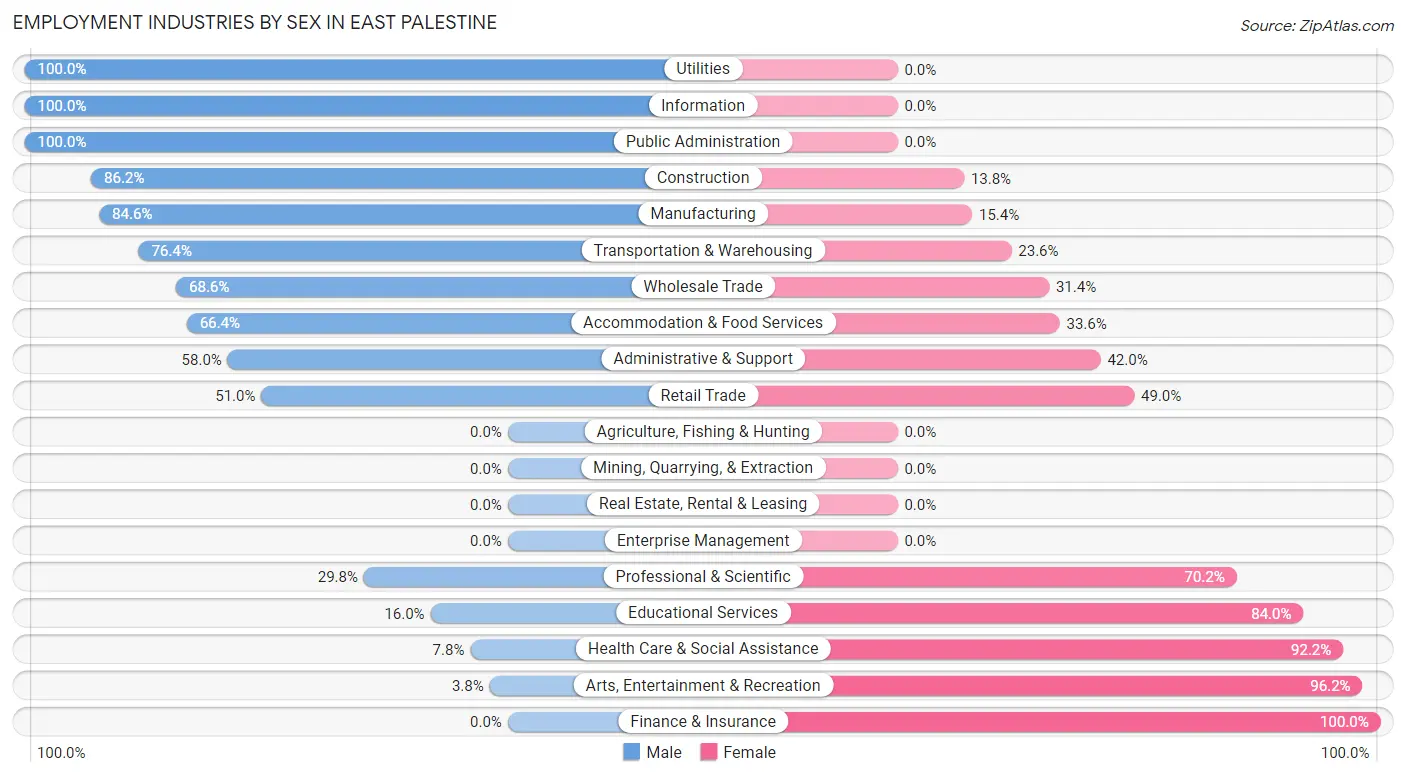
| Industry | Male | Female |
| Agriculture, Fishing & Hunting | 0 (0.0%) | 0 (0.0%) |
| Mining, Quarrying, & Extraction | 0 (0.0%) | 0 (0.0%) |
| Construction | 119 (86.2%) | 19 (13.8%) |
| Manufacturing | 252 (84.6%) | 46 (15.4%) |
| Wholesale Trade | 35 (68.6%) | 16 (31.4%) |
| Retail Trade | 126 (51.0%) | 121 (49.0%) |
| Transportation & Warehousing | 94 (76.4%) | 29 (23.6%) |
| Utilities | 57 (100.0%) | 0 (0.0%) |
| Information | 20 (100.0%) | 0 (0.0%) |
| Finance & Insurance | 0 (0.0%) | 98 (100.0%) |
| Real Estate, Rental & Leasing | 0 (0.0%) | 0 (0.0%) |
| Professional & Scientific | 14 (29.8%) | 33 (70.2%) |
| Enterprise Management | 0 (0.0%) | 0 (0.0%) |
| Administrative & Support | 80 (58.0%) | 58 (42.0%) |
| Educational Services | 4 (16.0%) | 21 (84.0%) |
| Health Care & Social Assistance | 26 (7.8%) | 309 (92.2%) |
| Arts, Entertainment & Recreation | 8 (3.8%) | 205 (96.2%) |
| Accommodation & Food Services | 97 (66.4%) | 49 (33.6%) |
| Public Administration | 29 (100.0%) | 0 (0.0%) |
| Total | 1,031 (49.3%) | 1,060 (50.7%) |
Education in East Palestine
School Enrollment in East Palestine
The most common levels of schooling among the 860 students in East Palestine are elementary school (276 | 32.1%), high school (178 | 20.7%), and nursery / preschool (163 | 19.0%).
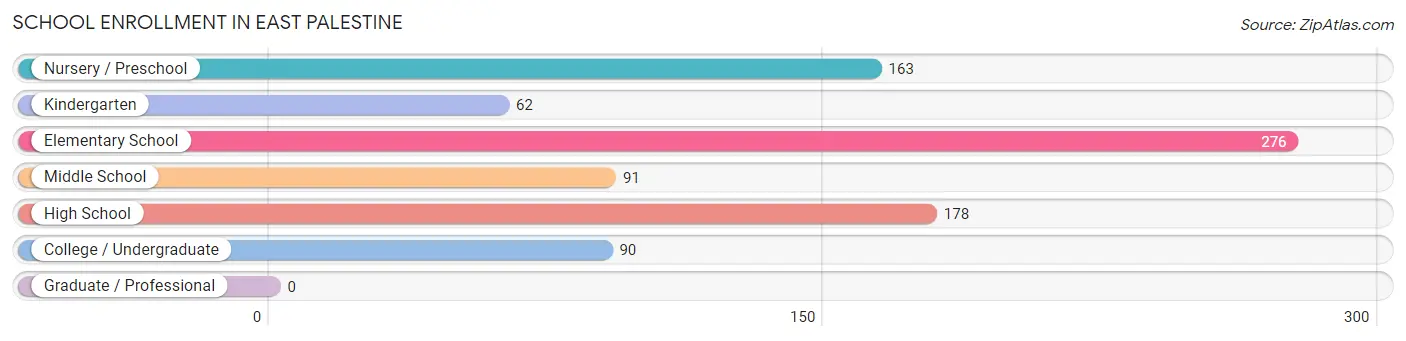
| School Level | # Students | % Students |
| Nursery / Preschool | 163 | 19.0% |
| Kindergarten | 62 | 7.2% |
| Elementary School | 276 | 32.1% |
| Middle School | 91 | 10.6% |
| High School | 178 | 20.7% |
| College / Undergraduate | 90 | 10.5% |
| Graduate / Professional | 0 | 0.0% |
| Total | 860 | 100.0% |
School Enrollment by Age by Funding Source in East Palestine
Out of a total of 860 students who are enrolled in schools in East Palestine, 23 (2.7%) attend a private institution, while the remaining 837 (97.3%) are enrolled in public schools. The age group of 10 to 14 year olds has the highest likelihood of being enrolled in private schools, with 13 (6.2% in the age bracket) enrolled. Conversely, the age group of 3 to 4 year olds has the lowest likelihood of being enrolled in a private school, with 136 (100.0% in the age bracket) attending a public institution.
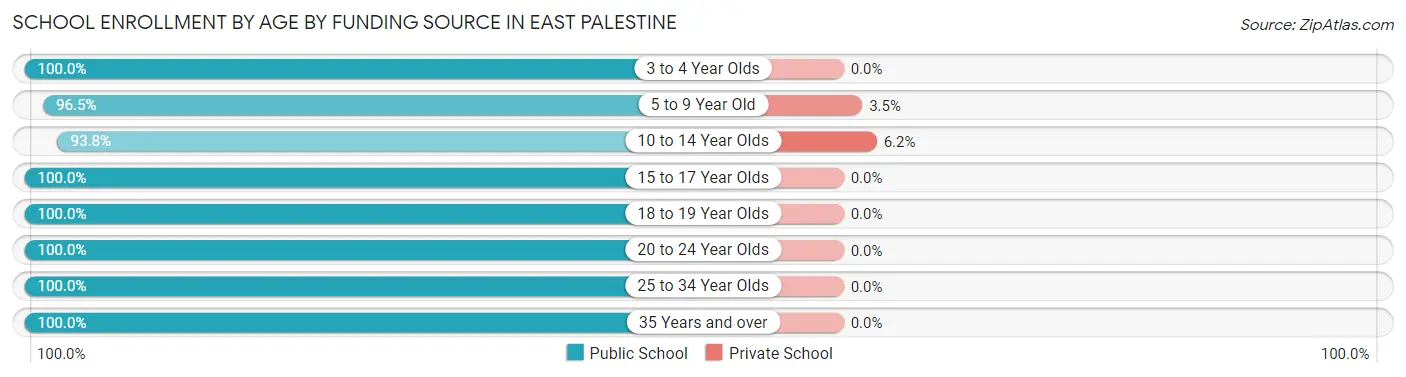
| Age Bracket | Public School | Private School |
| 3 to 4 Year Olds | 136 (100.0%) | 0 (0.0%) |
| 5 to 9 Year Old | 279 (96.5%) | 10 (3.5%) |
| 10 to 14 Year Olds | 198 (93.8%) | 13 (6.2%) |
| 15 to 17 Year Olds | 128 (100.0%) | 0 (0.0%) |
| 18 to 19 Year Olds | 8 (100.0%) | 0 (0.0%) |
| 20 to 24 Year Olds | 12 (100.0%) | 0 (0.0%) |
| 25 to 34 Year Olds | 70 (100.0%) | 0 (0.0%) |
| 35 Years and over | 6 (100.0%) | 0 (0.0%) |
| Total | 837 (97.3%) | 23 (2.7%) |
Educational Attainment by Field of Study in East Palestine
Business (173 | 49.4%), science & technology (55 | 15.7%), education (45 | 12.9%), psychology (22 | 6.3%), and visual & performing arts (12 | 3.4%) are the most common fields of study among 350 individuals in East Palestine who have obtained a bachelor's degree or higher.
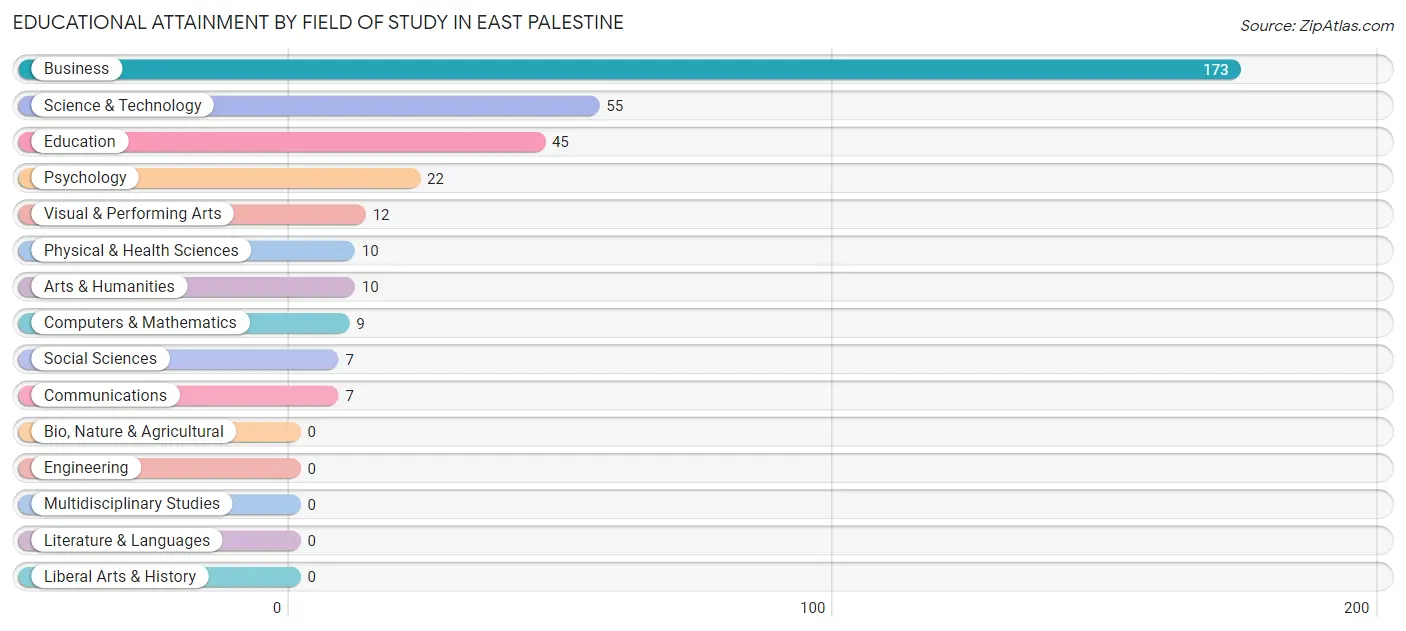
| Field of Study | # Graduates | % Graduates |
| Computers & Mathematics | 9 | 2.6% |
| Bio, Nature & Agricultural | 0 | 0.0% |
| Physical & Health Sciences | 10 | 2.9% |
| Psychology | 22 | 6.3% |
| Social Sciences | 7 | 2.0% |
| Engineering | 0 | 0.0% |
| Multidisciplinary Studies | 0 | 0.0% |
| Science & Technology | 55 | 15.7% |
| Business | 173 | 49.4% |
| Education | 45 | 12.9% |
| Literature & Languages | 0 | 0.0% |
| Liberal Arts & History | 0 | 0.0% |
| Visual & Performing Arts | 12 | 3.4% |
| Communications | 7 | 2.0% |
| Arts & Humanities | 10 | 2.9% |
| Total | 350 | 100.0% |
Transportation & Commute in East Palestine
Vehicle Availability by Sex in East Palestine
The most prevalent vehicle ownership categories in East Palestine are males with 2 vehicles (422, accounting for 42.0%) and females with 2 vehicles (468, making up 40.1%).
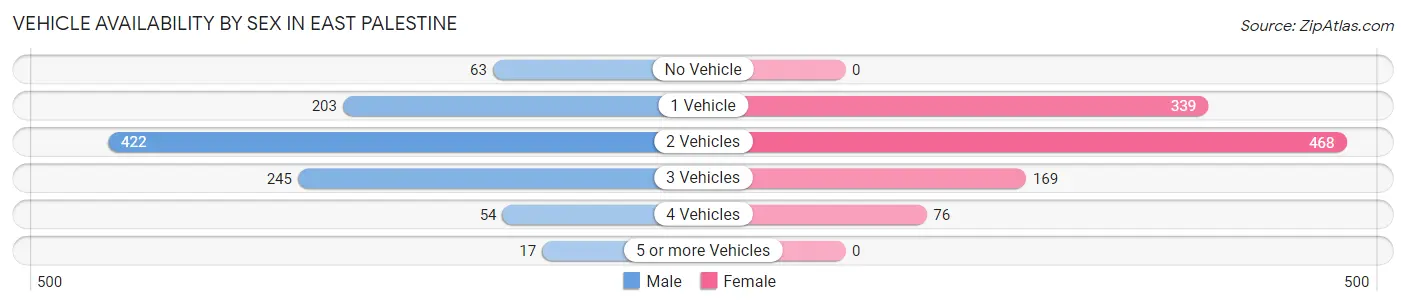
| Vehicles Available | Male | Female |
| No Vehicle | 63 (6.3%) | 0 (0.0%) |
| 1 Vehicle | 203 (20.2%) | 339 (32.2%) |
| 2 Vehicles | 422 (42.0%) | 468 (44.5%) |
| 3 Vehicles | 245 (24.4%) | 169 (16.1%) |
| 4 Vehicles | 54 (5.4%) | 76 (7.2%) |
| 5 or more Vehicles | 17 (1.7%) | 0 (0.0%) |
| Total | 1,004 (100.0%) | 1,052 (100.0%) |
Commute Time in East Palestine
The most frequently occuring commute durations in East Palestine are 15 to 19 minutes (372 commuters, 19.8%), less than 5 minutes (352 commuters, 18.7%), and 30 to 34 minutes (264 commuters, 14.0%).
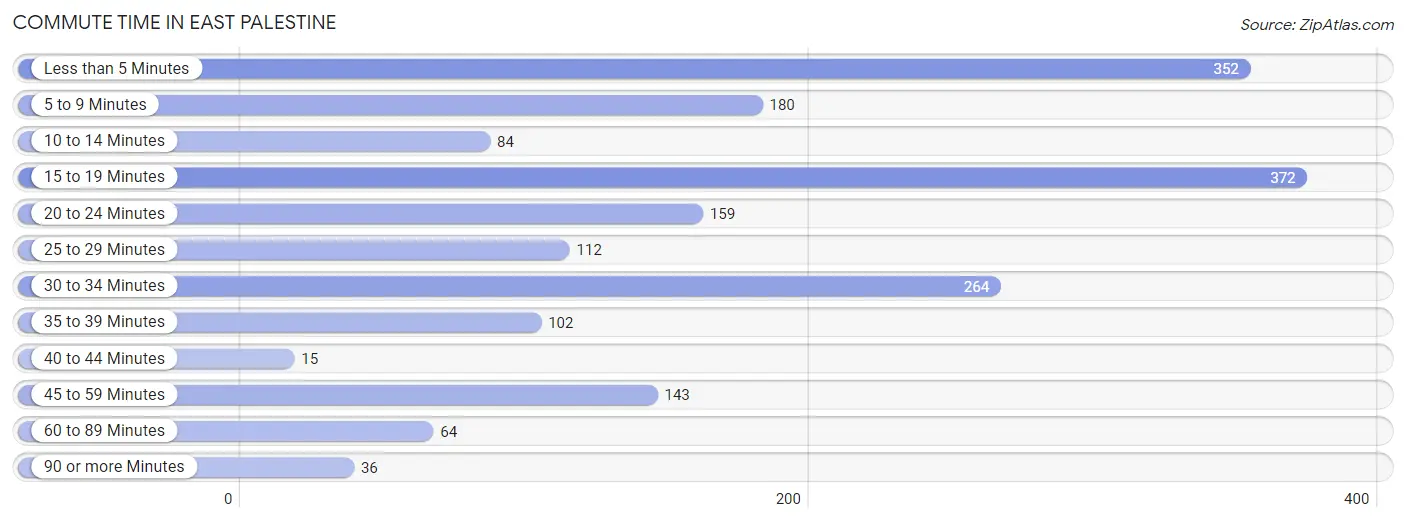
| Commute Time | # Commuters | % Commuters |
| Less than 5 Minutes | 352 | 18.7% |
| 5 to 9 Minutes | 180 | 9.6% |
| 10 to 14 Minutes | 84 | 4.5% |
| 15 to 19 Minutes | 372 | 19.8% |
| 20 to 24 Minutes | 159 | 8.4% |
| 25 to 29 Minutes | 112 | 5.9% |
| 30 to 34 Minutes | 264 | 14.0% |
| 35 to 39 Minutes | 102 | 5.4% |
| 40 to 44 Minutes | 15 | 0.8% |
| 45 to 59 Minutes | 143 | 7.6% |
| 60 to 89 Minutes | 64 | 3.4% |
| 90 or more Minutes | 36 | 1.9% |
Commute Time by Sex in East Palestine
The most common commute times in East Palestine are 15 to 19 minutes (169 commuters, 17.3%) for males and less than 5 minutes (230 commuters, 25.4%) for females.
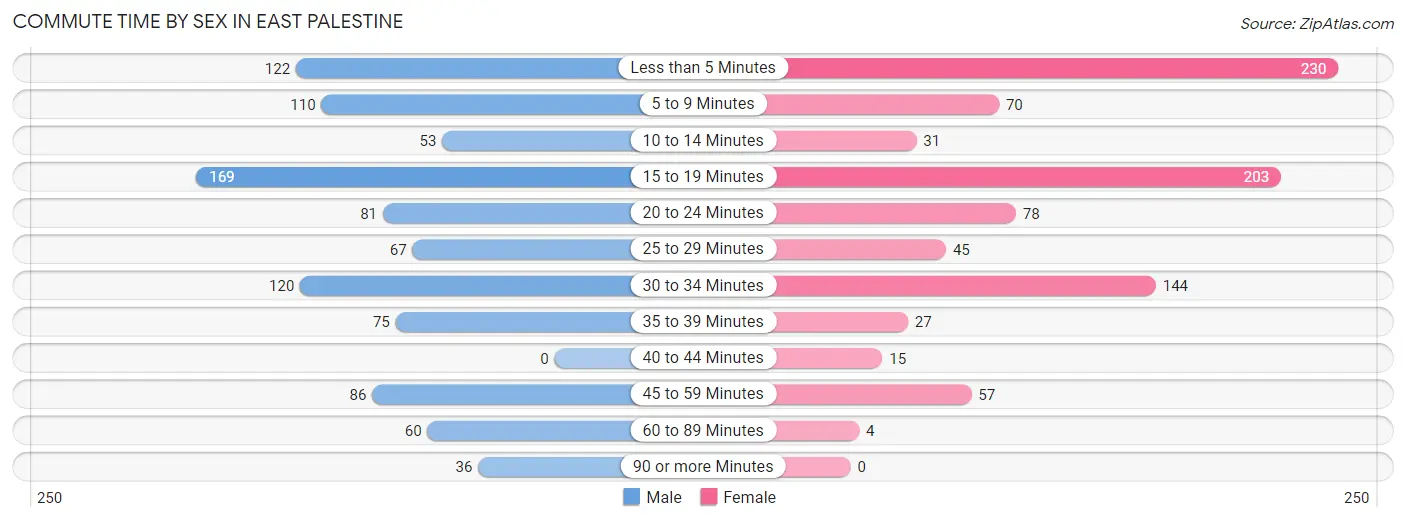
| Commute Time | Male | Female |
| Less than 5 Minutes | 122 (12.5%) | 230 (25.4%) |
| 5 to 9 Minutes | 110 (11.2%) | 70 (7.7%) |
| 10 to 14 Minutes | 53 (5.4%) | 31 (3.4%) |
| 15 to 19 Minutes | 169 (17.3%) | 203 (22.5%) |
| 20 to 24 Minutes | 81 (8.3%) | 78 (8.6%) |
| 25 to 29 Minutes | 67 (6.8%) | 45 (5.0%) |
| 30 to 34 Minutes | 120 (12.3%) | 144 (15.9%) |
| 35 to 39 Minutes | 75 (7.7%) | 27 (3.0%) |
| 40 to 44 Minutes | 0 (0.0%) | 15 (1.7%) |
| 45 to 59 Minutes | 86 (8.8%) | 57 (6.3%) |
| 60 to 89 Minutes | 60 (6.1%) | 4 (0.4%) |
| 90 or more Minutes | 36 (3.7%) | 0 (0.0%) |
Time of Departure to Work by Sex in East Palestine
The most frequent times of departure to work in East Palestine are 7:00 AM to 7:29 AM (150, 15.3%) for males and 8:00 AM to 8:29 AM (178, 19.7%) for females.
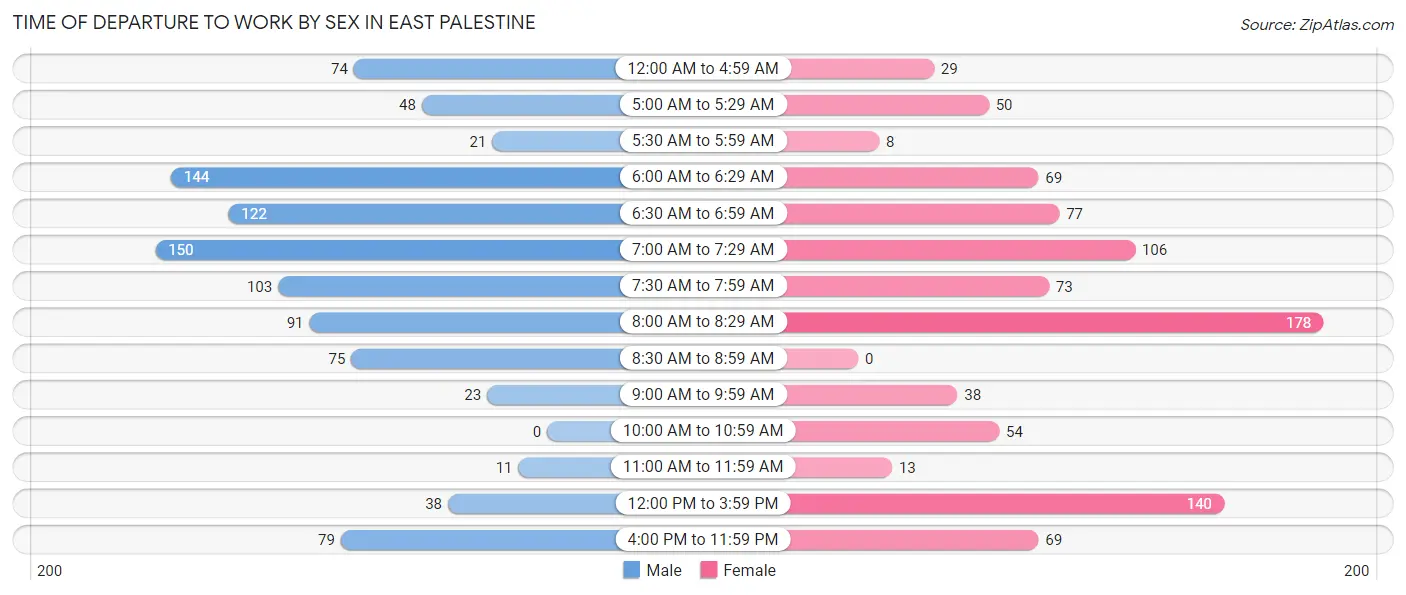
| Time of Departure | Male | Female |
| 12:00 AM to 4:59 AM | 74 (7.6%) | 29 (3.2%) |
| 5:00 AM to 5:29 AM | 48 (4.9%) | 50 (5.5%) |
| 5:30 AM to 5:59 AM | 21 (2.1%) | 8 (0.9%) |
| 6:00 AM to 6:29 AM | 144 (14.7%) | 69 (7.6%) |
| 6:30 AM to 6:59 AM | 122 (12.5%) | 77 (8.5%) |
| 7:00 AM to 7:29 AM | 150 (15.3%) | 106 (11.7%) |
| 7:30 AM to 7:59 AM | 103 (10.5%) | 73 (8.1%) |
| 8:00 AM to 8:29 AM | 91 (9.3%) | 178 (19.7%) |
| 8:30 AM to 8:59 AM | 75 (7.7%) | 0 (0.0%) |
| 9:00 AM to 9:59 AM | 23 (2.4%) | 38 (4.2%) |
| 10:00 AM to 10:59 AM | 0 (0.0%) | 54 (6.0%) |
| 11:00 AM to 11:59 AM | 11 (1.1%) | 13 (1.4%) |
| 12:00 PM to 3:59 PM | 38 (3.9%) | 140 (15.5%) |
| 4:00 PM to 11:59 PM | 79 (8.1%) | 69 (7.6%) |
| Total | 979 (100.0%) | 904 (100.0%) |
Housing Occupancy in East Palestine
Occupancy by Ownership in East Palestine
Of the total 1,981 dwellings in East Palestine, owner-occupied units account for 1,285 (64.9%), while renter-occupied units make up 696 (35.1%).
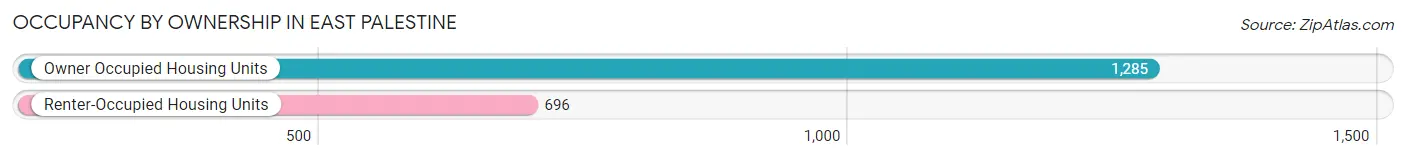
| Occupancy | # Housing Units | % Housing Units |
| Owner Occupied Housing Units | 1,285 | 64.9% |
| Renter-Occupied Housing Units | 696 | 35.1% |
| Total Occupied Housing Units | 1,981 | 100.0% |
Occupancy by Household Size in East Palestine
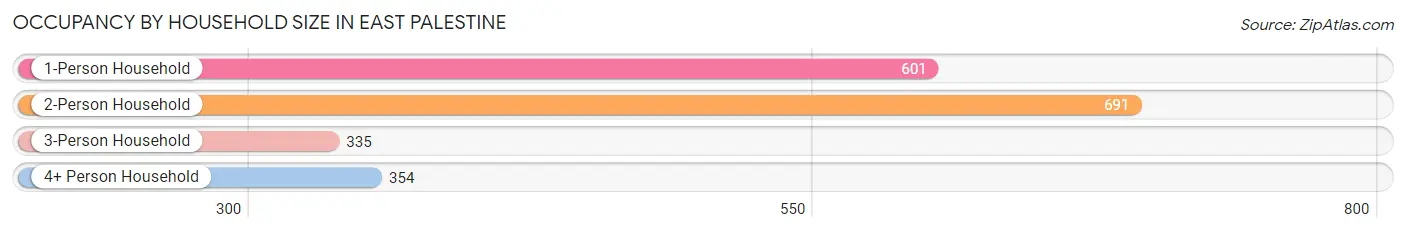
| Household Size | # Housing Units | % Housing Units |
| 1-Person Household | 601 | 30.3% |
| 2-Person Household | 691 | 34.9% |
| 3-Person Household | 335 | 16.9% |
| 4+ Person Household | 354 | 17.9% |
| Total Housing Units | 1,981 | 100.0% |
Occupancy by Ownership by Household Size in East Palestine
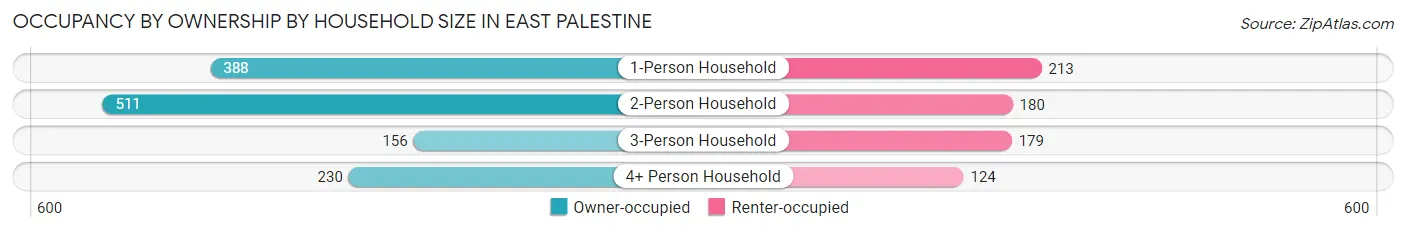
| Household Size | Owner-occupied | Renter-occupied |
| 1-Person Household | 388 (64.6%) | 213 (35.4%) |
| 2-Person Household | 511 (74.0%) | 180 (26.1%) |
| 3-Person Household | 156 (46.6%) | 179 (53.4%) |
| 4+ Person Household | 230 (65.0%) | 124 (35.0%) |
| Total Housing Units | 1,285 (64.9%) | 696 (35.1%) |
Occupancy by Educational Attainment in East Palestine
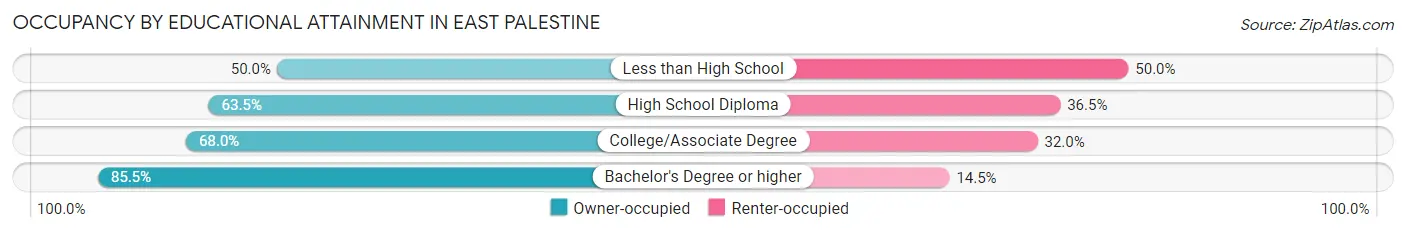
| Household Size | Owner-occupied | Renter-occupied |
| Less than High School | 129 (50.0%) | 129 (50.0%) |
| High School Diploma | 663 (63.5%) | 381 (36.5%) |
| College/Associate Degree | 340 (68.0%) | 160 (32.0%) |
| Bachelor's Degree or higher | 153 (85.5%) | 26 (14.5%) |
Occupancy by Age of Householder in East Palestine
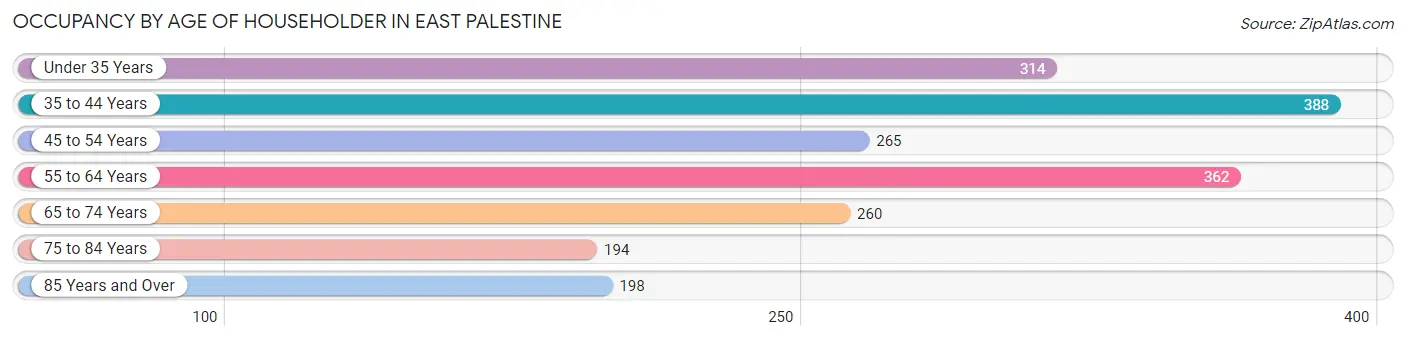
| Age Bracket | # Households | % Households |
| Under 35 Years | 314 | 15.9% |
| 35 to 44 Years | 388 | 19.6% |
| 45 to 54 Years | 265 | 13.4% |
| 55 to 64 Years | 362 | 18.3% |
| 65 to 74 Years | 260 | 13.1% |
| 75 to 84 Years | 194 | 9.8% |
| 85 Years and Over | 198 | 10.0% |
| Total | 1,981 | 100.0% |
Housing Finances in East Palestine
Median Income by Occupancy in East Palestine
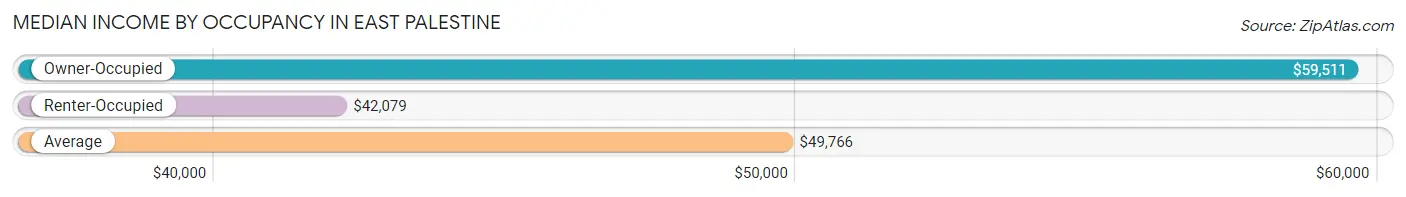
| Occupancy Type | # Households | Median Income |
| Owner-Occupied | 1,285 (64.9%) | $59,511 |
| Renter-Occupied | 696 (35.1%) | $42,079 |
| Average | 1,981 (100.0%) | $49,766 |
Occupancy by Householder Income Bracket in East Palestine
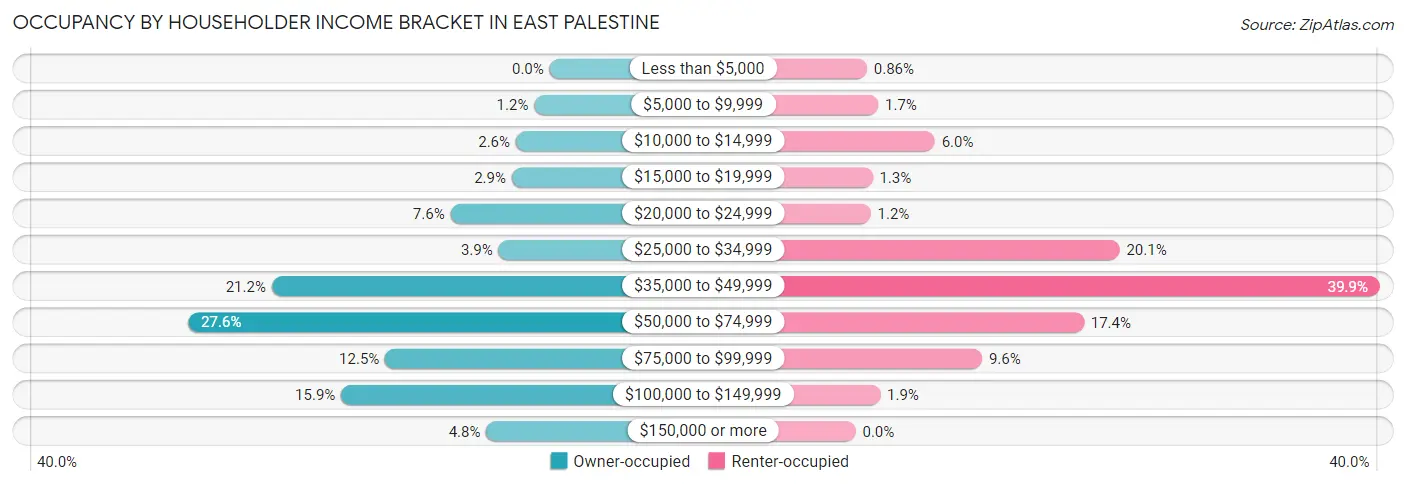
| Income Bracket | Owner-occupied | Renter-occupied |
| Less than $5,000 | 0 (0.0%) | 6 (0.9%) |
| $5,000 to $9,999 | 15 (1.2%) | 12 (1.7%) |
| $10,000 to $14,999 | 33 (2.6%) | 42 (6.0%) |
| $15,000 to $19,999 | 37 (2.9%) | 9 (1.3%) |
| $20,000 to $24,999 | 97 (7.5%) | 8 (1.1%) |
| $25,000 to $34,999 | 50 (3.9%) | 140 (20.1%) |
| $35,000 to $49,999 | 272 (21.2%) | 278 (39.9%) |
| $50,000 to $74,999 | 354 (27.6%) | 121 (17.4%) |
| $75,000 to $99,999 | 161 (12.5%) | 67 (9.6%) |
| $100,000 to $149,999 | 204 (15.9%) | 13 (1.9%) |
| $150,000 or more | 62 (4.8%) | 0 (0.0%) |
| Total | 1,285 (100.0%) | 696 (100.0%) |
Monthly Housing Cost Tiers in East Palestine
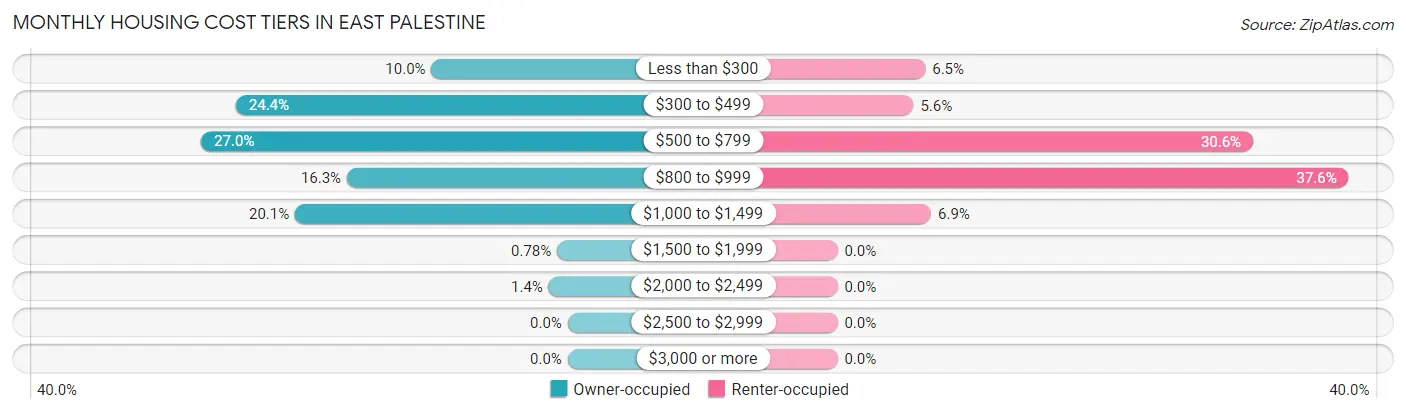
| Monthly Cost | Owner-occupied | Renter-occupied |
| Less than $300 | 129 (10.0%) | 45 (6.5%) |
| $300 to $499 | 314 (24.4%) | 39 (5.6%) |
| $500 to $799 | 347 (27.0%) | 213 (30.6%) |
| $800 to $999 | 209 (16.3%) | 262 (37.6%) |
| $1,000 to $1,499 | 258 (20.1%) | 48 (6.9%) |
| $1,500 to $1,999 | 10 (0.8%) | 0 (0.0%) |
| $2,000 to $2,499 | 18 (1.4%) | 0 (0.0%) |
| $2,500 to $2,999 | 0 (0.0%) | 0 (0.0%) |
| $3,000 or more | 0 (0.0%) | 0 (0.0%) |
| Total | 1,285 (100.0%) | 696 (100.0%) |
Physical Housing Characteristics in East Palestine
Housing Structures in East Palestine
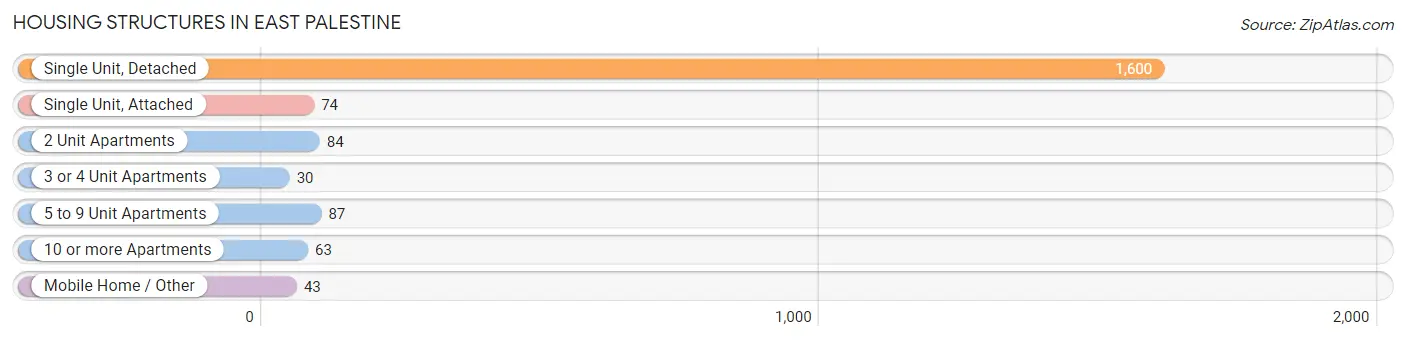
| Structure Type | # Housing Units | % Housing Units |
| Single Unit, Detached | 1,600 | 80.8% |
| Single Unit, Attached | 74 | 3.7% |
| 2 Unit Apartments | 84 | 4.2% |
| 3 or 4 Unit Apartments | 30 | 1.5% |
| 5 to 9 Unit Apartments | 87 | 4.4% |
| 10 or more Apartments | 63 | 3.2% |
| Mobile Home / Other | 43 | 2.2% |
| Total | 1,981 | 100.0% |
Housing Structures by Occupancy in East Palestine
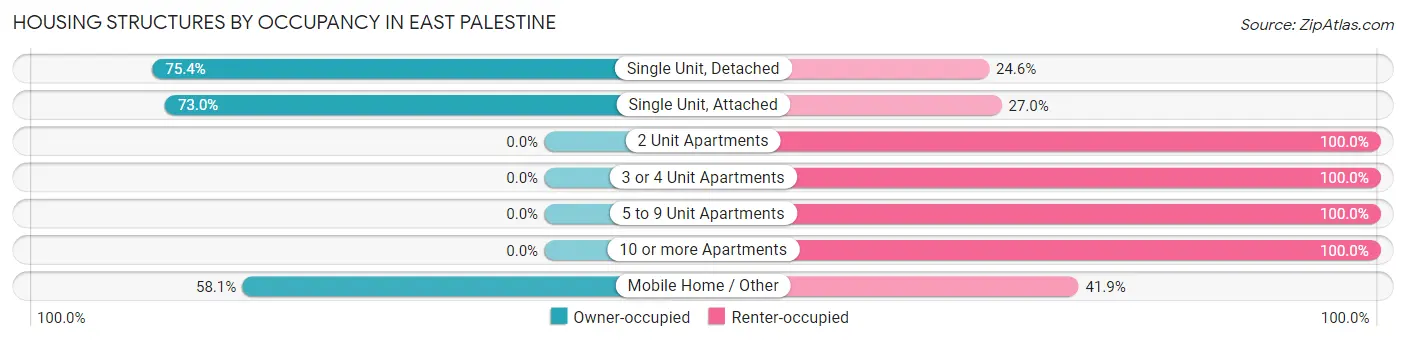
| Structure Type | Owner-occupied | Renter-occupied |
| Single Unit, Detached | 1,206 (75.4%) | 394 (24.6%) |
| Single Unit, Attached | 54 (73.0%) | 20 (27.0%) |
| 2 Unit Apartments | 0 (0.0%) | 84 (100.0%) |
| 3 or 4 Unit Apartments | 0 (0.0%) | 30 (100.0%) |
| 5 to 9 Unit Apartments | 0 (0.0%) | 87 (100.0%) |
| 10 or more Apartments | 0 (0.0%) | 63 (100.0%) |
| Mobile Home / Other | 25 (58.1%) | 18 (41.9%) |
| Total | 1,285 (64.9%) | 696 (35.1%) |
Housing Structures by Number of Rooms in East Palestine
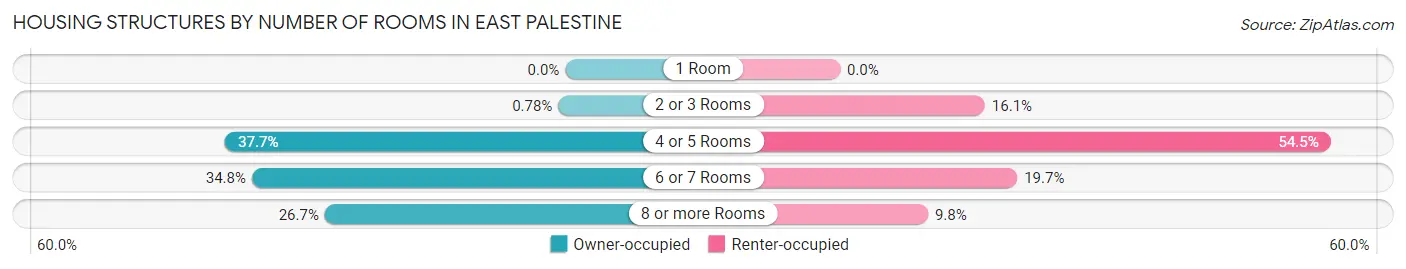
| Number of Rooms | Owner-occupied | Renter-occupied |
| 1 Room | 0 (0.0%) | 0 (0.0%) |
| 2 or 3 Rooms | 10 (0.8%) | 112 (16.1%) |
| 4 or 5 Rooms | 485 (37.7%) | 379 (54.4%) |
| 6 or 7 Rooms | 447 (34.8%) | 137 (19.7%) |
| 8 or more Rooms | 343 (26.7%) | 68 (9.8%) |
| Total | 1,285 (100.0%) | 696 (100.0%) |
Housing Structure by Heating Type in East Palestine
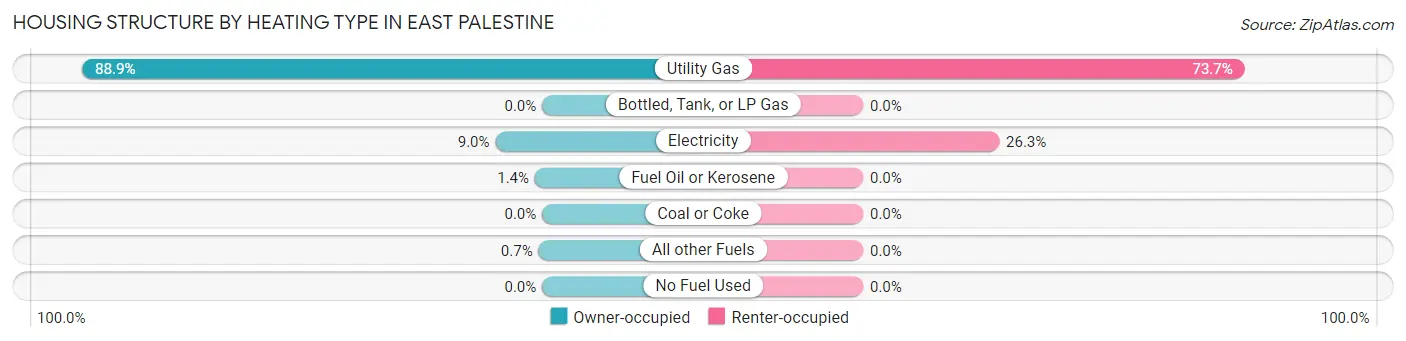
| Heating Type | Owner-occupied | Renter-occupied |
| Utility Gas | 1,142 (88.9%) | 513 (73.7%) |
| Bottled, Tank, or LP Gas | 0 (0.0%) | 0 (0.0%) |
| Electricity | 116 (9.0%) | 183 (26.3%) |
| Fuel Oil or Kerosene | 18 (1.4%) | 0 (0.0%) |
| Coal or Coke | 0 (0.0%) | 0 (0.0%) |
| All other Fuels | 9 (0.7%) | 0 (0.0%) |
| No Fuel Used | 0 (0.0%) | 0 (0.0%) |
| Total | 1,285 (100.0%) | 696 (100.0%) |
Household Vehicle Usage in East Palestine
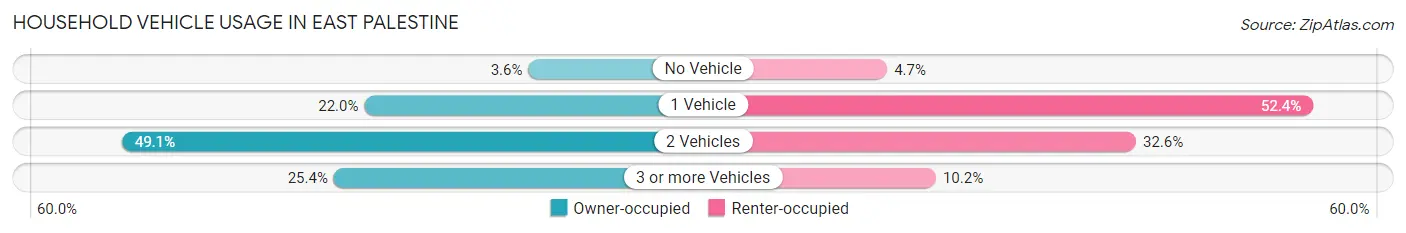
| Vehicles per Household | Owner-occupied | Renter-occupied |
| No Vehicle | 46 (3.6%) | 33 (4.7%) |
| 1 Vehicle | 282 (22.0%) | 365 (52.4%) |
| 2 Vehicles | 631 (49.1%) | 227 (32.6%) |
| 3 or more Vehicles | 326 (25.4%) | 71 (10.2%) |
| Total | 1,285 (100.0%) | 696 (100.0%) |
Real Estate & Mortgages in East Palestine
Real Estate and Mortgage Overview in East Palestine
| Characteristic | Without Mortgage | With Mortgage |
| Housing Units | 552 | 733 |
| Median Property Value | $97,400 | $105,900 |
| Median Household Income | $50,000 | $56 |
| Monthly Housing Costs | $394 | $0 |
| Real Estate Taxes | $1,526 | $36 |
Property Value by Mortgage Status in East Palestine
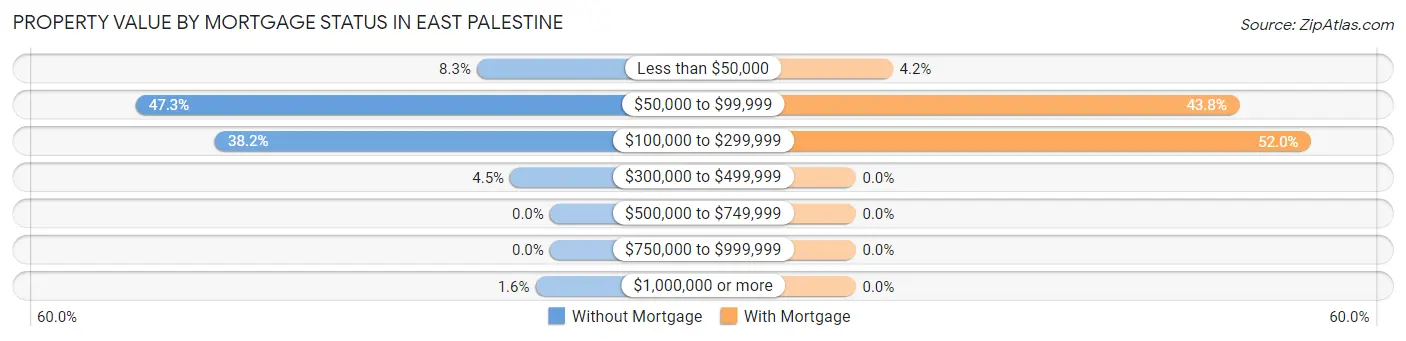
| Property Value | Without Mortgage | With Mortgage |
| Less than $50,000 | 46 (8.3%) | 31 (4.2%) |
| $50,000 to $99,999 | 261 (47.3%) | 321 (43.8%) |
| $100,000 to $299,999 | 211 (38.2%) | 381 (52.0%) |
| $300,000 to $499,999 | 25 (4.5%) | 0 (0.0%) |
| $500,000 to $749,999 | 0 (0.0%) | 0 (0.0%) |
| $750,000 to $999,999 | 0 (0.0%) | 0 (0.0%) |
| $1,000,000 or more | 9 (1.6%) | 0 (0.0%) |
| Total | 552 (100.0%) | 733 (100.0%) |
Household Income by Mortgage Status in East Palestine
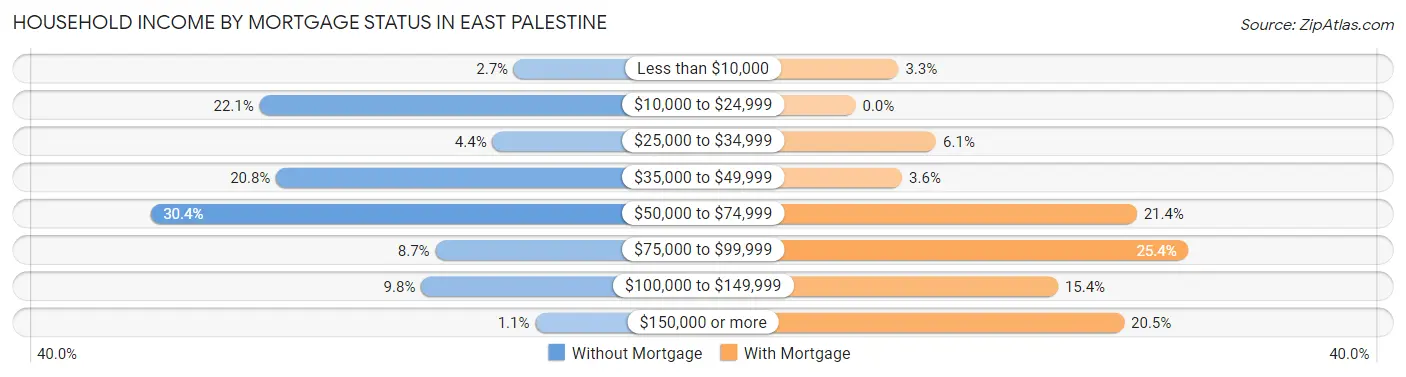
| Household Income | Without Mortgage | With Mortgage |
| Less than $10,000 | 15 (2.7%) | 24 (3.3%) |
| $10,000 to $24,999 | 122 (22.1%) | 0 (0.0%) |
| $25,000 to $34,999 | 24 (4.3%) | 45 (6.1%) |
| $35,000 to $49,999 | 115 (20.8%) | 26 (3.5%) |
| $50,000 to $74,999 | 168 (30.4%) | 157 (21.4%) |
| $75,000 to $99,999 | 48 (8.7%) | 186 (25.4%) |
| $100,000 to $149,999 | 54 (9.8%) | 113 (15.4%) |
| $150,000 or more | 6 (1.1%) | 150 (20.5%) |
| Total | 552 (100.0%) | 733 (100.0%) |
Property Value to Household Income Ratio in East Palestine
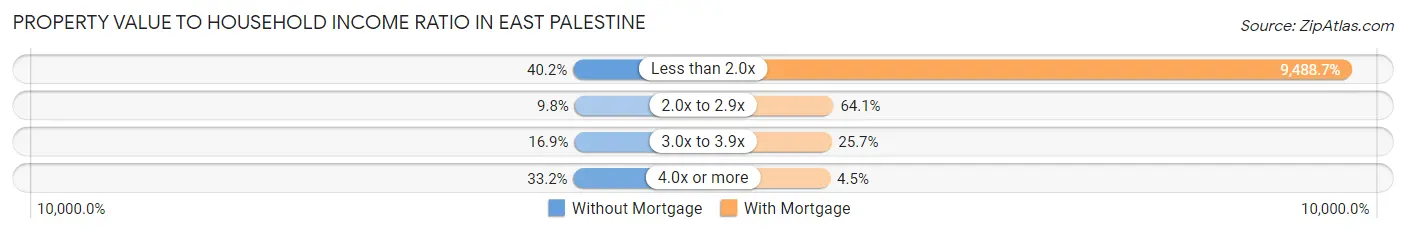
| Value-to-Income Ratio | Without Mortgage | With Mortgage |
| Less than 2.0x | 222 (40.2%) | 69,552 (9,488.7%) |
| 2.0x to 2.9x | 54 (9.8%) | 470 (64.1%) |
| 3.0x to 3.9x | 93 (16.9%) | 188 (25.7%) |
| 4.0x or more | 183 (33.2%) | 33 (4.5%) |
| Total | 552 (100.0%) | 733 (100.0%) |
Real Estate Taxes by Mortgage Status in East Palestine
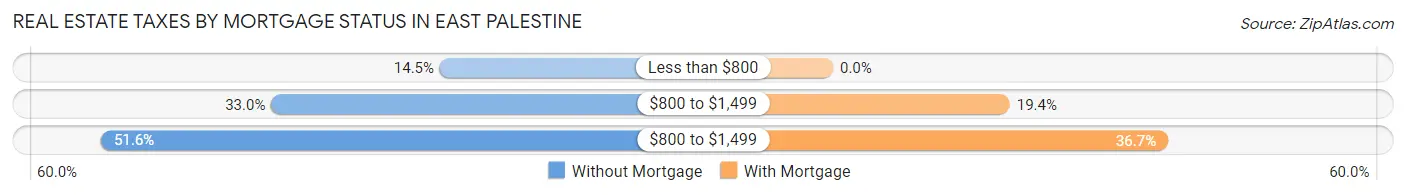
| Property Taxes | Without Mortgage | With Mortgage |
| Less than $800 | 80 (14.5%) | 0 (0.0%) |
| $800 to $1,499 | 182 (33.0%) | 142 (19.4%) |
| $800 to $1,499 | 285 (51.6%) | 269 (36.7%) |
| Total | 552 (100.0%) | 733 (100.0%) |
Health & Disability in East Palestine
Health Insurance Coverage by Age in East Palestine
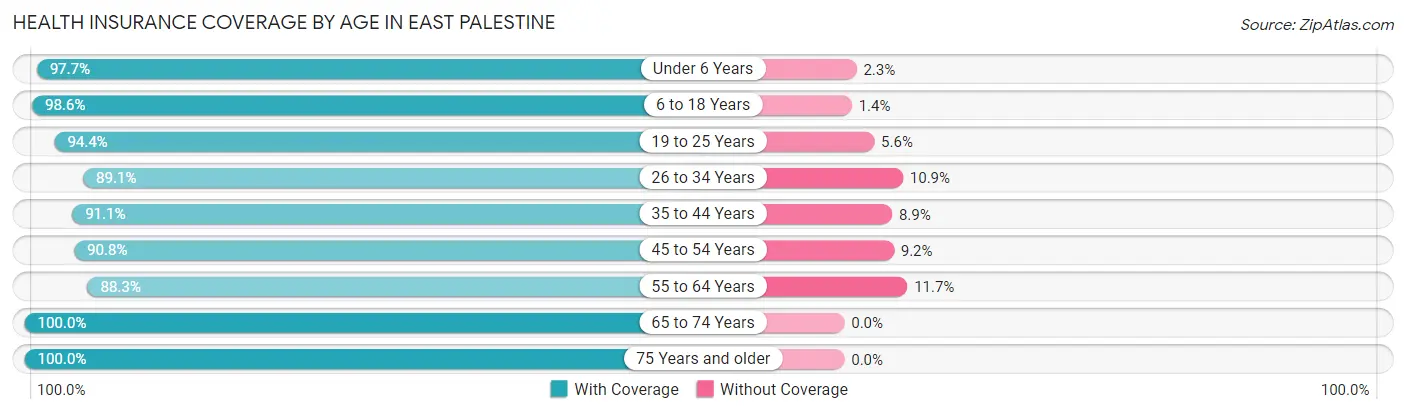
| Age Bracket | With Coverage | Without Coverage |
| Under 6 Years | 516 (97.7%) | 12 (2.3%) |
| 6 to 18 Years | 712 (98.6%) | 10 (1.4%) |
| 19 to 25 Years | 288 (94.4%) | 17 (5.6%) |
| 26 to 34 Years | 416 (89.1%) | 51 (10.9%) |
| 35 to 44 Years | 543 (91.1%) | 53 (8.9%) |
| 45 to 54 Years | 344 (90.8%) | 35 (9.2%) |
| 55 to 64 Years | 632 (88.3%) | 84 (11.7%) |
| 65 to 74 Years | 471 (100.0%) | 0 (0.0%) |
| 75 Years and older | 476 (100.0%) | 0 (0.0%) |
| Total | 4,398 (94.4%) | 262 (5.6%) |
Health Insurance Coverage by Citizenship Status in East Palestine
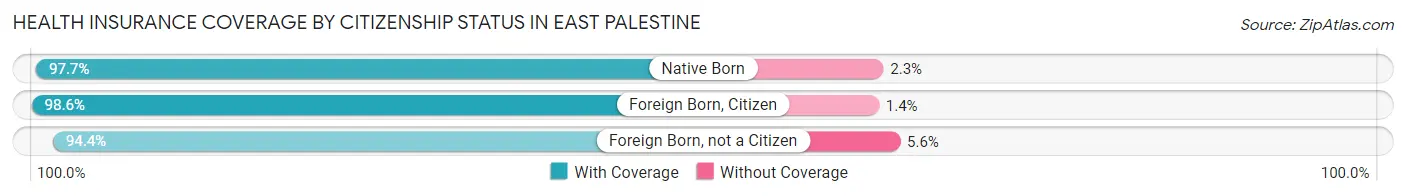
| Citizenship Status | With Coverage | Without Coverage |
| Native Born | 516 (97.7%) | 12 (2.3%) |
| Foreign Born, Citizen | 712 (98.6%) | 10 (1.4%) |
| Foreign Born, not a Citizen | 288 (94.4%) | 17 (5.6%) |
Health Insurance Coverage by Household Income in East Palestine
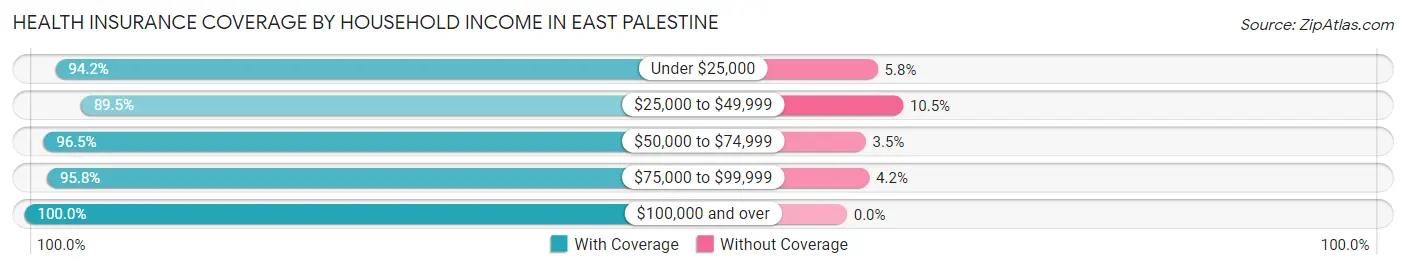
| Household Income | With Coverage | Without Coverage |
| Under $25,000 | 326 (94.2%) | 20 (5.8%) |
| $25,000 to $49,999 | 1,437 (89.5%) | 169 (10.5%) |
| $50,000 to $74,999 | 1,235 (96.5%) | 45 (3.5%) |
| $75,000 to $99,999 | 640 (95.8%) | 28 (4.2%) |
| $100,000 and over | 752 (100.0%) | 0 (0.0%) |
Public vs Private Health Insurance Coverage by Age in East Palestine
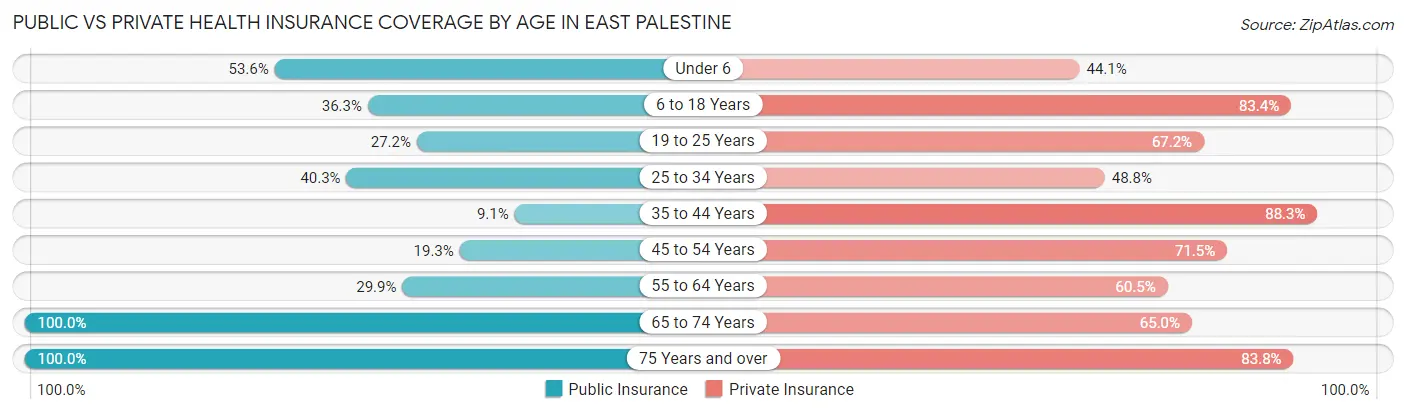
| Age Bracket | Public Insurance | Private Insurance |
| Under 6 | 283 (53.6%) | 233 (44.1%) |
| 6 to 18 Years | 262 (36.3%) | 602 (83.4%) |
| 19 to 25 Years | 83 (27.2%) | 205 (67.2%) |
| 25 to 34 Years | 188 (40.3%) | 228 (48.8%) |
| 35 to 44 Years | 54 (9.1%) | 526 (88.3%) |
| 45 to 54 Years | 73 (19.3%) | 271 (71.5%) |
| 55 to 64 Years | 214 (29.9%) | 433 (60.5%) |
| 65 to 74 Years | 471 (100.0%) | 306 (65.0%) |
| 75 Years and over | 476 (100.0%) | 399 (83.8%) |
| Total | 2,104 (45.2%) | 3,203 (68.7%) |
Disability Status by Sex by Age in East Palestine
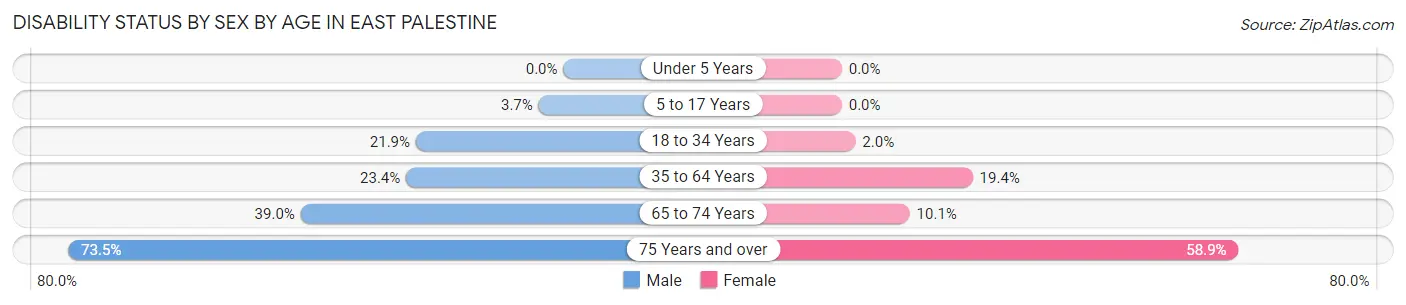
| Age Bracket | Male | Female |
| Under 5 Years | 0 (0.0%) | 0 (0.0%) |
| 5 to 17 Years | 16 (3.7%) | 0 (0.0%) |
| 18 to 34 Years | 76 (21.9%) | 9 (2.0%) |
| 35 to 64 Years | 205 (23.4%) | 158 (19.4%) |
| 65 to 74 Years | 87 (39.0%) | 25 (10.1%) |
| 75 Years and over | 164 (73.5%) | 149 (58.9%) |
Disability Class by Sex by Age in East Palestine
Disability Class: Hearing Difficulty
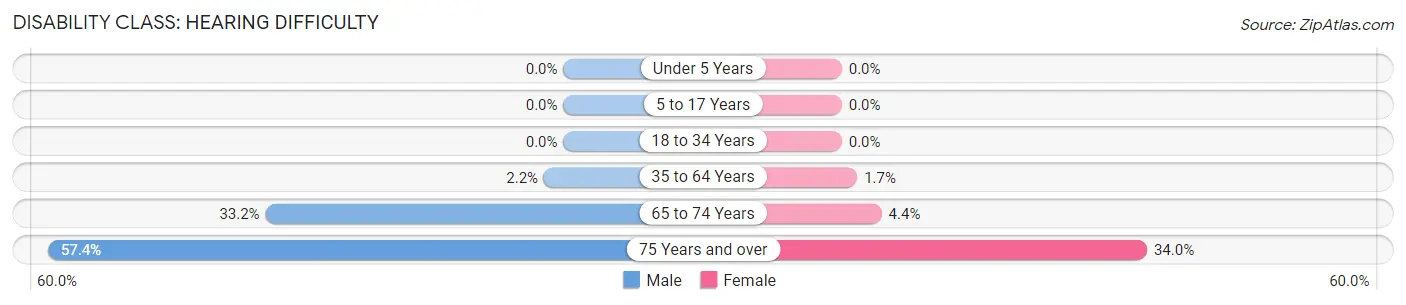
| Age Bracket | Male | Female |
| Under 5 Years | 0 (0.0%) | 0 (0.0%) |
| 5 to 17 Years | 0 (0.0%) | 0 (0.0%) |
| 18 to 34 Years | 0 (0.0%) | 0 (0.0%) |
| 35 to 64 Years | 19 (2.2%) | 14 (1.7%) |
| 65 to 74 Years | 74 (33.2%) | 11 (4.4%) |
| 75 Years and over | 128 (57.4%) | 86 (34.0%) |
Disability Class: Vision Difficulty
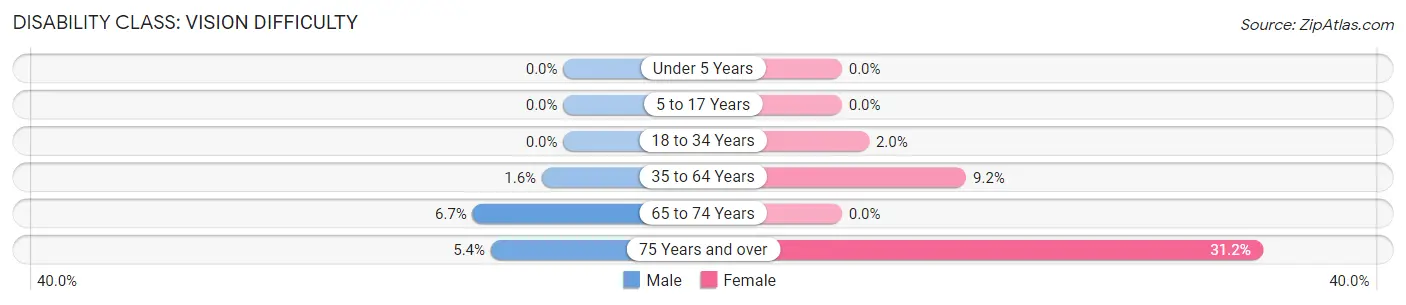
| Age Bracket | Male | Female |
| Under 5 Years | 0 (0.0%) | 0 (0.0%) |
| 5 to 17 Years | 0 (0.0%) | 0 (0.0%) |
| 18 to 34 Years | 0 (0.0%) | 9 (2.0%) |
| 35 to 64 Years | 14 (1.6%) | 75 (9.2%) |
| 65 to 74 Years | 15 (6.7%) | 0 (0.0%) |
| 75 Years and over | 12 (5.4%) | 79 (31.2%) |
Disability Class: Cognitive Difficulty
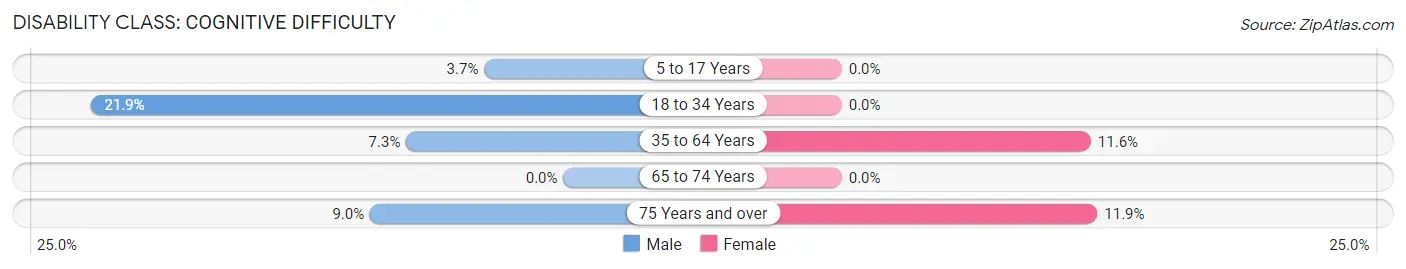
| Age Bracket | Male | Female |
| 5 to 17 Years | 16 (3.7%) | 0 (0.0%) |
| 18 to 34 Years | 76 (21.9%) | 0 (0.0%) |
| 35 to 64 Years | 64 (7.3%) | 94 (11.6%) |
| 65 to 74 Years | 0 (0.0%) | 0 (0.0%) |
| 75 Years and over | 20 (9.0%) | 30 (11.9%) |
Disability Class: Ambulatory Difficulty
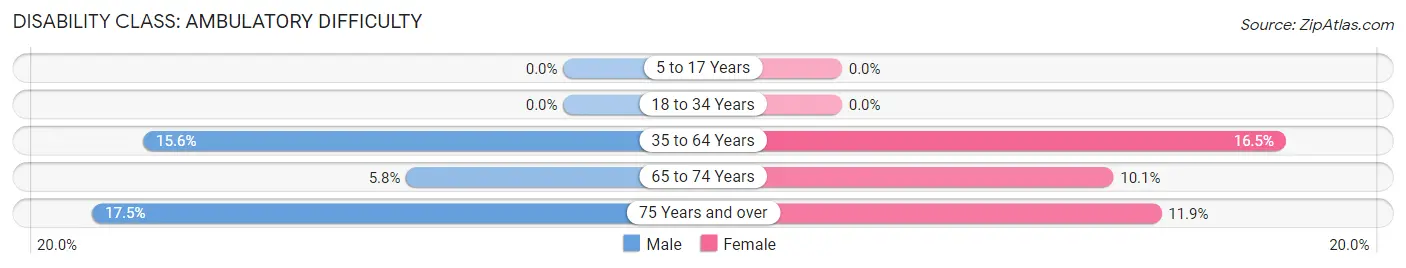
| Age Bracket | Male | Female |
| 5 to 17 Years | 0 (0.0%) | 0 (0.0%) |
| 18 to 34 Years | 0 (0.0%) | 0 (0.0%) |
| 35 to 64 Years | 137 (15.6%) | 134 (16.5%) |
| 65 to 74 Years | 13 (5.8%) | 25 (10.1%) |
| 75 Years and over | 39 (17.5%) | 30 (11.9%) |
Disability Class: Self-Care Difficulty
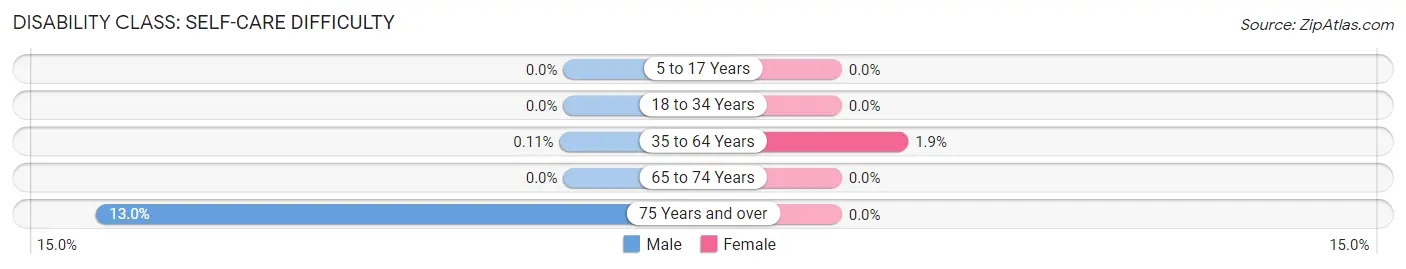
| Age Bracket | Male | Female |
| 5 to 17 Years | 0 (0.0%) | 0 (0.0%) |
| 18 to 34 Years | 0 (0.0%) | 0 (0.0%) |
| 35 to 64 Years | 1 (0.1%) | 15 (1.8%) |
| 65 to 74 Years | 0 (0.0%) | 0 (0.0%) |
| 75 Years and over | 29 (13.0%) | 0 (0.0%) |
Technology Access in East Palestine
Computing Device Access in East Palestine
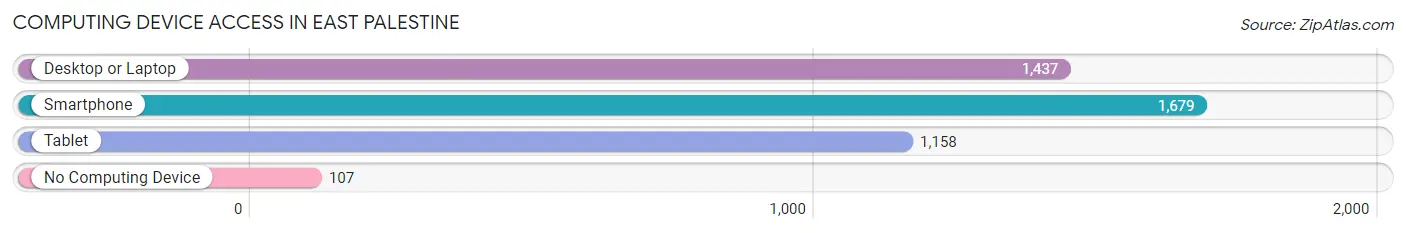
| Device Type | # Households | % Households |
| Desktop or Laptop | 1,437 | 72.5% |
| Smartphone | 1,679 | 84.8% |
| Tablet | 1,158 | 58.5% |
| No Computing Device | 107 | 5.4% |
| Total | 1,981 | 100.0% |
Internet Access in East Palestine
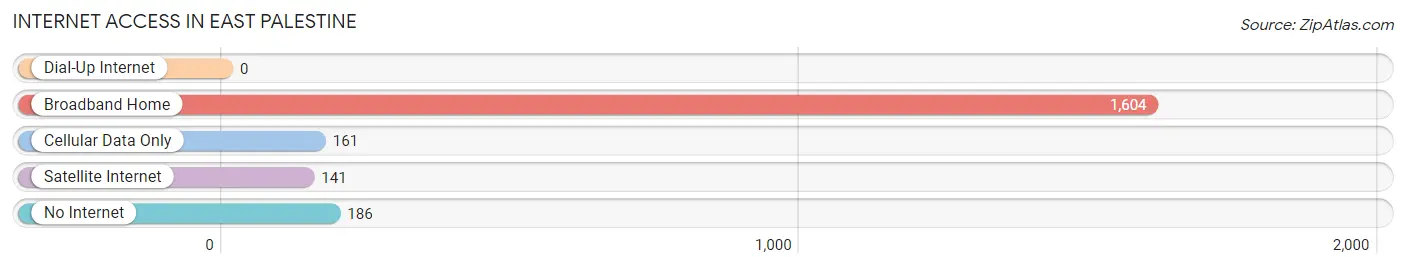
| Internet Type | # Households | % Households |
| Dial-Up Internet | 0 | 0.0% |
| Broadband Home | 1,604 | 81.0% |
| Cellular Data Only | 161 | 8.1% |
| Satellite Internet | 141 | 7.1% |
| No Internet | 186 | 9.4% |
| Total | 1,981 | 100.0% |
East Palestine Summary
History
The history of East Palestine, Ohio dates back to the early 1800s when the area was first settled by Quakers. The town was originally known as “New Waterford” and was founded in 1806 by a group of Quakers from Pennsylvania. The town was renamed East Palestine in 1832 after the nearby city of Palestine, which was located in the western part of the state.
The town grew slowly but steadily over the years, and by the late 1800s it had become a thriving industrial center. The town was home to several factories, including a glass factory, a pottery factory, and a brickyard. The town also had a number of stores, churches, and other businesses.
In the early 1900s, East Palestine experienced a period of rapid growth. The population increased from 1,000 in 1900 to over 5,000 by 1920. This growth was largely due to the influx of immigrants from Europe, particularly from Italy and Poland.
The town continued to grow throughout the 20th century, and by the year 2000 the population had reached 6,500.
Geography
East Palestine is located in Columbiana County, Ohio, in the northeastern part of the state. The town is situated on the banks of the Little Beaver Creek, which flows through the center of town. The town is surrounded by rolling hills and farmland, and is located about 30 miles south of Youngstown and about 50 miles northwest of Pittsburgh.
The climate in East Palestine is typical of the Midwest, with cold winters and hot, humid summers. The average annual temperature is around 50 degrees Fahrenheit, and the average annual precipitation is around 40 inches.
Economy
The economy of East Palestine is largely based on manufacturing and agriculture. The town is home to several factories, including a glass factory, a pottery factory, and a brickyard. The town also has a number of stores, churches, and other businesses.
Agriculture is also an important part of the local economy. The surrounding area is home to several farms, and the town is known for its production of corn, soybeans, and hay.
Demographics
As of the 2010 census, the population of East Palestine was 6,560. The racial makeup of the town was 97.2% White, 0.7% African American, 0.2% Native American, 0.3% Asian, 0.1% Pacific Islander, 0.5% from other races, and 1.0% from two or more races. Hispanic or Latino of any race were 1.3% of the population.
The median household income in East Palestine was $35,938, and the median family income was $41,944. The per capita income was $17,845. About 16.2% of families and 19.2% of the population were below the poverty line, including 28.2% of those under age 18 and 8.2% of those age 65 or over.
Common Questions
What is Per Capita Income in East Palestine?
Per Capita income in East Palestine is $30,057.
What is the Median Family Income in East Palestine?
Median Family Income in East Palestine is $57,614.
What is the Median Household income in East Palestine?
Median Household Income in East Palestine is $49,766.
What is Income or Wage Gap in East Palestine?
Income or Wage Gap in East Palestine is 33.1%.
Women in East Palestine earn 66.9 cents for every dollar earned by a man.
What is Inequality or Gini Index in East Palestine?
Inequality or Gini Index in East Palestine is 0.41.
What is the Total Population of East Palestine?
Total Population of East Palestine is 4,723.
What is the Total Male Population of East Palestine?
Total Male Population of East Palestine is 2,388.
What is the Total Female Population of East Palestine?
Total Female Population of East Palestine is 2,335.
What is the Ratio of Males per 100 Females in East Palestine?
There are 102.27 Males per 100 Females in East Palestine.
What is the Ratio of Females per 100 Males in East Palestine?
There are 97.78 Females per 100 Males in East Palestine.
What is the Median Population Age in East Palestine?
Median Population Age in East Palestine is 40.4 Years.
What is the Average Family Size in East Palestine
Average Family Size in East Palestine is 2.9 People.
What is the Average Household Size in East Palestine
Average Household Size in East Palestine is 2.4 People.
How Large is the Labor Force in East Palestine?
There are 2,171 People in the Labor Forcein in East Palestine.
What is the Percentage of People in the Labor Force in East Palestine?
58.3% of People are in the Labor Force in East Palestine.
What is the Unemployment Rate in East Palestine?
Unemployment Rate in East Palestine is 3.7%.