Dellroy, OH Map & Demographics
Dellroy Map
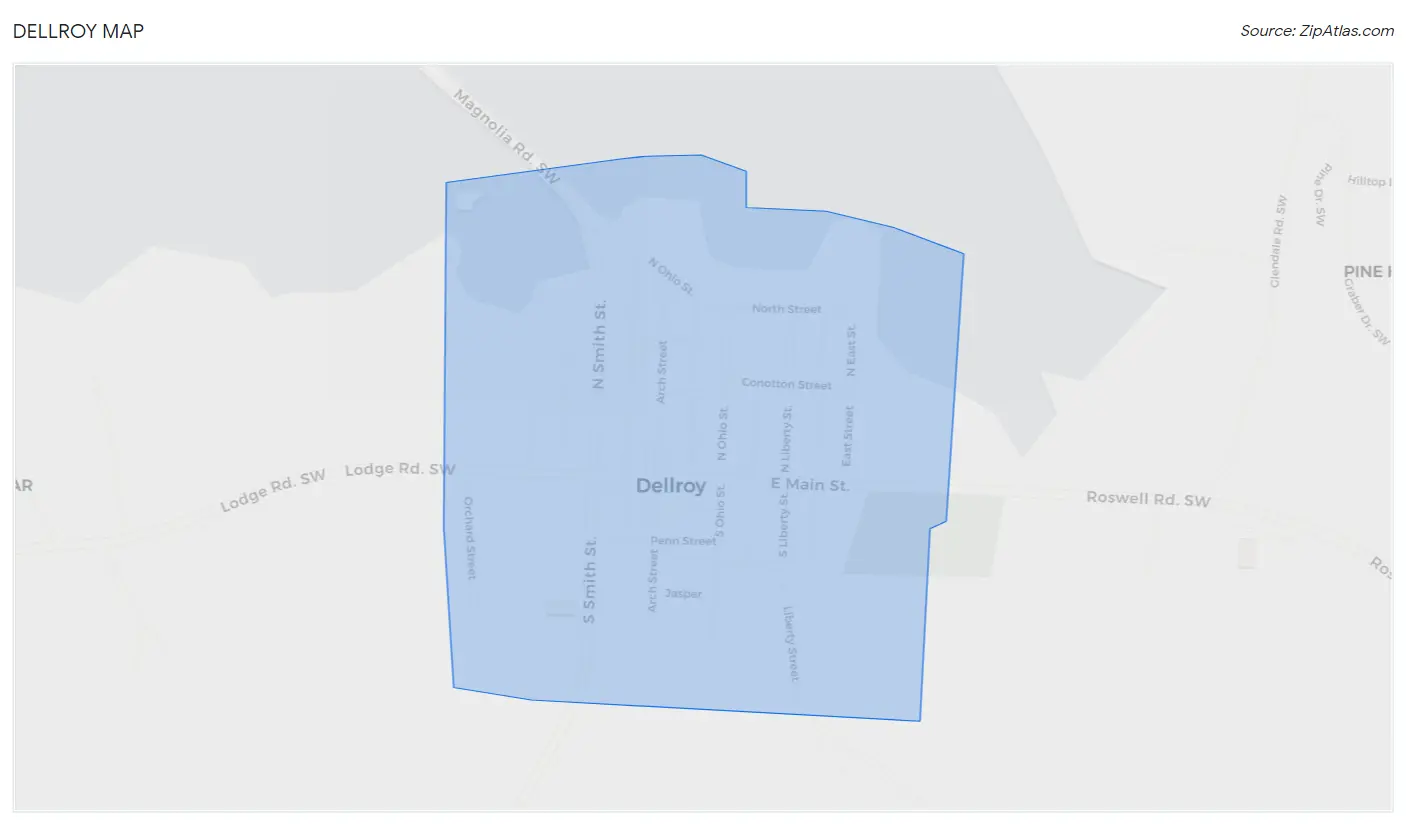
Dellroy Overview
$25,218
PER CAPITA INCOME
$55,313
AVG FAMILY INCOME
$52,833
AVG HOUSEHOLD INCOME
21.0%
WAGE / INCOME GAP [ % ]
79.0¢/ $1
WAGE / INCOME GAP [ $ ]
0.36
INEQUALITY / GINI INDEX
287
TOTAL POPULATION
145
MALE POPULATION
142
FEMALE POPULATION
102.11
MALES / 100 FEMALES
97.93
FEMALES / 100 MALES
47.3
MEDIAN AGE
2.7
AVG FAMILY SIZE
2.3
AVG HOUSEHOLD SIZE
114
LABOR FORCE [ PEOPLE ]
48.7%
PERCENT IN LABOR FORCE
2.6%
UNEMPLOYMENT RATE
Dellroy Zip Codes
Dellroy Area Codes
Income in Dellroy
Income Overview in Dellroy
Per Capita Income in Dellroy is $25,218, while median incomes of families and households are $55,313 and $52,833 respectively.
| Characteristic | Number | Measure |
| Per Capita Income | 287 | $25,218 |
| Median Family Income | 86 | $55,313 |
| Mean Family Income | 86 | $58,115 |
| Median Household Income | 126 | $52,833 |
| Mean Household Income | 126 | $55,862 |
| Income Deficit | 86 | $0 |
| Wage / Income Gap (%) | 287 | 20.98% |
| Wage / Income Gap ($) | 287 | 79.02¢ per $1 |
| Gini / Inequality Index | 287 | 0.36 |
Earnings by Sex in Dellroy
Average Earnings in Dellroy are $42,857, $43,500 for men and $34,375 for women, a difference of 21.0%.
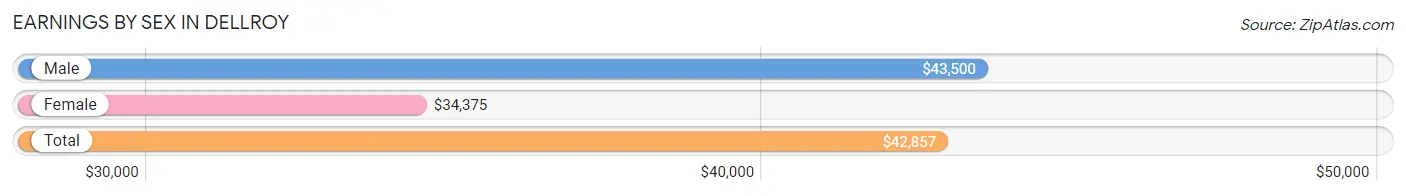
| Sex | Number | Average Earnings |
| Male | 80 (62.5%) | $43,500 |
| Female | 48 (37.5%) | $34,375 |
| Total | 128 (100.0%) | $42,857 |
Earnings by Sex by Income Bracket in Dellroy
The most common earnings brackets in Dellroy are $50,000 to $54,999 for men (15 | 18.8%) and $15,000 to $17,499 for women (9 | 18.8%).
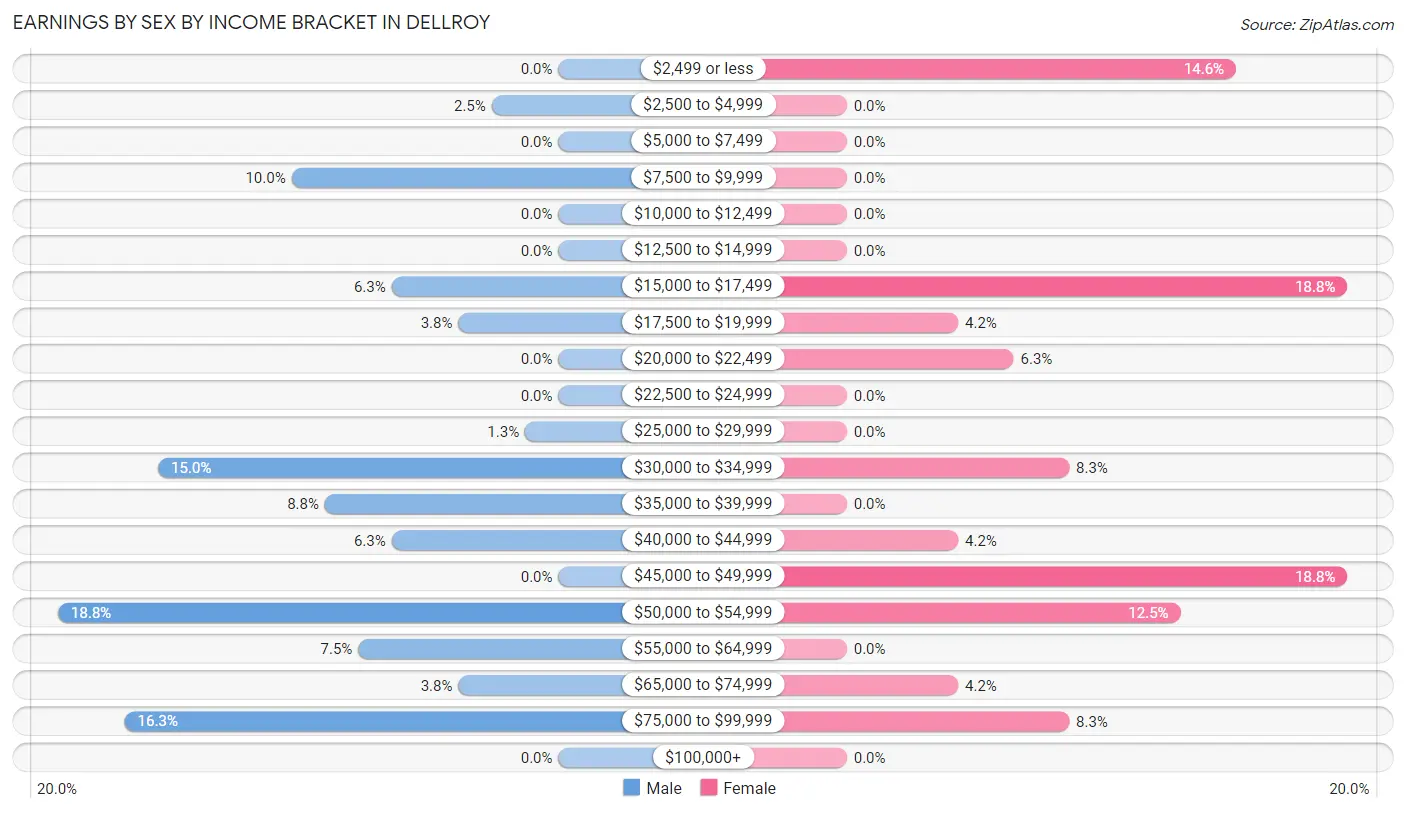
| Income | Male | Female |
| $2,499 or less | 0 (0.0%) | 7 (14.6%) |
| $2,500 to $4,999 | 2 (2.5%) | 0 (0.0%) |
| $5,000 to $7,499 | 0 (0.0%) | 0 (0.0%) |
| $7,500 to $9,999 | 8 (10.0%) | 0 (0.0%) |
| $10,000 to $12,499 | 0 (0.0%) | 0 (0.0%) |
| $12,500 to $14,999 | 0 (0.0%) | 0 (0.0%) |
| $15,000 to $17,499 | 5 (6.2%) | 9 (18.8%) |
| $17,500 to $19,999 | 3 (3.7%) | 2 (4.2%) |
| $20,000 to $22,499 | 0 (0.0%) | 3 (6.2%) |
| $22,500 to $24,999 | 0 (0.0%) | 0 (0.0%) |
| $25,000 to $29,999 | 1 (1.3%) | 0 (0.0%) |
| $30,000 to $34,999 | 12 (15.0%) | 4 (8.3%) |
| $35,000 to $39,999 | 7 (8.7%) | 0 (0.0%) |
| $40,000 to $44,999 | 5 (6.2%) | 2 (4.2%) |
| $45,000 to $49,999 | 0 (0.0%) | 9 (18.8%) |
| $50,000 to $54,999 | 15 (18.8%) | 6 (12.5%) |
| $55,000 to $64,999 | 6 (7.5%) | 0 (0.0%) |
| $65,000 to $74,999 | 3 (3.7%) | 2 (4.2%) |
| $75,000 to $99,999 | 13 (16.3%) | 4 (8.3%) |
| $100,000+ | 0 (0.0%) | 0 (0.0%) |
| Total | 80 (100.0%) | 48 (100.0%) |
Earnings by Sex by Educational Attainment in Dellroy
Average earnings in Dellroy are $44,250 for men and $45,156 for women, a difference of 2.0%. Men with an educational attainment of college or associate's degree enjoy the highest average annual earnings of $53,750, while those with high school diploma education earn the least with $33,875. Women with an educational attainment of college or associate's degree earn the most with the average annual earnings of $45,625, while those with high school diploma education have the smallest earnings of $33,438.
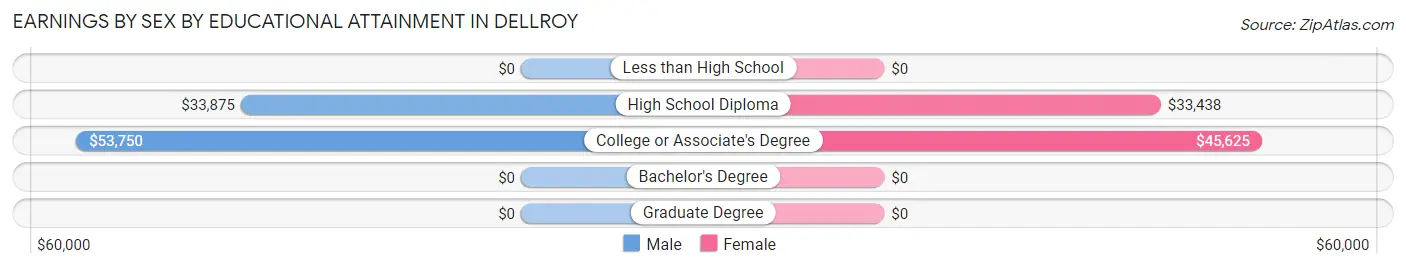
| Educational Attainment | Male Income | Female Income |
| Less than High School | - | - |
| High School Diploma | $33,875 | $33,438 |
| College or Associate's Degree | $53,750 | $45,625 |
| Bachelor's Degree | - | - |
| Graduate Degree | - | - |
| Total | $44,250 | $45,156 |
Family Income in Dellroy
Family Income Brackets in Dellroy
According to the Dellroy family income data, there are 26 families falling into the $50,000 to $74,999 income range, which is the most common income bracket and makes up 30.2% of all families.
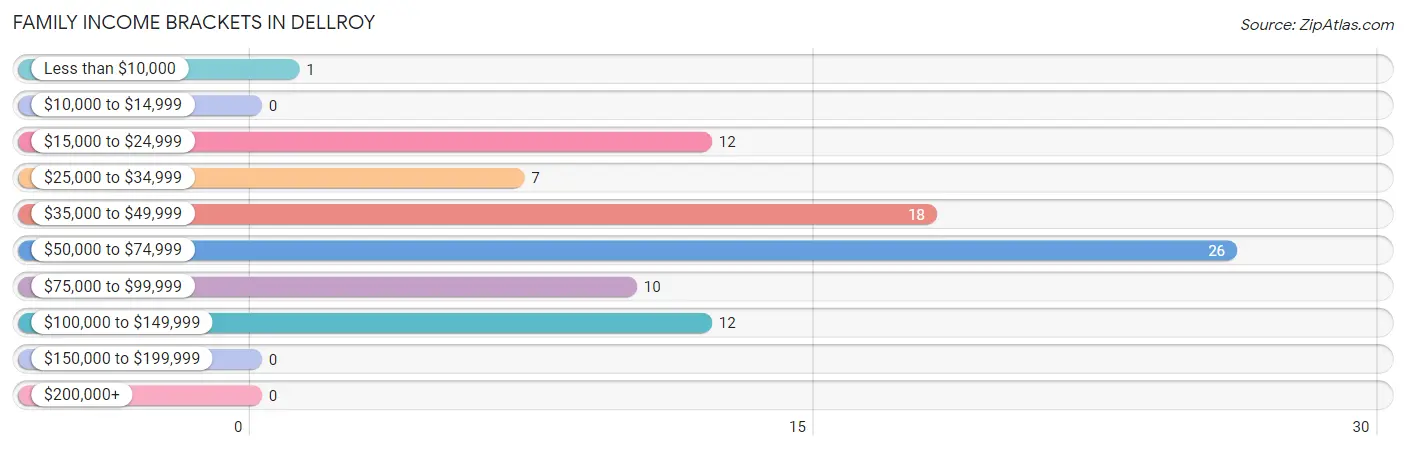
| Income Bracket | # Families | % Families |
| Less than $10,000 | 1 | 1.2% |
| $10,000 to $14,999 | 0 | 0.0% |
| $15,000 to $24,999 | 12 | 14.0% |
| $25,000 to $34,999 | 7 | 8.1% |
| $35,000 to $49,999 | 18 | 20.9% |
| $50,000 to $74,999 | 26 | 30.2% |
| $75,000 to $99,999 | 10 | 11.6% |
| $100,000 to $149,999 | 12 | 14.0% |
| $150,000 to $199,999 | 0 | 0.0% |
| $200,000+ | 0 | 0.0% |
Family Income by Famaliy Size in Dellroy
4-person families (6 | 7.0%) account for the highest median family income in Dellroy with $85,833 per family, while 4-person families (6 | 7.0%) have the highest median income of $21,458 per family member.
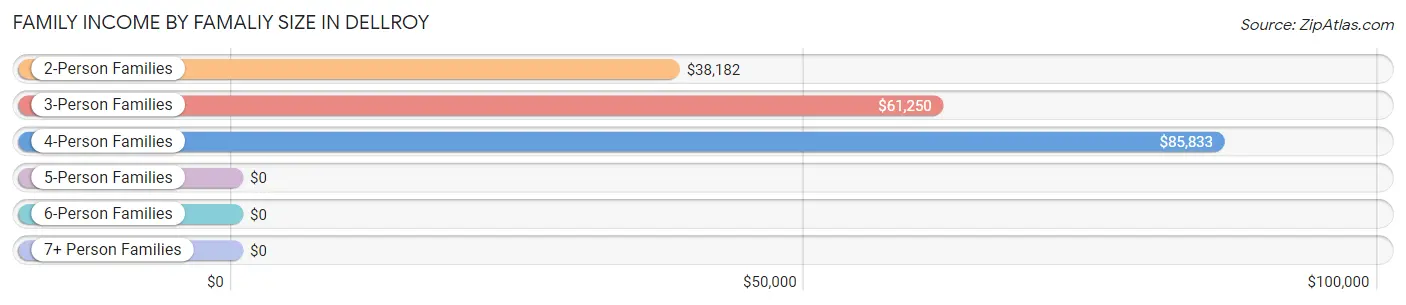
| Income Bracket | # Families | Median Income |
| 2-Person Families | 54 (62.8%) | $38,182 |
| 3-Person Families | 21 (24.4%) | $61,250 |
| 4-Person Families | 6 (7.0%) | $85,833 |
| 5-Person Families | 5 (5.8%) | $0 |
| 6-Person Families | 0 (0.0%) | $0 |
| 7+ Person Families | 0 (0.0%) | $0 |
| Total | 86 (100.0%) | $55,313 |
Family Income by Number of Earners in Dellroy
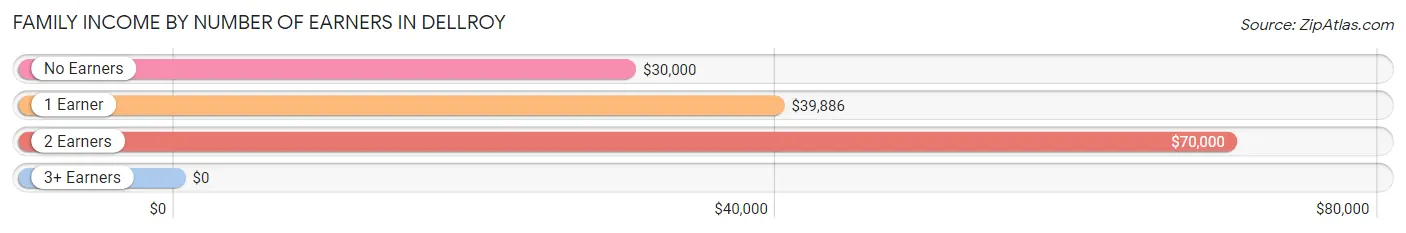
| Number of Earners | # Families | Median Income |
| No Earners | 18 (20.9%) | $30,000 |
| 1 Earner | 43 (50.0%) | $39,886 |
| 2 Earners | 24 (27.9%) | $70,000 |
| 3+ Earners | 1 (1.2%) | $0 |
| Total | 86 (100.0%) | $55,313 |
Household Income in Dellroy
Household Income Brackets in Dellroy
With 43 households falling in the category, the $50,000 to $74,999 income range is the most frequent in Dellroy, accounting for 34.1% of all households.
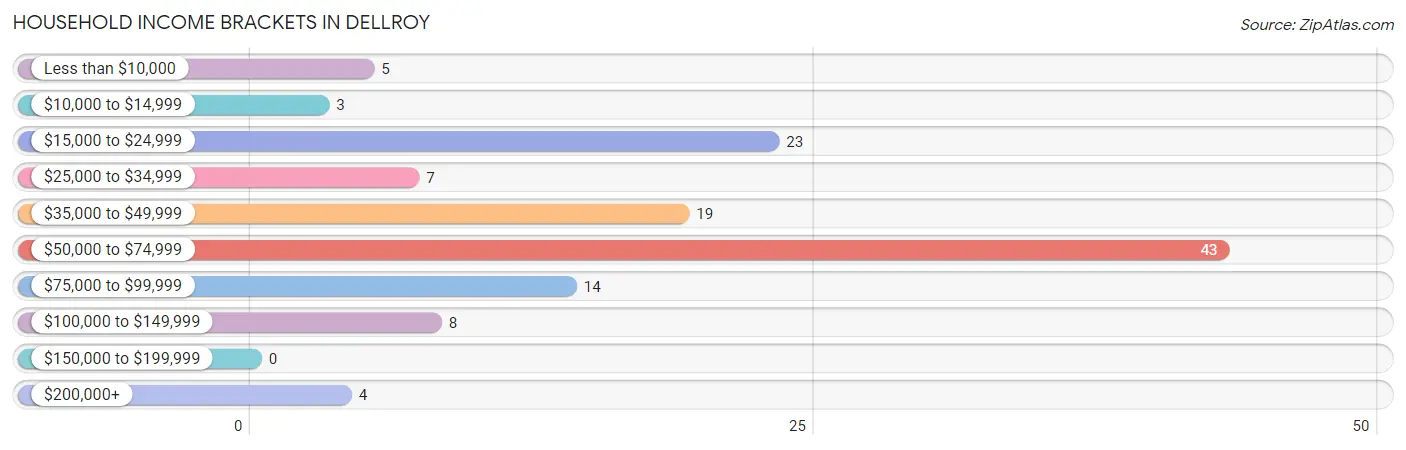
| Income Bracket | # Households | % Households |
| Less than $10,000 | 5 | 4.0% |
| $10,000 to $14,999 | 3 | 2.4% |
| $15,000 to $24,999 | 23 | 18.3% |
| $25,000 to $34,999 | 7 | 5.6% |
| $35,000 to $49,999 | 19 | 15.1% |
| $50,000 to $74,999 | 43 | 34.1% |
| $75,000 to $99,999 | 14 | 11.1% |
| $100,000 to $149,999 | 8 | 6.3% |
| $150,000 to $199,999 | 0 | 0.0% |
| $200,000+ | 4 | 3.2% |
Household Income by Householder Age in Dellroy
The median household income in Dellroy is $52,833, with the highest median household income of $61,000 found in the 25 to 44 years age bracket for the primary householder. A total of 42 households (33.3%) fall into this category.
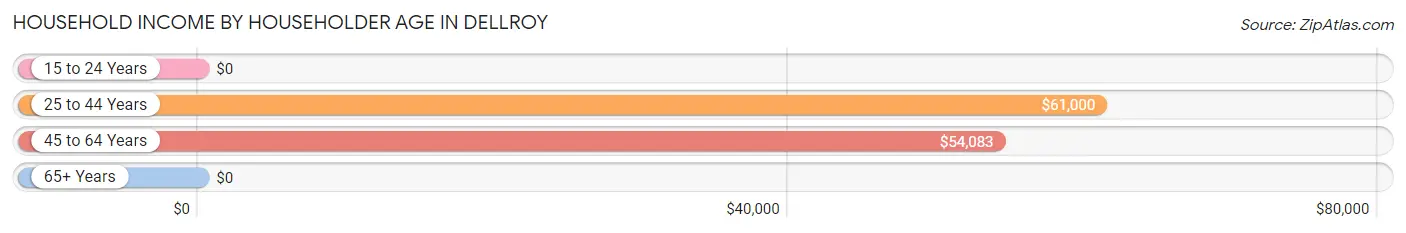
| Income Bracket | # Households | Median Income |
| 15 to 24 Years | 0 (0.0%) | $0 |
| 25 to 44 Years | 42 (33.3%) | $61,000 |
| 45 to 64 Years | 49 (38.9%) | $54,083 |
| 65+ Years | 35 (27.8%) | $0 |
| Total | 126 (100.0%) | $52,833 |
Poverty in Dellroy
Income Below Poverty by Sex and Age in Dellroy
With 9.2% poverty level for males and 9.1% for females among the residents of Dellroy, 55 to 64 year old males and 18 to 24 year old females are the most vulnerable to poverty, with 10 males (45.5%) and 3 females (37.5%) in their respective age groups living below the poverty level.
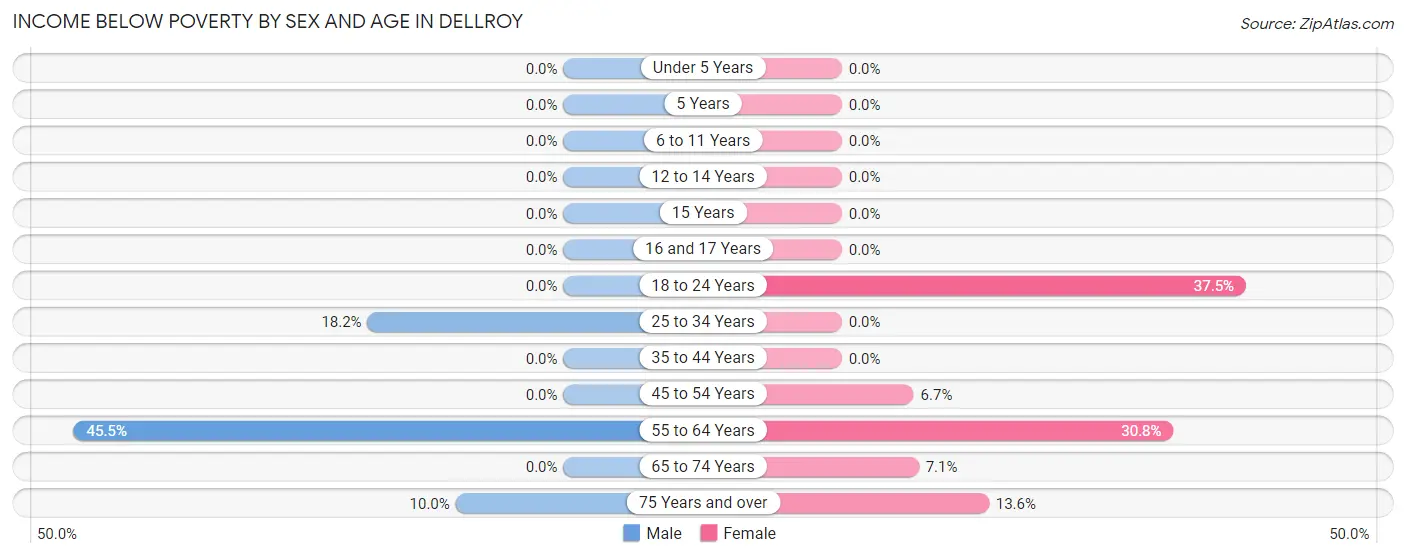
| Age Bracket | Male | Female |
| Under 5 Years | 0 (0.0%) | 0 (0.0%) |
| 5 Years | 0 (0.0%) | 0 (0.0%) |
| 6 to 11 Years | 0 (0.0%) | 0 (0.0%) |
| 12 to 14 Years | 0 (0.0%) | 0 (0.0%) |
| 15 Years | 0 (0.0%) | 0 (0.0%) |
| 16 and 17 Years | 0 (0.0%) | 0 (0.0%) |
| 18 to 24 Years | 0 (0.0%) | 3 (37.5%) |
| 25 to 34 Years | 2 (18.2%) | 0 (0.0%) |
| 35 to 44 Years | 0 (0.0%) | 0 (0.0%) |
| 45 to 54 Years | 0 (0.0%) | 2 (6.7%) |
| 55 to 64 Years | 10 (45.5%) | 4 (30.8%) |
| 65 to 74 Years | 0 (0.0%) | 1 (7.1%) |
| 75 Years and over | 1 (10.0%) | 3 (13.6%) |
| Total | 13 (9.2%) | 13 (9.1%) |
Income Above Poverty by Sex and Age in Dellroy
According to the poverty statistics in Dellroy, males aged 5 years and females aged under 5 years are the age groups that are most secure financially, with 100.0% of males and 100.0% of females in these age groups living above the poverty line.
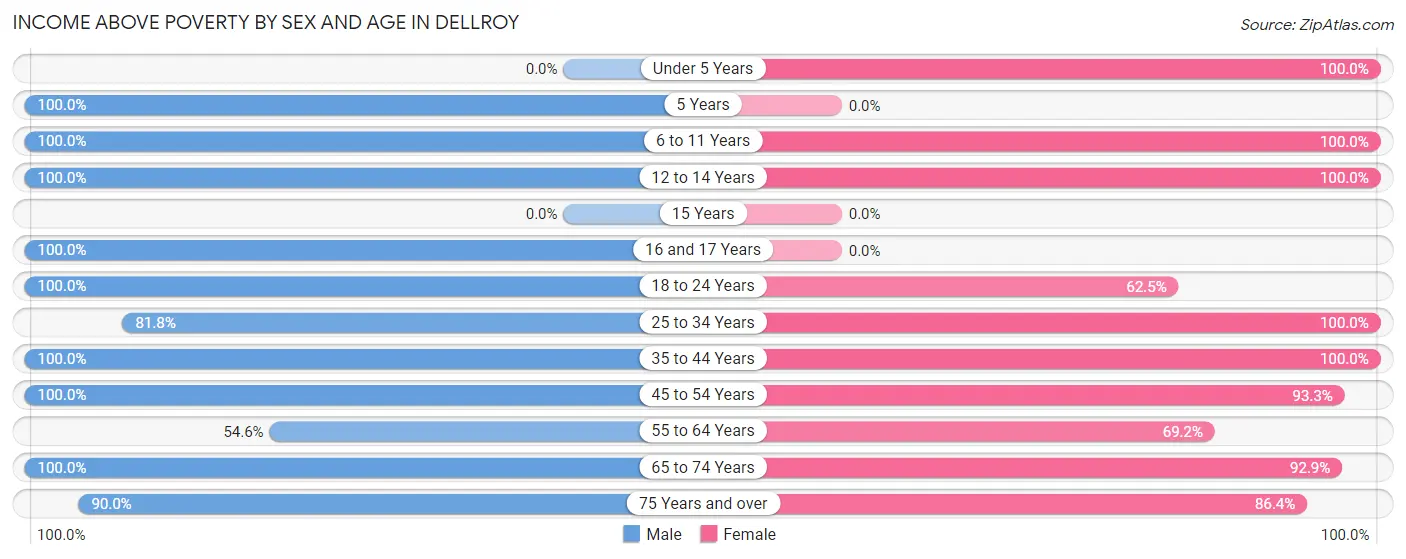
| Age Bracket | Male | Female |
| Under 5 Years | 0 (0.0%) | 4 (100.0%) |
| 5 Years | 6 (100.0%) | 0 (0.0%) |
| 6 to 11 Years | 12 (100.0%) | 6 (100.0%) |
| 12 to 14 Years | 6 (100.0%) | 15 (100.0%) |
| 15 Years | 0 (0.0%) | 0 (0.0%) |
| 16 and 17 Years | 8 (100.0%) | 0 (0.0%) |
| 18 to 24 Years | 6 (100.0%) | 5 (62.5%) |
| 25 to 34 Years | 9 (81.8%) | 24 (100.0%) |
| 35 to 44 Years | 21 (100.0%) | 6 (100.0%) |
| 45 to 54 Years | 22 (100.0%) | 28 (93.3%) |
| 55 to 64 Years | 12 (54.5%) | 9 (69.2%) |
| 65 to 74 Years | 17 (100.0%) | 13 (92.9%) |
| 75 Years and over | 9 (90.0%) | 19 (86.4%) |
| Total | 128 (90.8%) | 129 (90.8%) |
Income Below Poverty Among Married-Couple Families in Dellroy
The poverty statistics for married-couple families in Dellroy show that 8.5% or 5 of the total 59 families live below the poverty line. Families with no children have the highest poverty rate of 11.6%, comprising of 5 families. On the other hand, families with 1 or 2 children have the lowest poverty rate of 0.0%, which includes 0 families.
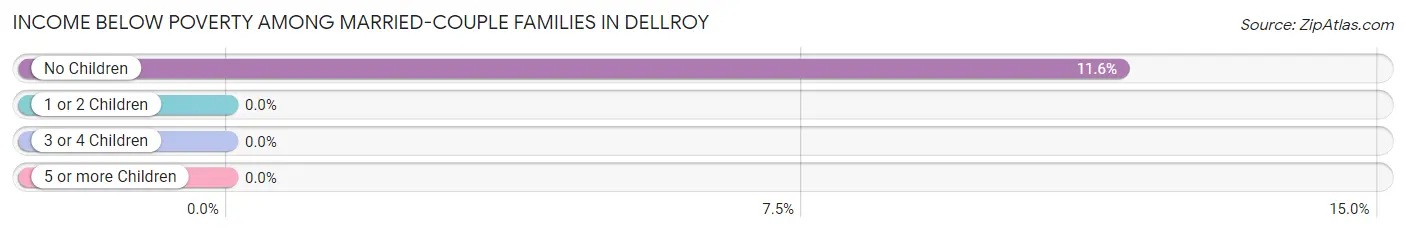
| Children | Above Poverty | Below Poverty |
| No Children | 38 (88.4%) | 5 (11.6%) |
| 1 or 2 Children | 11 (100.0%) | 0 (0.0%) |
| 3 or 4 Children | 5 (100.0%) | 0 (0.0%) |
| 5 or more Children | 0 (0.0%) | 0 (0.0%) |
| Total | 54 (91.5%) | 5 (8.5%) |
Income Below Poverty Among Single-Parent Households in Dellroy
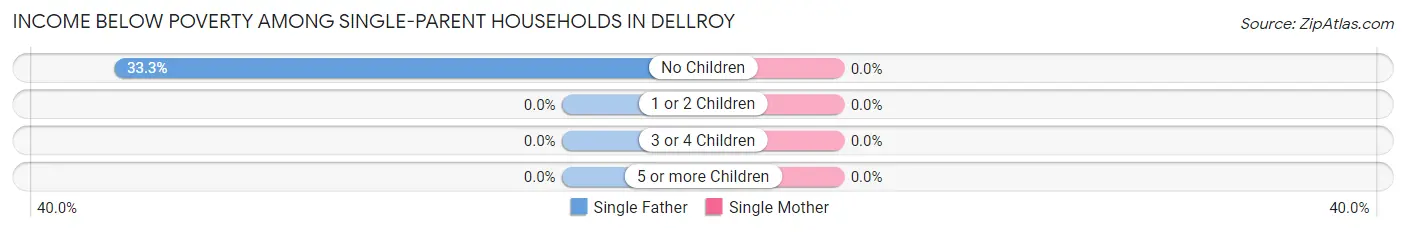
| Children | Single Father | Single Mother |
| No Children | 2 (33.3%) | 0 (0.0%) |
| 1 or 2 Children | 0 (0.0%) | 0 (0.0%) |
| 3 or 4 Children | 0 (0.0%) | 0 (0.0%) |
| 5 or more Children | 0 (0.0%) | 0 (0.0%) |
| Total | 2 (15.4%) | 0 (0.0%) |
Income Below Poverty Among Married-Couple vs Single-Parent Households in Dellroy
The poverty data for Dellroy shows that 5 of the married-couple family households (8.5%) and 2 of the single-parent households (7.4%) are living below the poverty level. Within the married-couple family households, those with no children have the highest poverty rate, with 5 households (11.6%) falling below the poverty line. Among the single-parent households, those with no children have the highest poverty rate, with 2 household (18.2%) living below poverty.
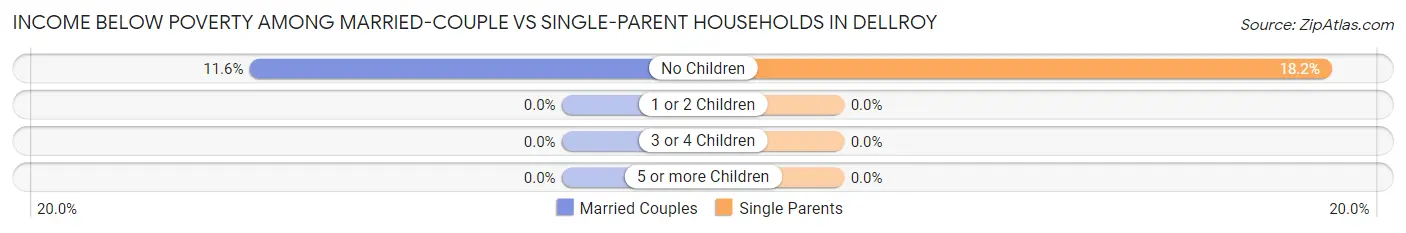
| Children | Married-Couple Families | Single-Parent Households |
| No Children | 5 (11.6%) | 2 (18.2%) |
| 1 or 2 Children | 0 (0.0%) | 0 (0.0%) |
| 3 or 4 Children | 0 (0.0%) | 0 (0.0%) |
| 5 or more Children | 0 (0.0%) | 0 (0.0%) |
| Total | 5 (8.5%) | 2 (7.4%) |
Race in Dellroy
The most populous races in Dellroy are White / Caucasian (272 | 94.8%), Two or more Races (15 | 5.2%), and Hispanic or Latino (13 | 4.5%).
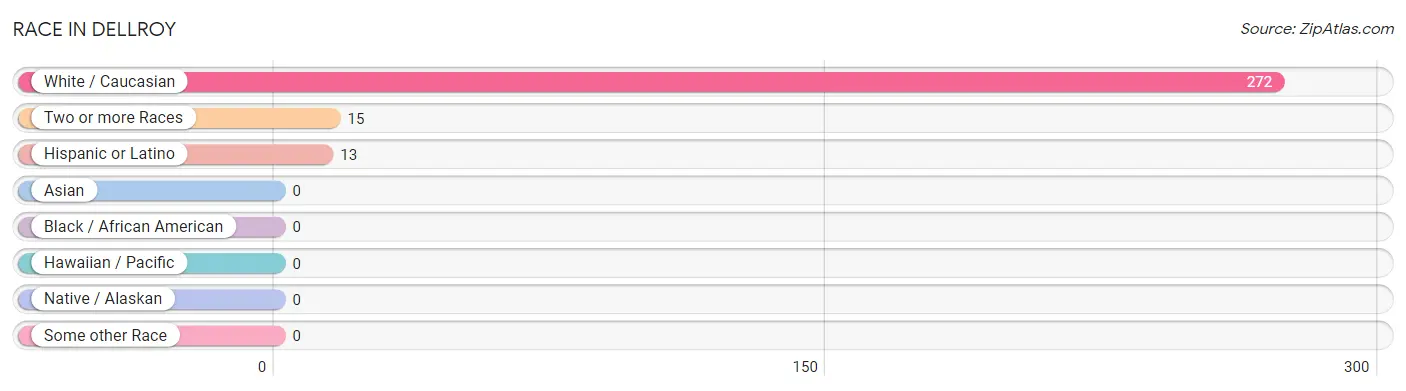
| Race | # Population | % Population |
| Asian | 0 | 0.0% |
| Black / African American | 0 | 0.0% |
| Hawaiian / Pacific | 0 | 0.0% |
| Hispanic or Latino | 13 | 4.5% |
| Native / Alaskan | 0 | 0.0% |
| White / Caucasian | 272 | 94.8% |
| Two or more Races | 15 | 5.2% |
| Some other Race | 0 | 0.0% |
| Total | 287 | 100.0% |
Ancestry in Dellroy
The most populous ancestries reported in Dellroy are German (130 | 45.3%), Irish (54 | 18.8%), Scotch-Irish (19 | 6.6%), English (15 | 5.2%), and French (15 | 5.2%), together accounting for 81.2% of all Dellroy residents.
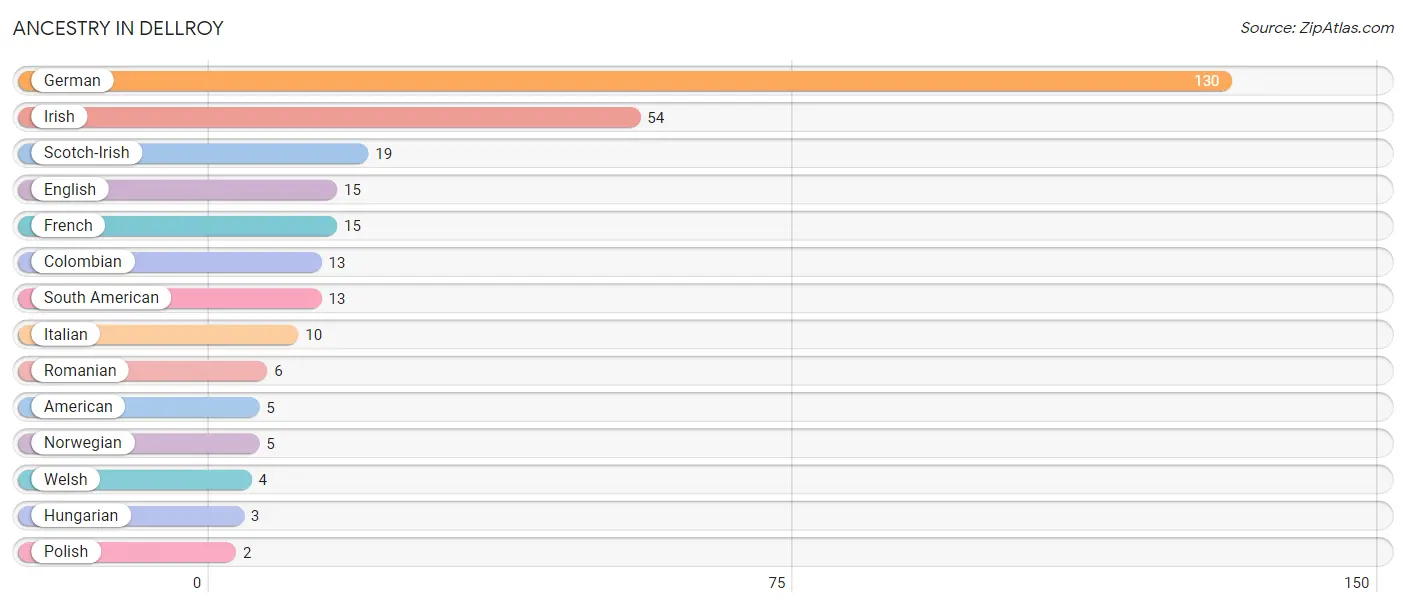
| Ancestry | # Population | % Population |
| American | 5 | 1.7% |
| Colombian | 13 | 4.5% |
| English | 15 | 5.2% |
| French | 15 | 5.2% |
| German | 130 | 45.3% |
| Hungarian | 3 | 1.1% |
| Irish | 54 | 18.8% |
| Italian | 10 | 3.5% |
| Norwegian | 5 | 1.7% |
| Polish | 2 | 0.7% |
| Romanian | 6 | 2.1% |
| Scotch-Irish | 19 | 6.6% |
| South American | 13 | 4.5% |
| Welsh | 4 | 1.4% | View All 14 Rows |
Immigrants in Dellroy

| Immigration Origin | # Population | % Population | View All 0 Rows |
Sex and Age in Dellroy
Sex and Age in Dellroy
The most populous age groups in Dellroy are 50 to 54 Years (21 | 14.5%) for men and 45 to 49 Years (26 | 18.3%) for women.
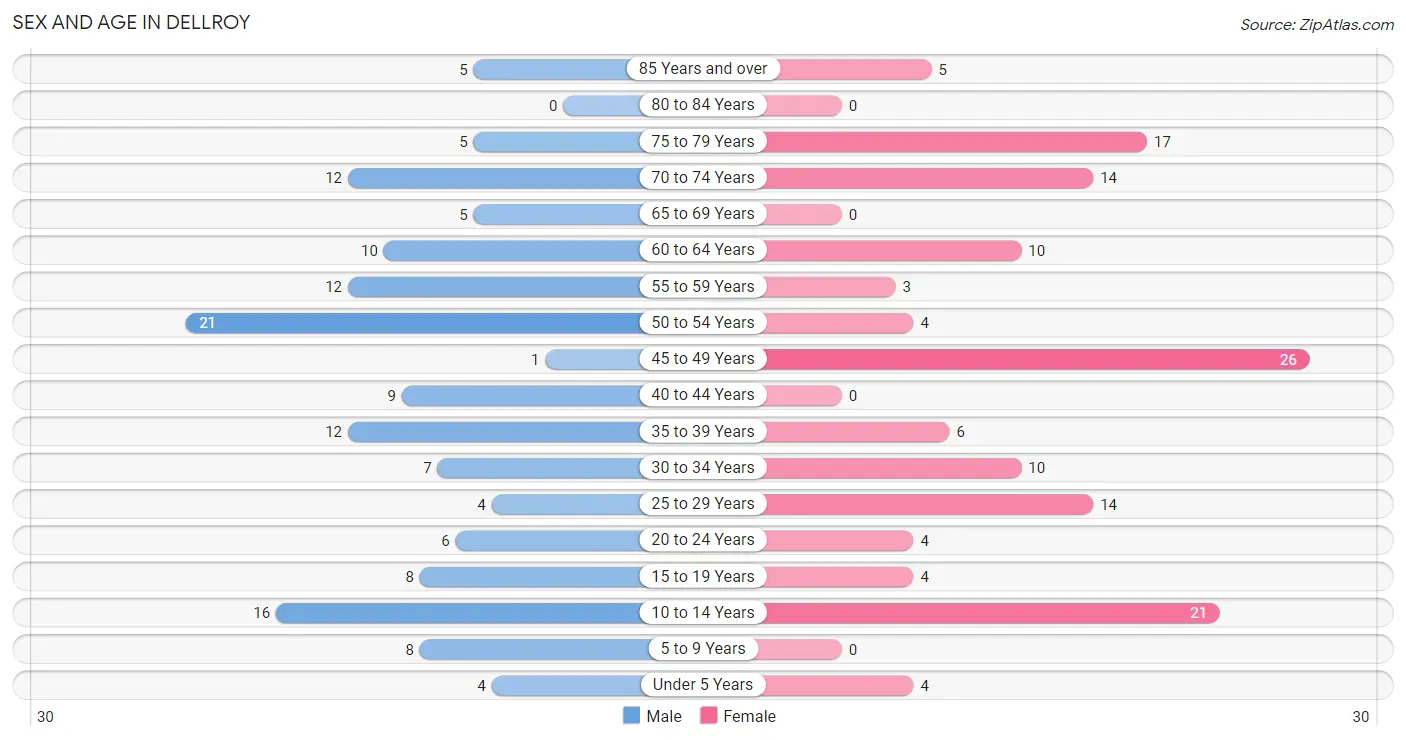
| Age Bracket | Male | Female |
| Under 5 Years | 4 (2.8%) | 4 (2.8%) |
| 5 to 9 Years | 8 (5.5%) | 0 (0.0%) |
| 10 to 14 Years | 16 (11.0%) | 21 (14.8%) |
| 15 to 19 Years | 8 (5.5%) | 4 (2.8%) |
| 20 to 24 Years | 6 (4.1%) | 4 (2.8%) |
| 25 to 29 Years | 4 (2.8%) | 14 (9.9%) |
| 30 to 34 Years | 7 (4.8%) | 10 (7.0%) |
| 35 to 39 Years | 12 (8.3%) | 6 (4.2%) |
| 40 to 44 Years | 9 (6.2%) | 0 (0.0%) |
| 45 to 49 Years | 1 (0.7%) | 26 (18.3%) |
| 50 to 54 Years | 21 (14.5%) | 4 (2.8%) |
| 55 to 59 Years | 12 (8.3%) | 3 (2.1%) |
| 60 to 64 Years | 10 (6.9%) | 10 (7.0%) |
| 65 to 69 Years | 5 (3.5%) | 0 (0.0%) |
| 70 to 74 Years | 12 (8.3%) | 14 (9.9%) |
| 75 to 79 Years | 5 (3.5%) | 17 (12.0%) |
| 80 to 84 Years | 0 (0.0%) | 0 (0.0%) |
| 85 Years and over | 5 (3.5%) | 5 (3.5%) |
| Total | 145 (100.0%) | 142 (100.0%) |
Families and Households in Dellroy
Median Family Size in Dellroy
The median family size in Dellroy is 2.74 persons per family, with married-couple families (59 | 68.6%) accounting for the largest median family size of 2.9 persons per family. On the other hand, single male/father families (13 | 15.1%) represent the smallest median family size with 1.92 persons per family.
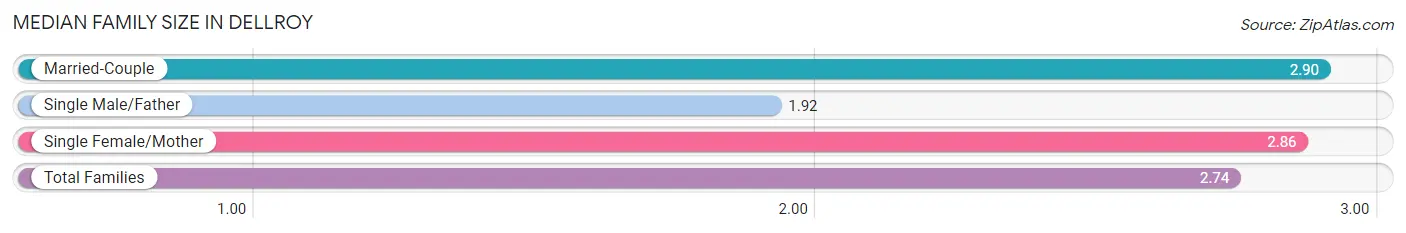
| Family Type | # Families | Family Size |
| Married-Couple | 59 (68.6%) | 2.90 |
| Single Male/Father | 13 (15.1%) | 1.92 |
| Single Female/Mother | 14 (16.3%) | 2.86 |
| Total Families | 86 (100.0%) | 2.74 |
Median Household Size in Dellroy
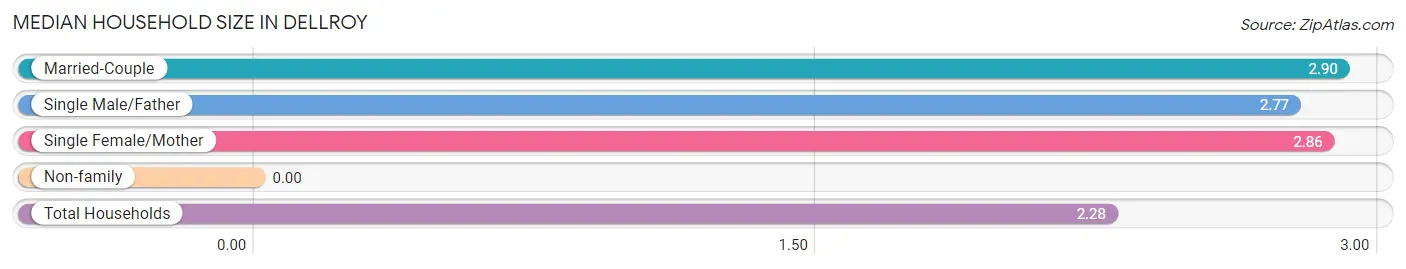
| Household Type | # Households | Household Size |
| Married-Couple | 59 (46.8%) | 2.90 |
| Single Male/Father | 13 (10.3%) | 2.77 |
| Single Female/Mother | 14 (11.1%) | 2.86 |
| Non-family | 40 (31.8%) | - |
| Total Households | 126 (100.0%) | 2.28 |
Household Size by Marriage Status in Dellroy
Out of a total of 126 households in Dellroy, 86 (68.2%) are family households, while 40 (31.8%) are nonfamily households. The most numerous type of family households are 2-person households, comprising 50, and the most common type of nonfamily households are 1-person households, comprising 40.
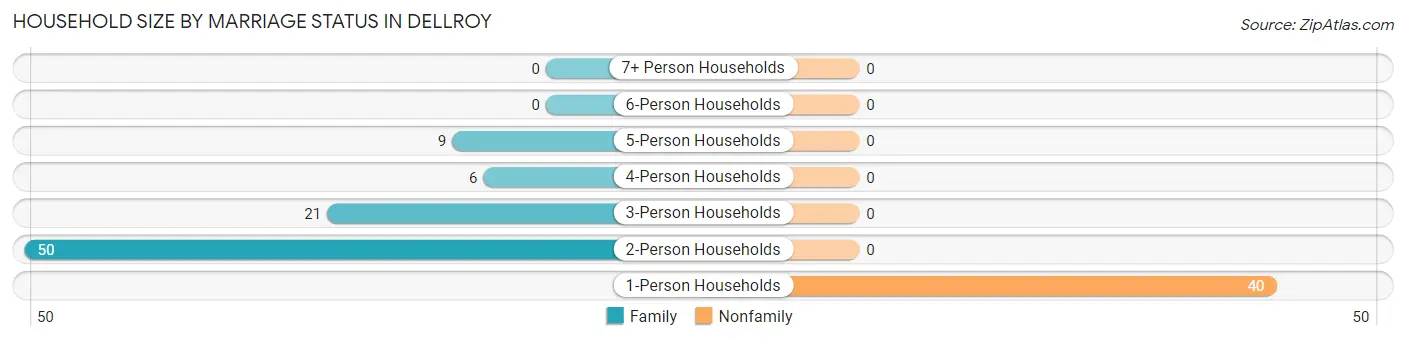
| Household Size | Family Households | Nonfamily Households |
| 1-Person Households | - | 40 (31.8%) |
| 2-Person Households | 50 (39.7%) | 0 (0.0%) |
| 3-Person Households | 21 (16.7%) | 0 (0.0%) |
| 4-Person Households | 6 (4.8%) | 0 (0.0%) |
| 5-Person Households | 9 (7.1%) | 0 (0.0%) |
| 6-Person Households | 0 (0.0%) | 0 (0.0%) |
| 7+ Person Households | 0 (0.0%) | 0 (0.0%) |
| Total | 86 (68.2%) | 40 (31.8%) |
Female Fertility in Dellroy
Fertility by Age in Dellroy
Average fertility rate in Dellroy is 44.0 births per 1,000 women. Women in the age bracket of 15 to 19 years have the highest fertility rate with 750.0 births per 1,000 women. Women in the age bracket of 15 to 19 years acount for 100.0% of all women with births.
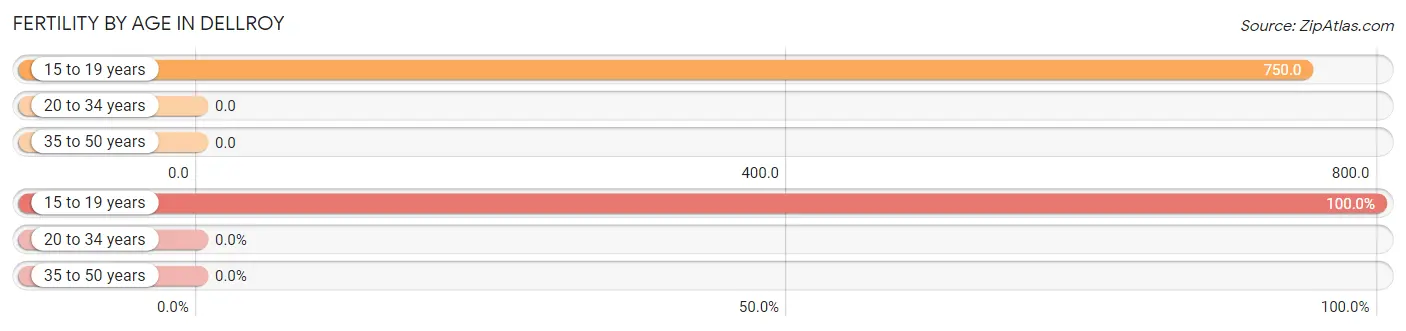
| Age Bracket | Women with Births | Births / 1,000 Women |
| 15 to 19 years | 3 (100.0%) | 750.0 |
| 20 to 34 years | 0 (0.0%) | 0.0 |
| 35 to 50 years | 0 (0.0%) | 0.0 |
| Total | 3 (100.0%) | 44.0 |
Fertility by Age by Marriage Status in Dellroy
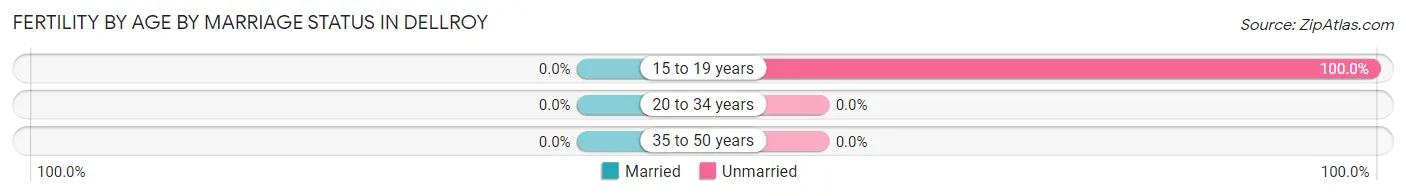
| Age Bracket | Married | Unmarried |
| 15 to 19 years | 0 (0.0%) | 3 (100.0%) |
| 20 to 34 years | 0 (0.0%) | 0 (0.0%) |
| 35 to 50 years | 0 (0.0%) | 0 (0.0%) |
| Total | 0 (0.0%) | 3 (100.0%) |
Fertility by Education in Dellroy
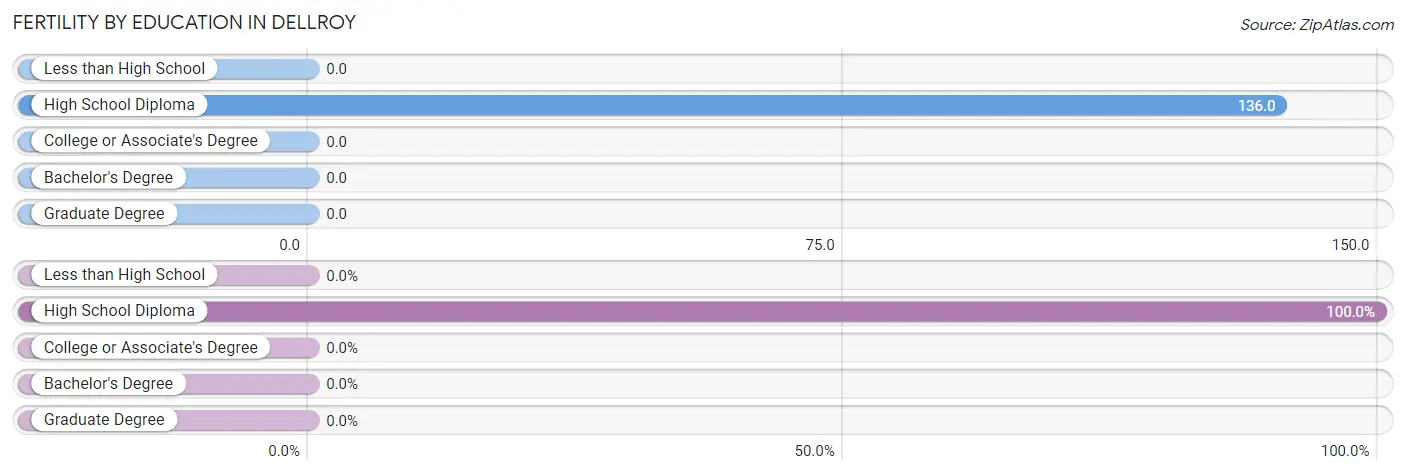
| Educational Attainment | Women with Births | Births / 1,000 Women |
| Less than High School | 0 (0.0%) | 0.0 |
| High School Diploma | 3 (100.0%) | 136.0 |
| College or Associate's Degree | 0 (0.0%) | 0.0 |
| Bachelor's Degree | 0 (0.0%) | 0.0 |
| Graduate Degree | 0 (0.0%) | 0.0 |
| Total | 3 (100.0%) | 44.0 |
Fertility by Education by Marriage Status in Dellroy
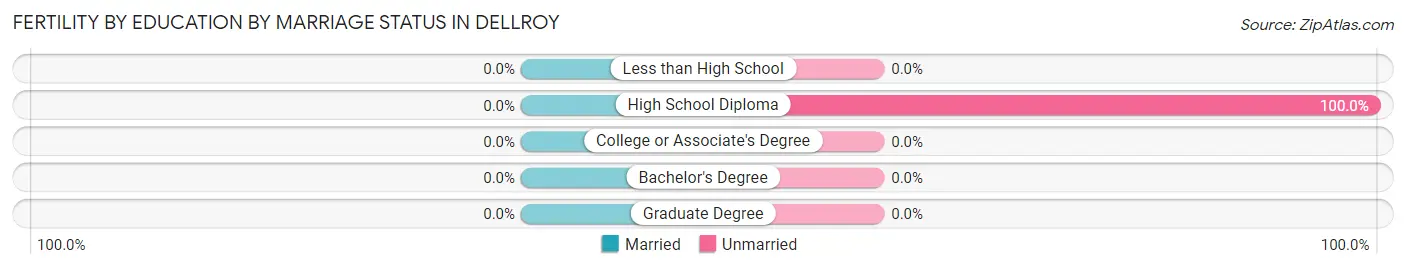
| Educational Attainment | Married | Unmarried |
| Less than High School | 0 (0.0%) | 0 (0.0%) |
| High School Diploma | 0 (0.0%) | 3 (100.0%) |
| College or Associate's Degree | 0 (0.0%) | 0 (0.0%) |
| Bachelor's Degree | 0 (0.0%) | 0 (0.0%) |
| Graduate Degree | 0 (0.0%) | 0 (0.0%) |
| Total | 0 (0.0%) | 3 (100.0%) |
Employment Characteristics in Dellroy
Employment by Class of Employer in Dellroy
Among the 110 employed individuals in Dellroy, private company employees (76 | 69.1%), not-for-profit organizations (16 | 14.5%), and local government employees (9 | 8.2%) make up the most common classes of employment.
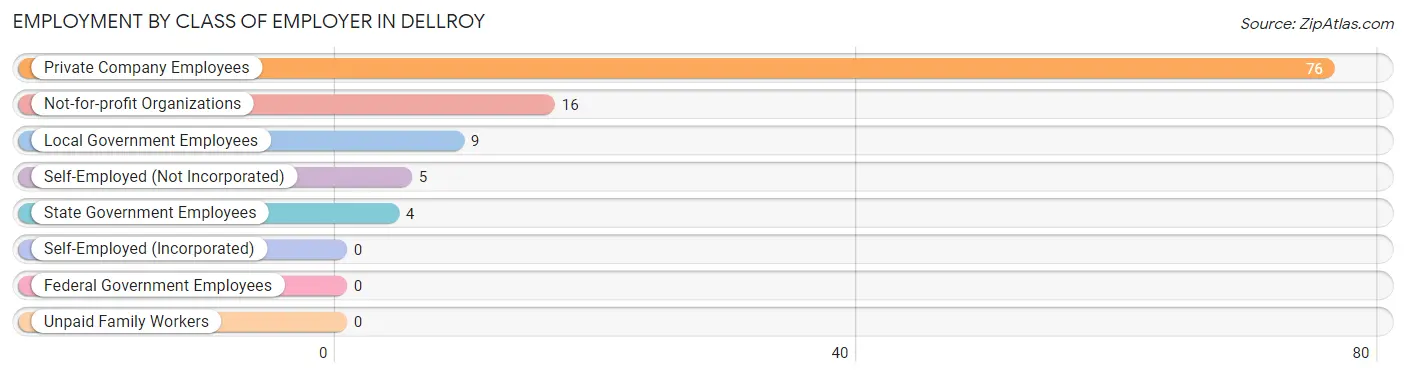
| Employer Class | # Employees | % Employees |
| Private Company Employees | 76 | 69.1% |
| Self-Employed (Incorporated) | 0 | 0.0% |
| Self-Employed (Not Incorporated) | 5 | 4.5% |
| Not-for-profit Organizations | 16 | 14.5% |
| Local Government Employees | 9 | 8.2% |
| State Government Employees | 4 | 3.6% |
| Federal Government Employees | 0 | 0.0% |
| Unpaid Family Workers | 0 | 0.0% |
| Total | 110 | 100.0% |
Employment Status by Age in Dellroy
According to the labor force statistics for Dellroy, out of the total population over 16 years of age (234), 48.7% or 114 individuals are in the labor force, with 2.6% or 3 of them unemployed. The age group with the highest labor force participation rate is 25 to 29 years, with 100.0% or 18 individuals in the labor force. Within the labor force, the 16 to 19 years age range has the highest percentage of unemployed individuals, with 25.0% or 1 of them being unemployed.
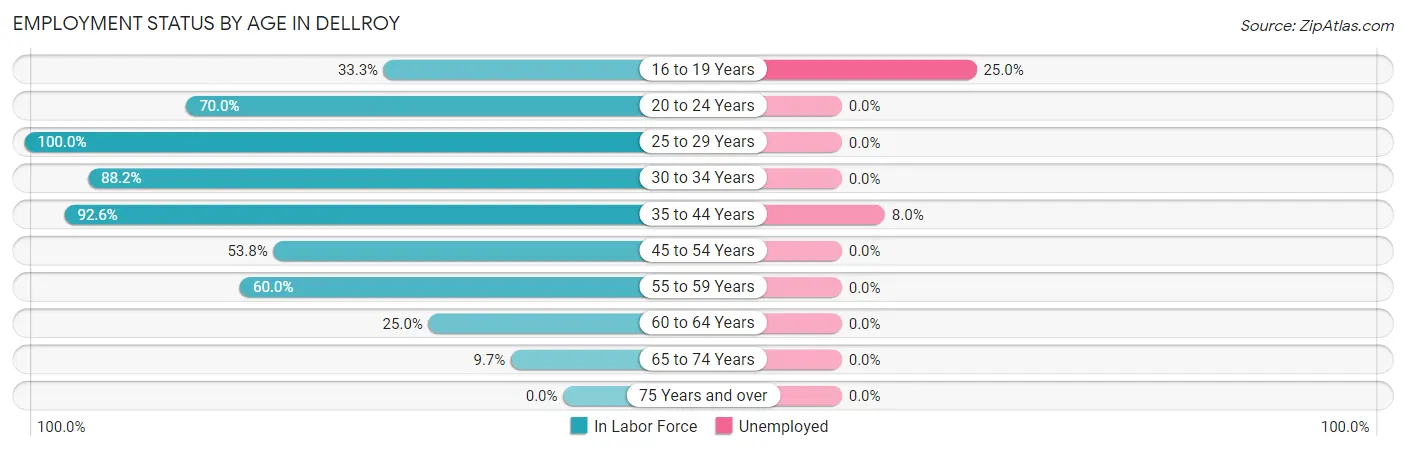
| Age Bracket | In Labor Force | Unemployed |
| 16 to 19 Years | 4 (33.3%) | 1 (25.0%) |
| 20 to 24 Years | 7 (70.0%) | 0 (0.0%) |
| 25 to 29 Years | 18 (100.0%) | 0 (0.0%) |
| 30 to 34 Years | 15 (88.2%) | 0 (0.0%) |
| 35 to 44 Years | 25 (92.6%) | 2 (8.0%) |
| 45 to 54 Years | 28 (53.8%) | 0 (0.0%) |
| 55 to 59 Years | 9 (60.0%) | 0 (0.0%) |
| 60 to 64 Years | 5 (25.0%) | 0 (0.0%) |
| 65 to 74 Years | 3 (9.7%) | 0 (0.0%) |
| 75 Years and over | 0 (0.0%) | 0 (0.0%) |
| Total | 114 (48.7%) | 3 (2.6%) |
Employment Status by Educational Attainment in Dellroy
According to labor force statistics for Dellroy, 67.1% of individuals (100) out of the total population between 25 and 64 years of age (149) are in the labor force, with 2.0% or 2 of them being unemployed. The group with the highest labor force participation rate are those with the educational attainment of bachelor's degree or higher, with 100.0% or 7 individuals in the labor force. Within the labor force, individuals with college / associate degree education have the highest percentage of unemployment, with 3.8% or 2 of them being unemployed.
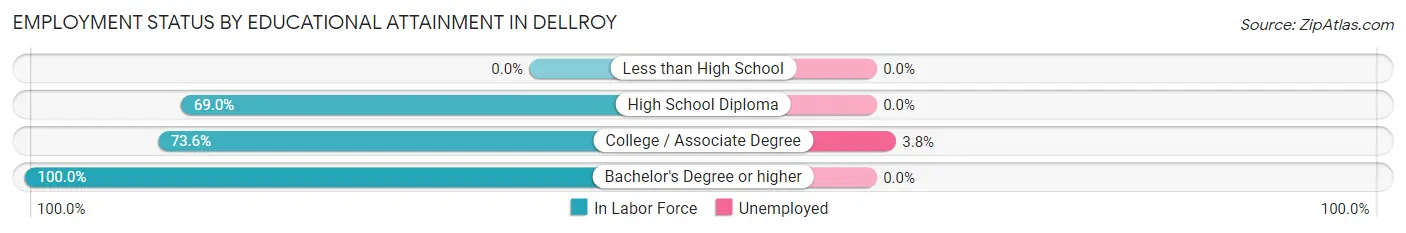
| Educational Attainment | In Labor Force | Unemployed |
| Less than High School | 0 (0.0%) | 0 (0.0%) |
| High School Diploma | 40 (69.0%) | 0 (0.0%) |
| College / Associate Degree | 53 (73.6%) | 3 (3.8%) |
| Bachelor's Degree or higher | 7 (100.0%) | 0 (0.0%) |
| Total | 100 (67.1%) | 3 (2.0%) |
Employment Occupations by Sex in Dellroy
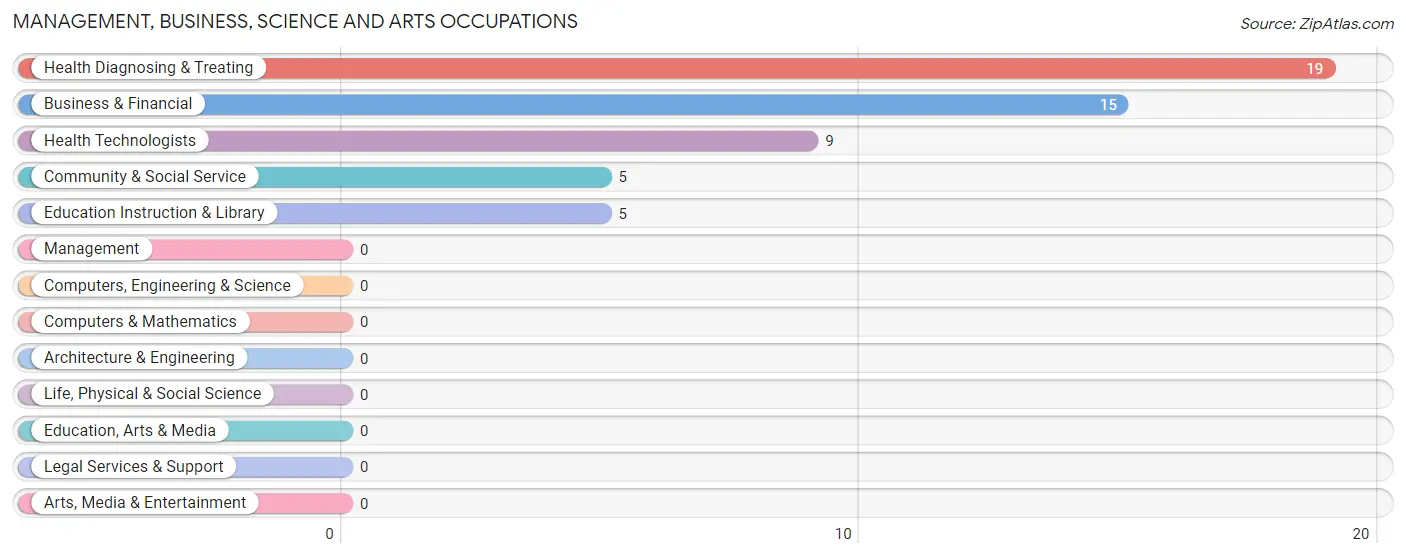
Management, Business, Science and Arts Occupations
The most common Management, Business, Science and Arts occupations in Dellroy are Health Diagnosing & Treating (19 | 17.1%), Business & Financial (15 | 13.5%), Health Technologists (9 | 8.1%), Community & Social Service (5 | 4.5%), and Education Instruction & Library (5 | 4.5%).
Management, Business, Science and Arts Occupations by Sex
Within the Management, Business, Science and Arts occupations in Dellroy, the most male-oriented occupations are Health Technologists (77.8%), Business & Financial (60.0%), and Health Diagnosing & Treating (36.8%), while the most female-oriented occupations are Community & Social Service (100.0%), Education Instruction & Library (100.0%), and Health Diagnosing & Treating (63.2%).
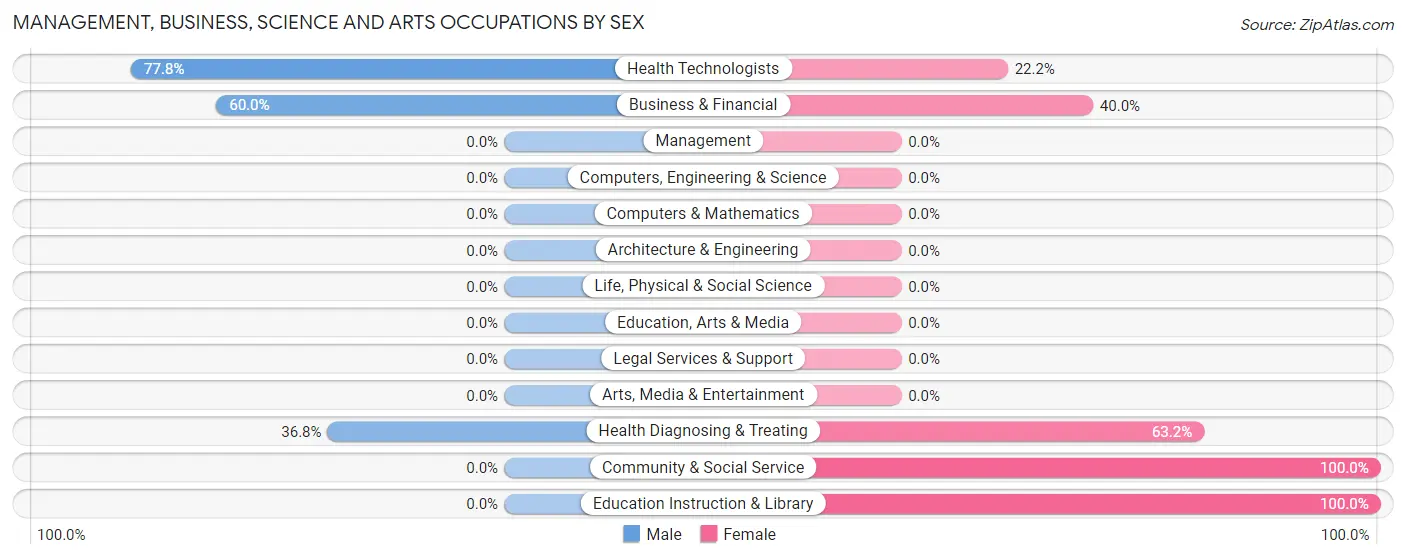
| Occupation | Male | Female |
| Management | 0 (0.0%) | 0 (0.0%) |
| Business & Financial | 9 (60.0%) | 6 (40.0%) |
| Computers, Engineering & Science | 0 (0.0%) | 0 (0.0%) |
| Computers & Mathematics | 0 (0.0%) | 0 (0.0%) |
| Architecture & Engineering | 0 (0.0%) | 0 (0.0%) |
| Life, Physical & Social Science | 0 (0.0%) | 0 (0.0%) |
| Community & Social Service | 0 (0.0%) | 5 (100.0%) |
| Education, Arts & Media | 0 (0.0%) | 0 (0.0%) |
| Legal Services & Support | 0 (0.0%) | 0 (0.0%) |
| Education Instruction & Library | 0 (0.0%) | 5 (100.0%) |
| Arts, Media & Entertainment | 0 (0.0%) | 0 (0.0%) |
| Health Diagnosing & Treating | 7 (36.8%) | 12 (63.2%) |
| Health Technologists | 7 (77.8%) | 2 (22.2%) |
| Total (Category) | 16 (41.0%) | 23 (59.0%) |
| Total (Overall) | 63 (56.8%) | 48 (43.2%) |
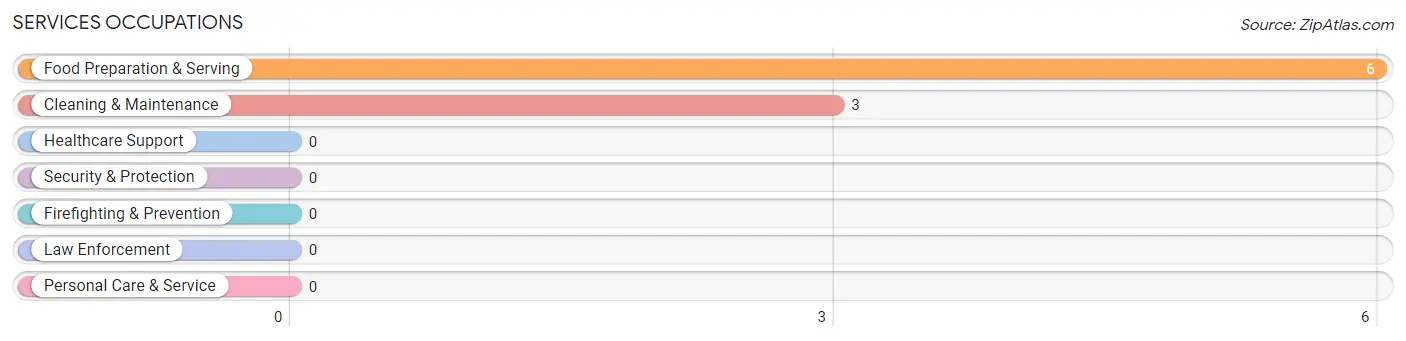
Services Occupations
The most common Services occupations in Dellroy are Food Preparation & Serving (6 | 5.4%), and Cleaning & Maintenance (3 | 2.7%).
Services Occupations by Sex
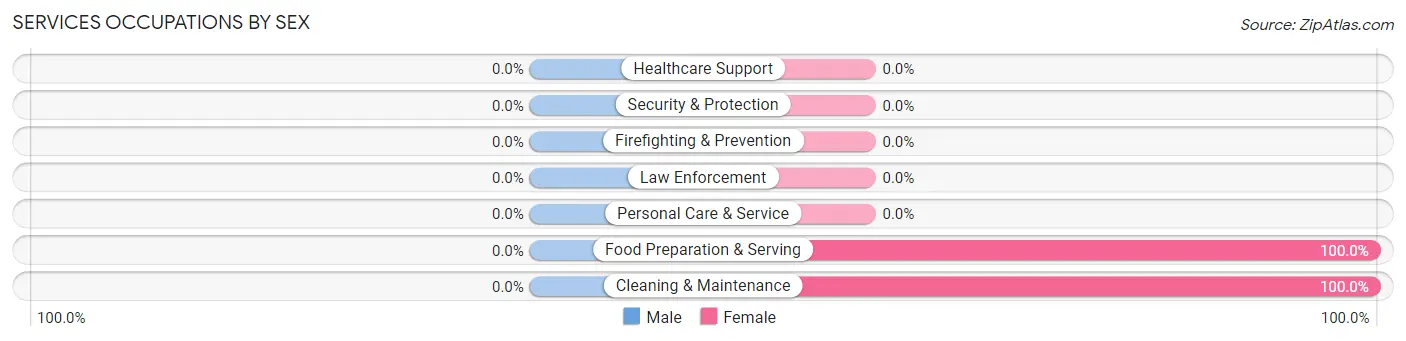
| Occupation | Male | Female |
| Healthcare Support | 0 (0.0%) | 0 (0.0%) |
| Security & Protection | 0 (0.0%) | 0 (0.0%) |
| Firefighting & Prevention | 0 (0.0%) | 0 (0.0%) |
| Law Enforcement | 0 (0.0%) | 0 (0.0%) |
| Food Preparation & Serving | 0 (0.0%) | 6 (100.0%) |
| Cleaning & Maintenance | 0 (0.0%) | 3 (100.0%) |
| Personal Care & Service | 0 (0.0%) | 0 (0.0%) |
| Total (Category) | 0 (0.0%) | 9 (100.0%) |
| Total (Overall) | 63 (56.8%) | 48 (43.2%) |
Sales and Office Occupations
The most common Sales and Office occupations in Dellroy are Office & Administration (17 | 15.3%), and Sales & Related (7 | 6.3%).

Sales and Office Occupations by Sex

| Occupation | Male | Female |
| Sales & Related | 0 (0.0%) | 7 (100.0%) |
| Office & Administration | 8 (47.1%) | 9 (52.9%) |
| Total (Category) | 8 (33.3%) | 16 (66.7%) |
| Total (Overall) | 63 (56.8%) | 48 (43.2%) |
Natural Resources, Construction and Maintenance Occupations
The most common Natural Resources, Construction and Maintenance occupations in Dellroy are Installation, Maintenance & Repair (7 | 6.3%), and Construction & Extraction (1 | 0.9%).
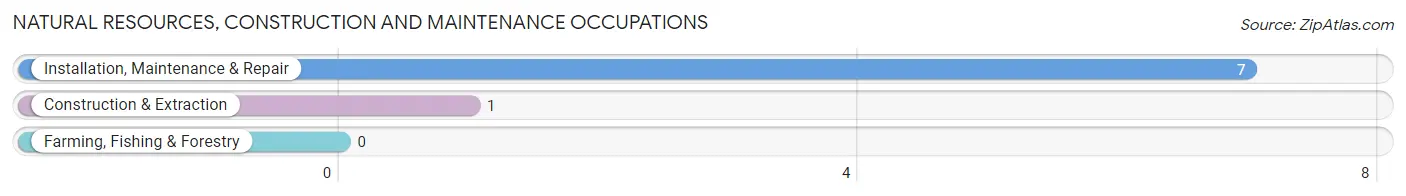
Natural Resources, Construction and Maintenance Occupations by Sex

| Occupation | Male | Female |
| Farming, Fishing & Forestry | 0 (0.0%) | 0 (0.0%) |
| Construction & Extraction | 1 (100.0%) | 0 (0.0%) |
| Installation, Maintenance & Repair | 7 (100.0%) | 0 (0.0%) |
| Total (Category) | 8 (100.0%) | 0 (0.0%) |
| Total (Overall) | 63 (56.8%) | 48 (43.2%) |
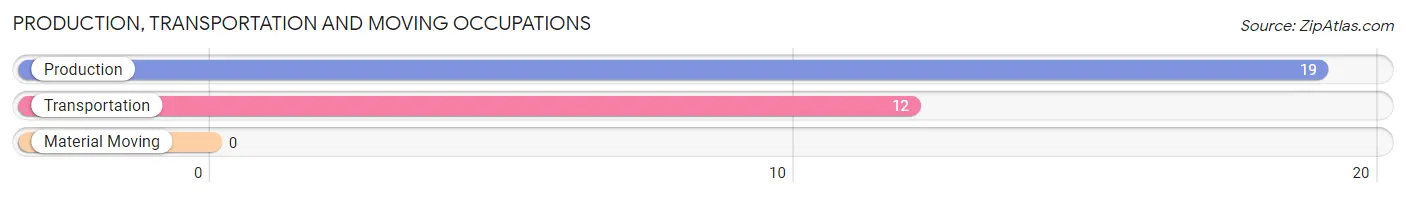
Production, Transportation and Moving Occupations
The most common Production, Transportation and Moving occupations in Dellroy are Production (19 | 17.1%), and Transportation (12 | 10.8%).
Production, Transportation and Moving Occupations by Sex
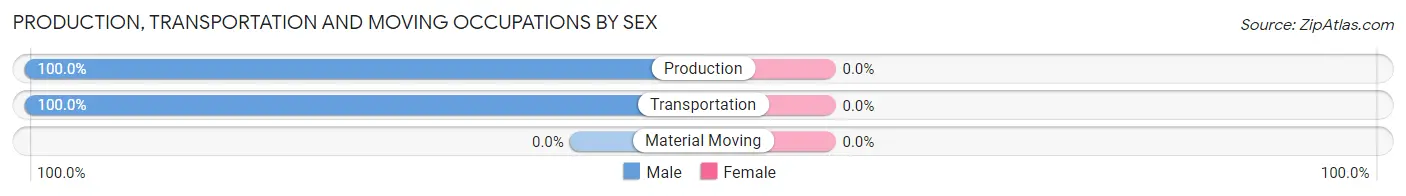
| Occupation | Male | Female |
| Production | 19 (100.0%) | 0 (0.0%) |
| Transportation | 12 (100.0%) | 0 (0.0%) |
| Material Moving | 0 (0.0%) | 0 (0.0%) |
| Total (Category) | 31 (100.0%) | 0 (0.0%) |
| Total (Overall) | 63 (56.8%) | 48 (43.2%) |
Employment Industries by Sex in Dellroy
Employment Industries in Dellroy
The major employment industries in Dellroy include Manufacturing (25 | 22.5%), Health Care & Social Assistance (24 | 21.6%), Retail Trade (23 | 20.7%), Public Administration (11 | 9.9%), and Professional & Scientific (9 | 8.1%).
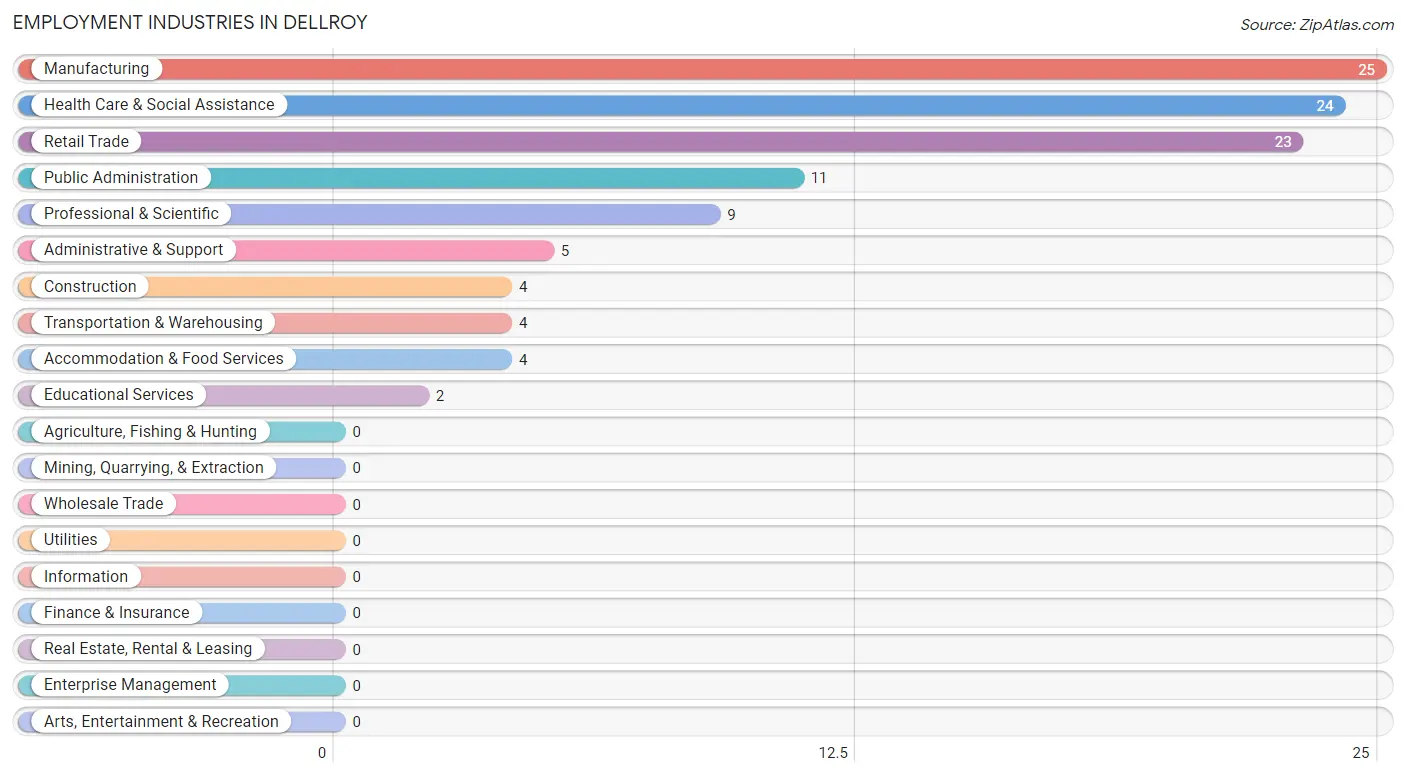
Employment Industries by Sex in Dellroy
The Dellroy industries that see more men than women are Manufacturing (100.0%), Transportation & Warehousing (100.0%), and Professional & Scientific (100.0%), whereas the industries that tend to have a higher number of women are Construction (100.0%), Educational Services (100.0%), and Health Care & Social Assistance (100.0%).
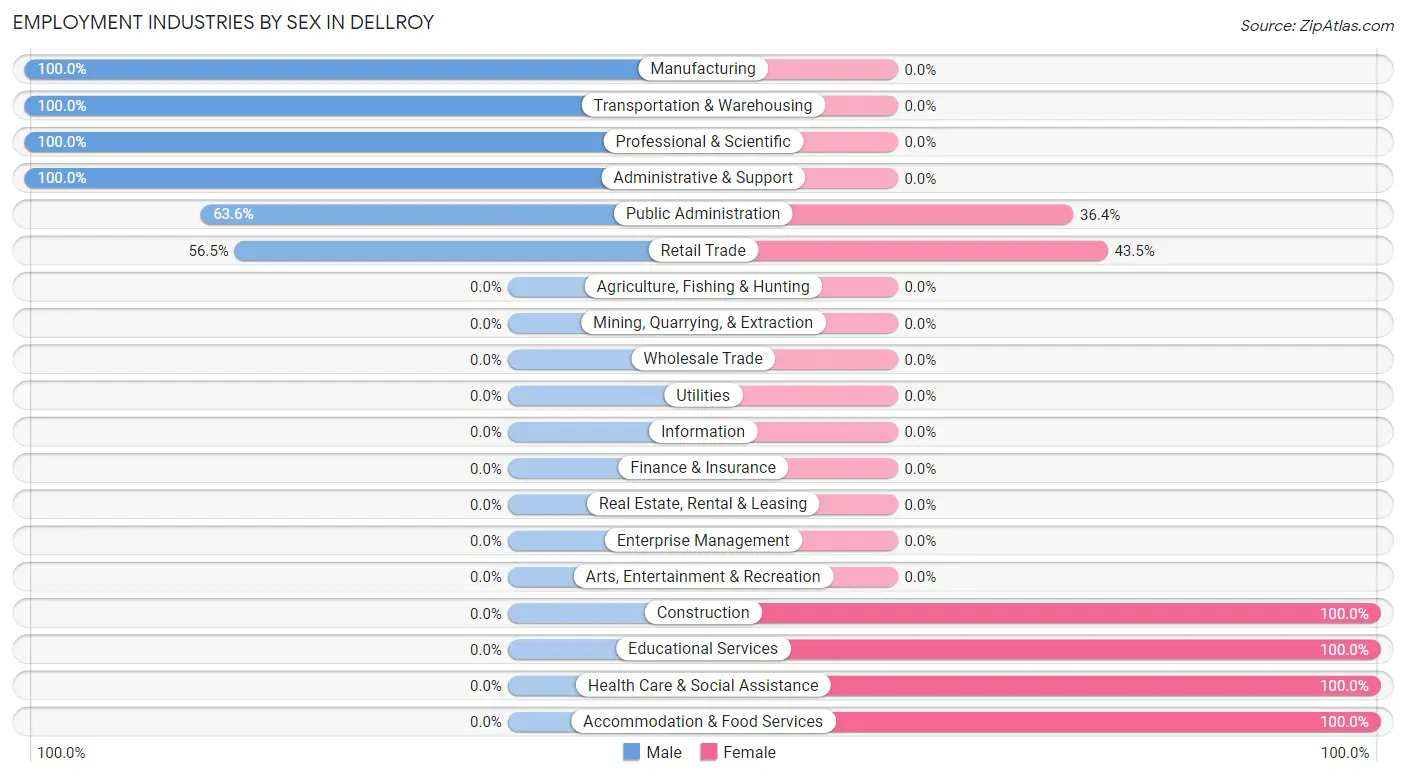
| Industry | Male | Female |
| Agriculture, Fishing & Hunting | 0 (0.0%) | 0 (0.0%) |
| Mining, Quarrying, & Extraction | 0 (0.0%) | 0 (0.0%) |
| Construction | 0 (0.0%) | 4 (100.0%) |
| Manufacturing | 25 (100.0%) | 0 (0.0%) |
| Wholesale Trade | 0 (0.0%) | 0 (0.0%) |
| Retail Trade | 13 (56.5%) | 10 (43.5%) |
| Transportation & Warehousing | 4 (100.0%) | 0 (0.0%) |
| Utilities | 0 (0.0%) | 0 (0.0%) |
| Information | 0 (0.0%) | 0 (0.0%) |
| Finance & Insurance | 0 (0.0%) | 0 (0.0%) |
| Real Estate, Rental & Leasing | 0 (0.0%) | 0 (0.0%) |
| Professional & Scientific | 9 (100.0%) | 0 (0.0%) |
| Enterprise Management | 0 (0.0%) | 0 (0.0%) |
| Administrative & Support | 5 (100.0%) | 0 (0.0%) |
| Educational Services | 0 (0.0%) | 2 (100.0%) |
| Health Care & Social Assistance | 0 (0.0%) | 24 (100.0%) |
| Arts, Entertainment & Recreation | 0 (0.0%) | 0 (0.0%) |
| Accommodation & Food Services | 0 (0.0%) | 4 (100.0%) |
| Public Administration | 7 (63.6%) | 4 (36.4%) |
| Total | 63 (56.8%) | 48 (43.2%) |
Education in Dellroy
School Enrollment in Dellroy
The most common levels of schooling among the 72 students in Dellroy are middle school (27 | 37.5%), elementary school (12 | 16.7%), and high school (12 | 16.7%).
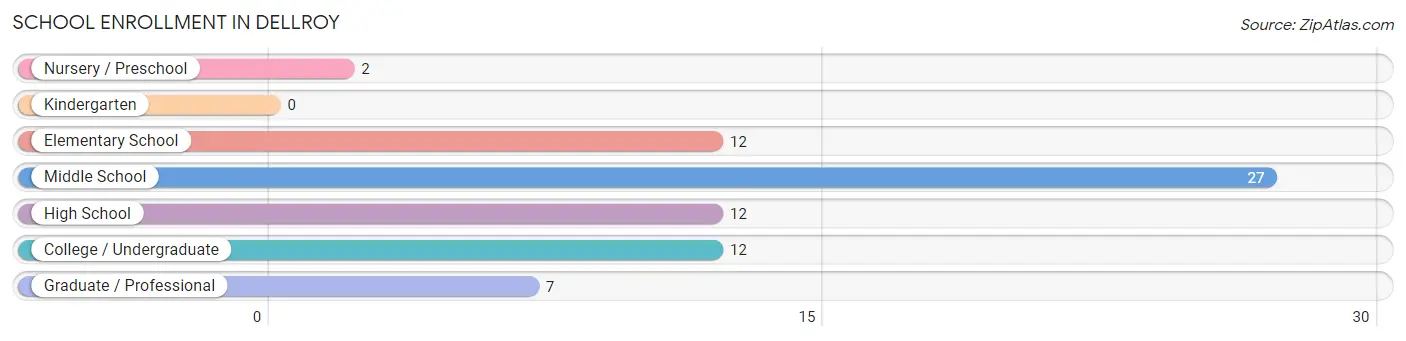
| School Level | # Students | % Students |
| Nursery / Preschool | 2 | 2.8% |
| Kindergarten | 0 | 0.0% |
| Elementary School | 12 | 16.7% |
| Middle School | 27 | 37.5% |
| High School | 12 | 16.7% |
| College / Undergraduate | 12 | 16.7% |
| Graduate / Professional | 7 | 9.7% |
| Total | 72 | 100.0% |
School Enrollment by Age by Funding Source in Dellroy
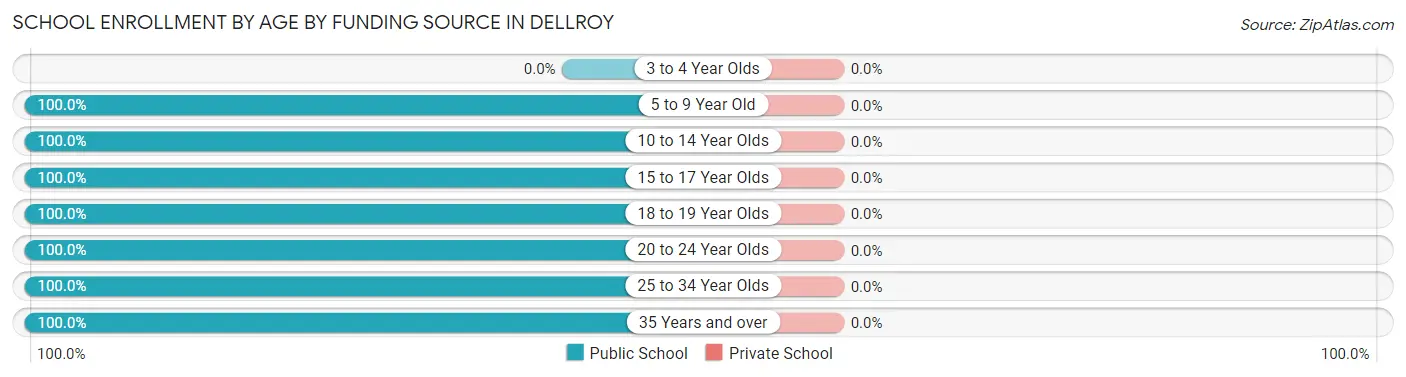
| Age Bracket | Public School | Private School |
| 3 to 4 Year Olds | 0 (0.0%) | 0 (0.0%) |
| 5 to 9 Year Old | 4 (100.0%) | 0 (0.0%) |
| 10 to 14 Year Olds | 37 (100.0%) | 0 (0.0%) |
| 15 to 17 Year Olds | 8 (100.0%) | 0 (0.0%) |
| 18 to 19 Year Olds | 1 (100.0%) | 0 (0.0%) |
| 20 to 24 Year Olds | 8 (100.0%) | 0 (0.0%) |
| 25 to 34 Year Olds | 7 (100.0%) | 0 (0.0%) |
| 35 Years and over | 7 (100.0%) | 0 (0.0%) |
| Total | 72 (100.0%) | 0 (0.0%) |
Educational Attainment by Field of Study in Dellroy
Business (5 | 41.7%), education (5 | 41.7%), and science & technology (2 | 16.7%) are the most common fields of study among 12 individuals in Dellroy who have obtained a bachelor's degree or higher.
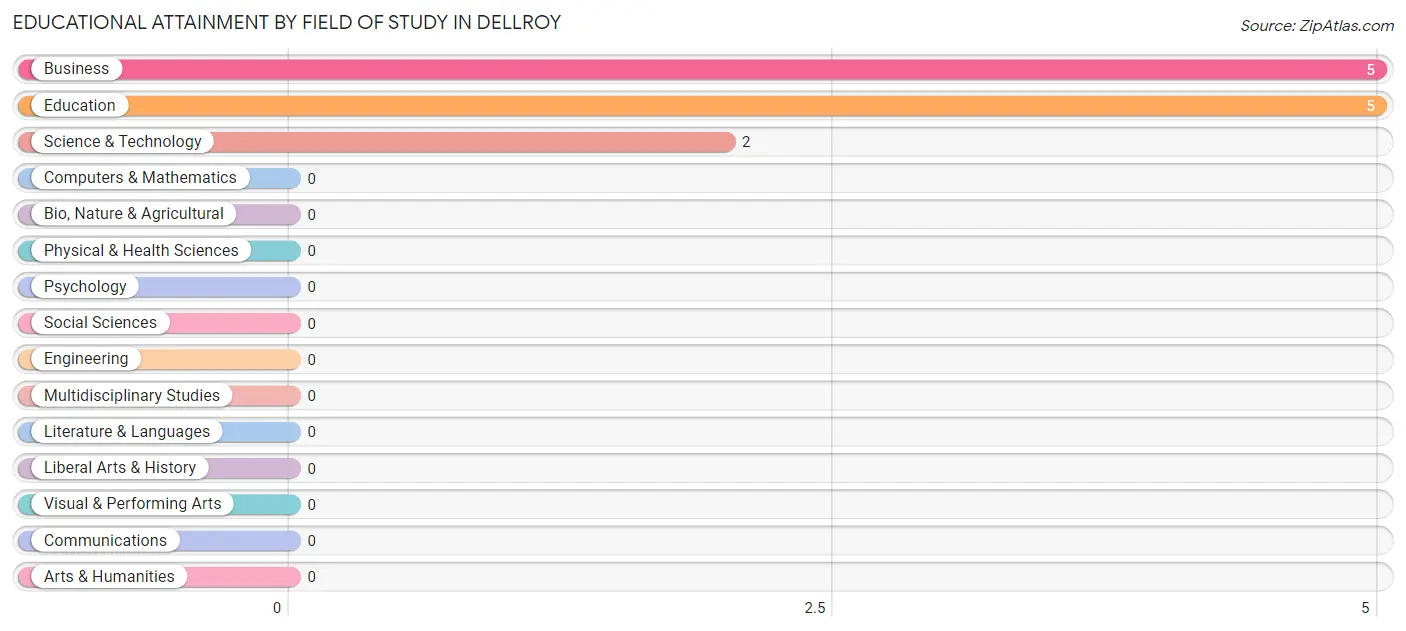
| Field of Study | # Graduates | % Graduates |
| Computers & Mathematics | 0 | 0.0% |
| Bio, Nature & Agricultural | 0 | 0.0% |
| Physical & Health Sciences | 0 | 0.0% |
| Psychology | 0 | 0.0% |
| Social Sciences | 0 | 0.0% |
| Engineering | 0 | 0.0% |
| Multidisciplinary Studies | 0 | 0.0% |
| Science & Technology | 2 | 16.7% |
| Business | 5 | 41.7% |
| Education | 5 | 41.7% |
| Literature & Languages | 0 | 0.0% |
| Liberal Arts & History | 0 | 0.0% |
| Visual & Performing Arts | 0 | 0.0% |
| Communications | 0 | 0.0% |
| Arts & Humanities | 0 | 0.0% |
| Total | 12 | 100.0% |
Transportation & Commute in Dellroy
Vehicle Availability by Sex in Dellroy
The most prevalent vehicle ownership categories in Dellroy are males with 2 vehicles (31, accounting for 50.0%) and females with 2 vehicles (27, making up 64.6%).
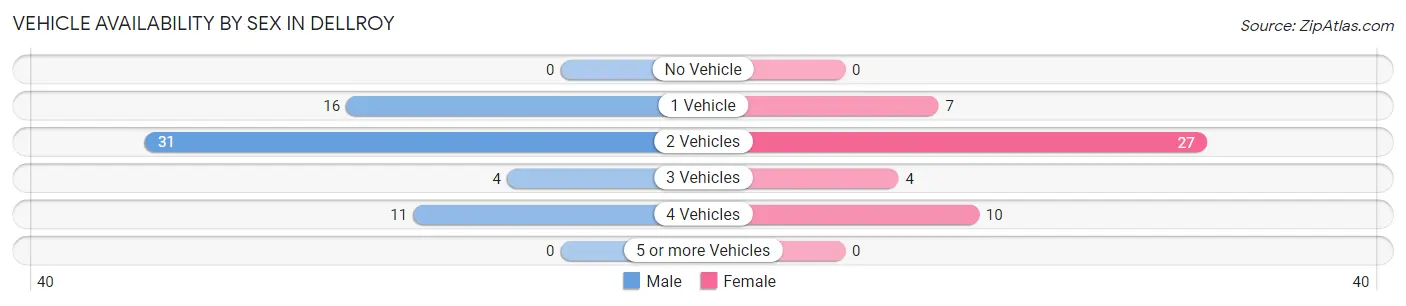
| Vehicles Available | Male | Female |
| No Vehicle | 0 (0.0%) | 0 (0.0%) |
| 1 Vehicle | 16 (25.8%) | 7 (14.6%) |
| 2 Vehicles | 31 (50.0%) | 27 (56.2%) |
| 3 Vehicles | 4 (6.5%) | 4 (8.3%) |
| 4 Vehicles | 11 (17.7%) | 10 (20.8%) |
| 5 or more Vehicles | 0 (0.0%) | 0 (0.0%) |
| Total | 62 (100.0%) | 48 (100.0%) |
Commute Time in Dellroy
The most frequently occuring commute durations in Dellroy are 40 to 44 minutes (25 commuters, 22.9%), 15 to 19 minutes (18 commuters, 16.5%), and 45 to 59 minutes (15 commuters, 13.8%).
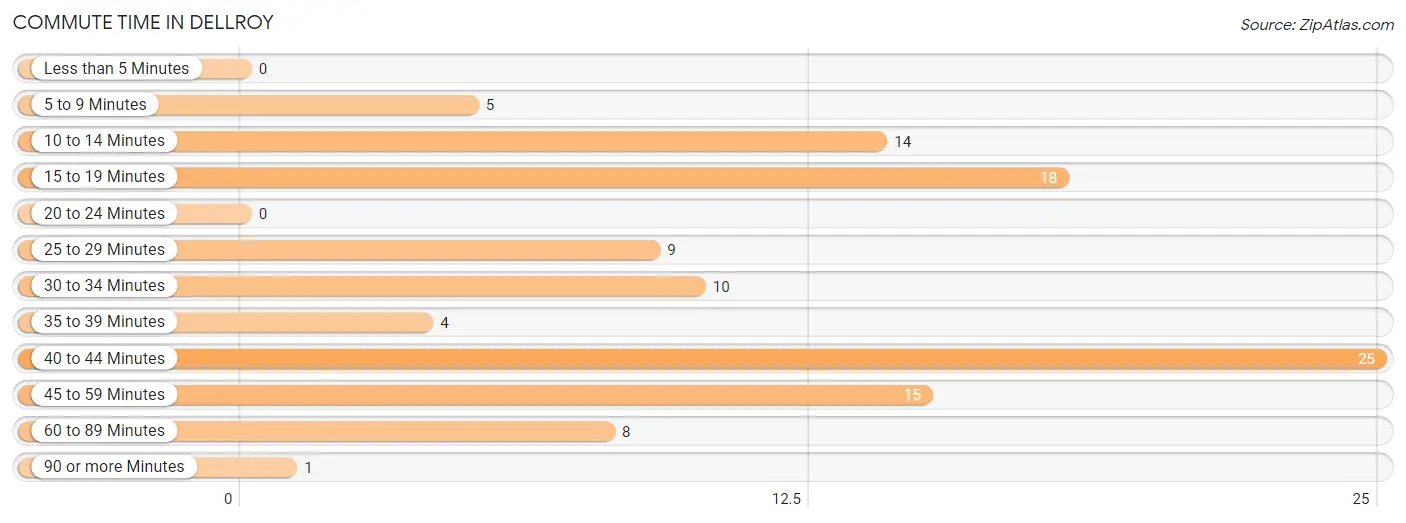
| Commute Time | # Commuters | % Commuters |
| Less than 5 Minutes | 0 | 0.0% |
| 5 to 9 Minutes | 5 | 4.6% |
| 10 to 14 Minutes | 14 | 12.8% |
| 15 to 19 Minutes | 18 | 16.5% |
| 20 to 24 Minutes | 0 | 0.0% |
| 25 to 29 Minutes | 9 | 8.3% |
| 30 to 34 Minutes | 10 | 9.2% |
| 35 to 39 Minutes | 4 | 3.7% |
| 40 to 44 Minutes | 25 | 22.9% |
| 45 to 59 Minutes | 15 | 13.8% |
| 60 to 89 Minutes | 8 | 7.3% |
| 90 or more Minutes | 1 | 0.9% |
Commute Time by Sex in Dellroy
The most common commute times in Dellroy are 10 to 14 minutes (11 commuters, 17.7%) for males and 40 to 44 minutes (18 commuters, 38.3%) for females.
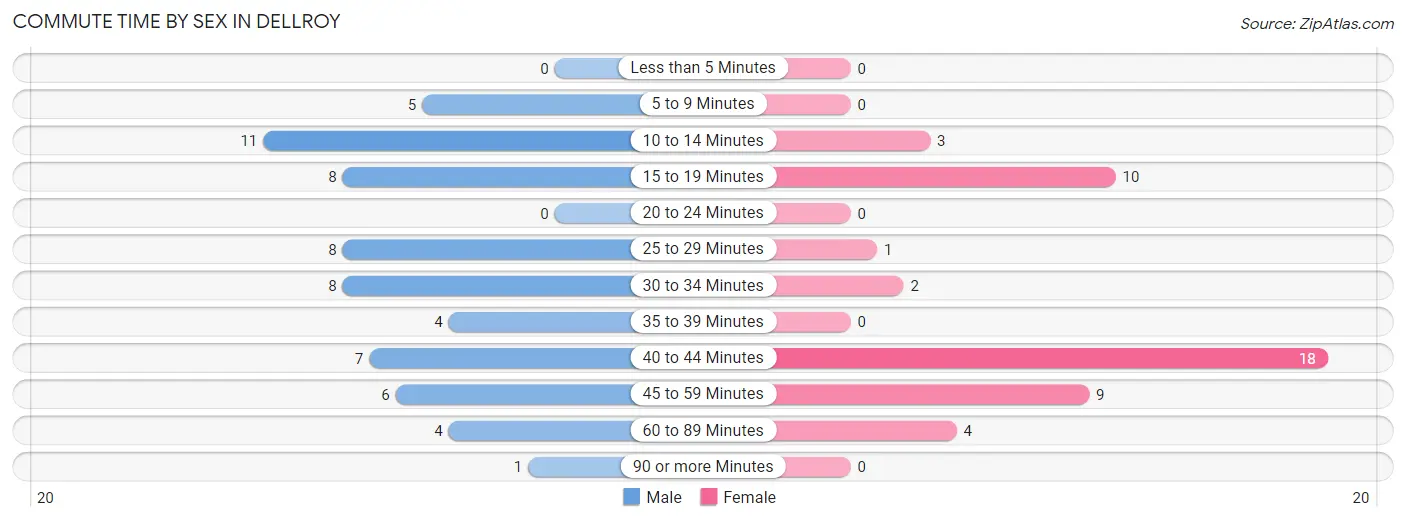
| Commute Time | Male | Female |
| Less than 5 Minutes | 0 (0.0%) | 0 (0.0%) |
| 5 to 9 Minutes | 5 (8.1%) | 0 (0.0%) |
| 10 to 14 Minutes | 11 (17.7%) | 3 (6.4%) |
| 15 to 19 Minutes | 8 (12.9%) | 10 (21.3%) |
| 20 to 24 Minutes | 0 (0.0%) | 0 (0.0%) |
| 25 to 29 Minutes | 8 (12.9%) | 1 (2.1%) |
| 30 to 34 Minutes | 8 (12.9%) | 2 (4.3%) |
| 35 to 39 Minutes | 4 (6.5%) | 0 (0.0%) |
| 40 to 44 Minutes | 7 (11.3%) | 18 (38.3%) |
| 45 to 59 Minutes | 6 (9.7%) | 9 (19.2%) |
| 60 to 89 Minutes | 4 (6.5%) | 4 (8.5%) |
| 90 or more Minutes | 1 (1.6%) | 0 (0.0%) |
Time of Departure to Work by Sex in Dellroy
The most frequent times of departure to work in Dellroy are 7:00 AM to 7:29 AM (19, 30.6%) for males and 4:00 PM to 11:59 PM (8, 17.0%) for females.
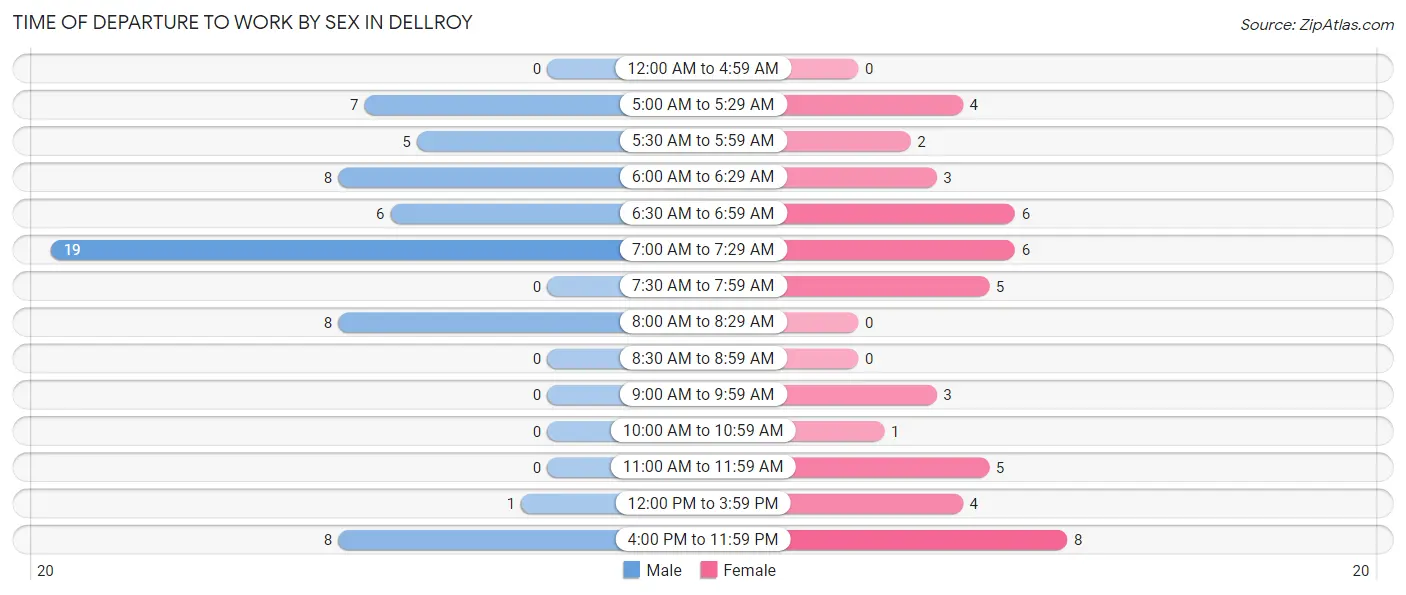
| Time of Departure | Male | Female |
| 12:00 AM to 4:59 AM | 0 (0.0%) | 0 (0.0%) |
| 5:00 AM to 5:29 AM | 7 (11.3%) | 4 (8.5%) |
| 5:30 AM to 5:59 AM | 5 (8.1%) | 2 (4.3%) |
| 6:00 AM to 6:29 AM | 8 (12.9%) | 3 (6.4%) |
| 6:30 AM to 6:59 AM | 6 (9.7%) | 6 (12.8%) |
| 7:00 AM to 7:29 AM | 19 (30.6%) | 6 (12.8%) |
| 7:30 AM to 7:59 AM | 0 (0.0%) | 5 (10.6%) |
| 8:00 AM to 8:29 AM | 8 (12.9%) | 0 (0.0%) |
| 8:30 AM to 8:59 AM | 0 (0.0%) | 0 (0.0%) |
| 9:00 AM to 9:59 AM | 0 (0.0%) | 3 (6.4%) |
| 10:00 AM to 10:59 AM | 0 (0.0%) | 1 (2.1%) |
| 11:00 AM to 11:59 AM | 0 (0.0%) | 5 (10.6%) |
| 12:00 PM to 3:59 PM | 1 (1.6%) | 4 (8.5%) |
| 4:00 PM to 11:59 PM | 8 (12.9%) | 8 (17.0%) |
| Total | 62 (100.0%) | 47 (100.0%) |
Housing Occupancy in Dellroy
Occupancy by Ownership in Dellroy
Of the total 126 dwellings in Dellroy, owner-occupied units account for 81 (64.3%), while renter-occupied units make up 45 (35.7%).
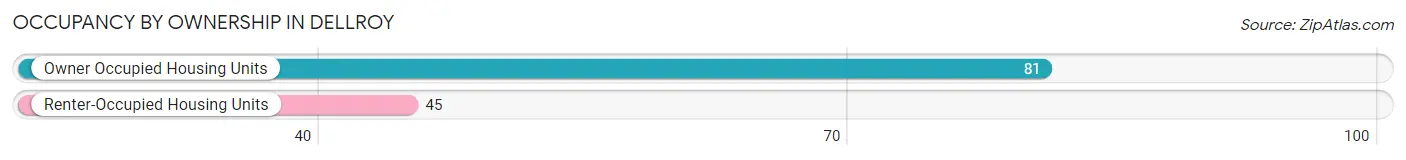
| Occupancy | # Housing Units | % Housing Units |
| Owner Occupied Housing Units | 81 | 64.3% |
| Renter-Occupied Housing Units | 45 | 35.7% |
| Total Occupied Housing Units | 126 | 100.0% |
Occupancy by Household Size in Dellroy
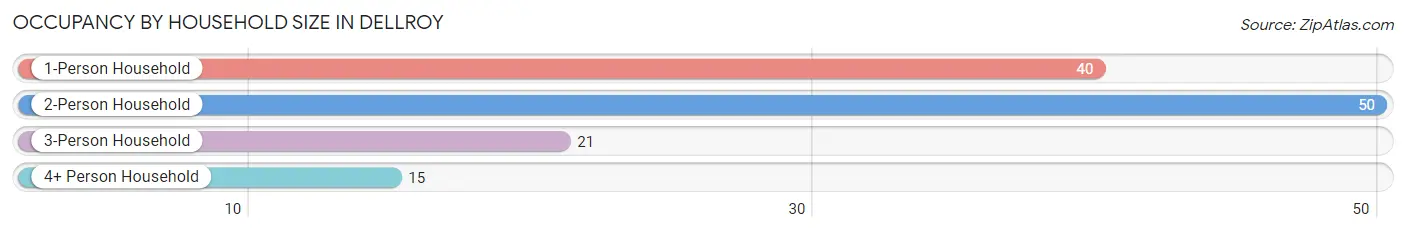
| Household Size | # Housing Units | % Housing Units |
| 1-Person Household | 40 | 31.8% |
| 2-Person Household | 50 | 39.7% |
| 3-Person Household | 21 | 16.7% |
| 4+ Person Household | 15 | 11.9% |
| Total Housing Units | 126 | 100.0% |
Occupancy by Ownership by Household Size in Dellroy
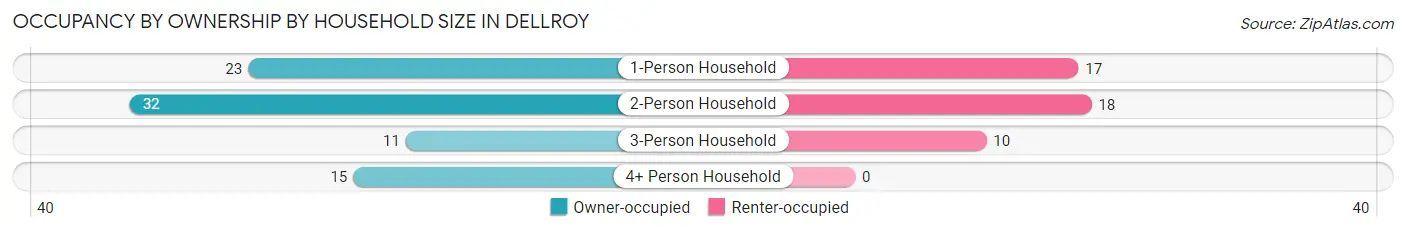
| Household Size | Owner-occupied | Renter-occupied |
| 1-Person Household | 23 (57.5%) | 17 (42.5%) |
| 2-Person Household | 32 (64.0%) | 18 (36.0%) |
| 3-Person Household | 11 (52.4%) | 10 (47.6%) |
| 4+ Person Household | 15 (100.0%) | 0 (0.0%) |
| Total Housing Units | 81 (64.3%) | 45 (35.7%) |
Occupancy by Educational Attainment in Dellroy
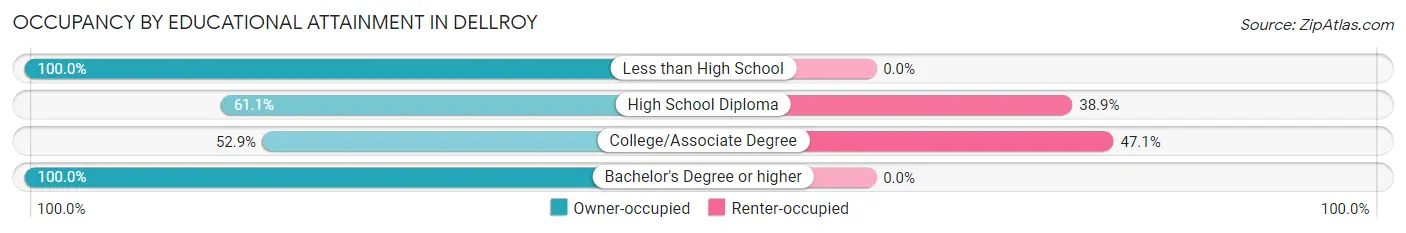
| Household Size | Owner-occupied | Renter-occupied |
| Less than High School | 16 (100.0%) | 0 (0.0%) |
| High School Diploma | 33 (61.1%) | 21 (38.9%) |
| College/Associate Degree | 27 (52.9%) | 24 (47.1%) |
| Bachelor's Degree or higher | 5 (100.0%) | 0 (0.0%) |
Occupancy by Age of Householder in Dellroy
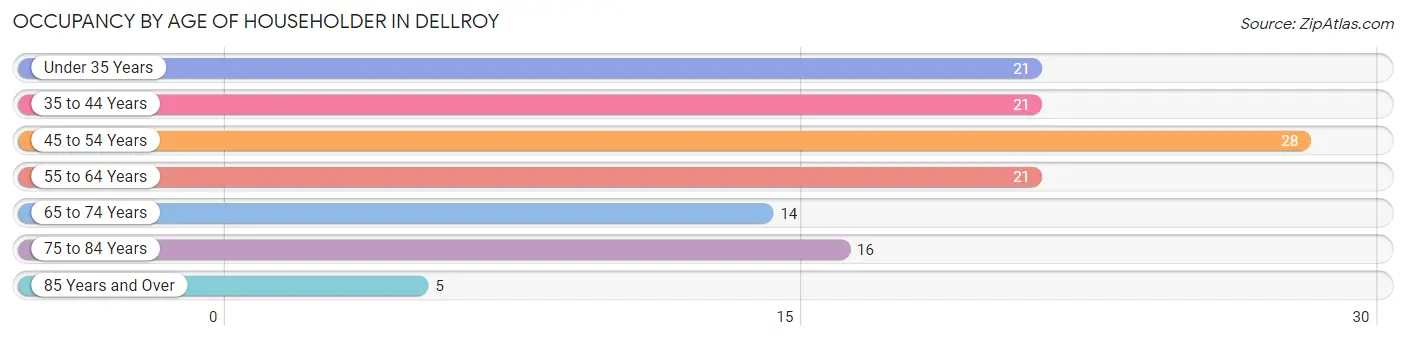
| Age Bracket | # Households | % Households |
| Under 35 Years | 21 | 16.7% |
| 35 to 44 Years | 21 | 16.7% |
| 45 to 54 Years | 28 | 22.2% |
| 55 to 64 Years | 21 | 16.7% |
| 65 to 74 Years | 14 | 11.1% |
| 75 to 84 Years | 16 | 12.7% |
| 85 Years and Over | 5 | 4.0% |
| Total | 126 | 100.0% |
Housing Finances in Dellroy
Median Income by Occupancy in Dellroy
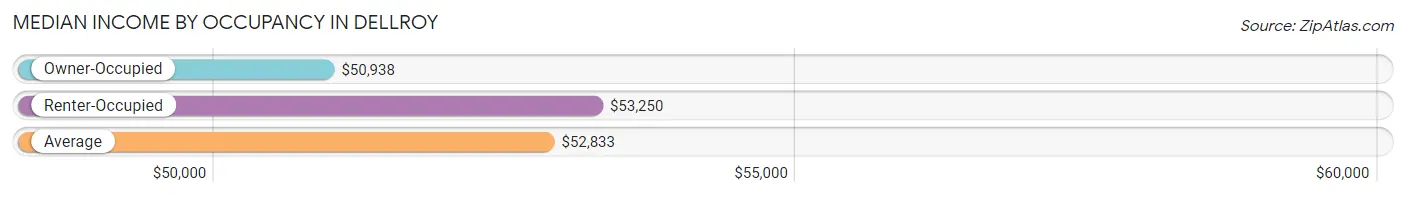
| Occupancy Type | # Households | Median Income |
| Owner-Occupied | 81 (64.3%) | $50,938 |
| Renter-Occupied | 45 (35.7%) | $53,250 |
| Average | 126 (100.0%) | $52,833 |
Occupancy by Householder Income Bracket in Dellroy
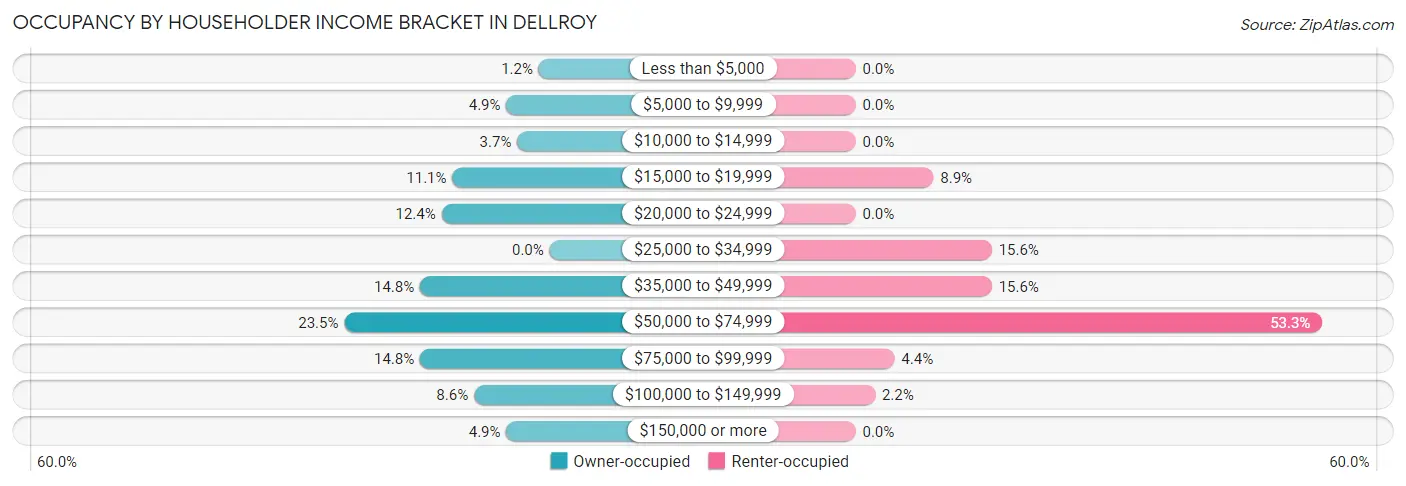
| Income Bracket | Owner-occupied | Renter-occupied |
| Less than $5,000 | 1 (1.2%) | 0 (0.0%) |
| $5,000 to $9,999 | 4 (4.9%) | 0 (0.0%) |
| $10,000 to $14,999 | 3 (3.7%) | 0 (0.0%) |
| $15,000 to $19,999 | 9 (11.1%) | 4 (8.9%) |
| $20,000 to $24,999 | 10 (12.3%) | 0 (0.0%) |
| $25,000 to $34,999 | 0 (0.0%) | 7 (15.6%) |
| $35,000 to $49,999 | 12 (14.8%) | 7 (15.6%) |
| $50,000 to $74,999 | 19 (23.5%) | 24 (53.3%) |
| $75,000 to $99,999 | 12 (14.8%) | 2 (4.4%) |
| $100,000 to $149,999 | 7 (8.6%) | 1 (2.2%) |
| $150,000 or more | 4 (4.9%) | 0 (0.0%) |
| Total | 81 (100.0%) | 45 (100.0%) |
Monthly Housing Cost Tiers in Dellroy
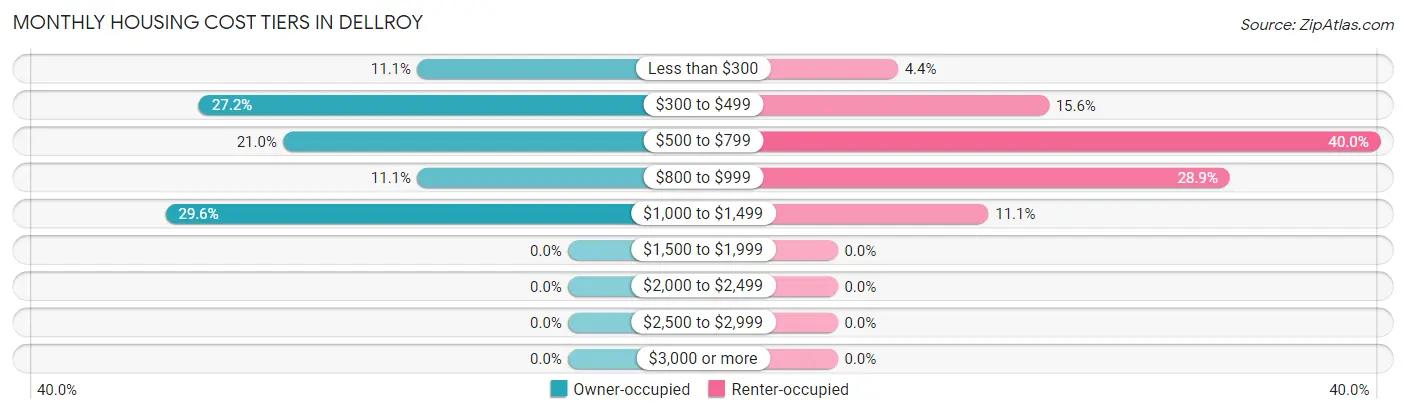
| Monthly Cost | Owner-occupied | Renter-occupied |
| Less than $300 | 9 (11.1%) | 2 (4.4%) |
| $300 to $499 | 22 (27.2%) | 7 (15.6%) |
| $500 to $799 | 17 (21.0%) | 18 (40.0%) |
| $800 to $999 | 9 (11.1%) | 13 (28.9%) |
| $1,000 to $1,499 | 24 (29.6%) | 5 (11.1%) |
| $1,500 to $1,999 | 0 (0.0%) | 0 (0.0%) |
| $2,000 to $2,499 | 0 (0.0%) | 0 (0.0%) |
| $2,500 to $2,999 | 0 (0.0%) | 0 (0.0%) |
| $3,000 or more | 0 (0.0%) | 0 (0.0%) |
| Total | 81 (100.0%) | 45 (100.0%) |
Physical Housing Characteristics in Dellroy
Housing Structures in Dellroy
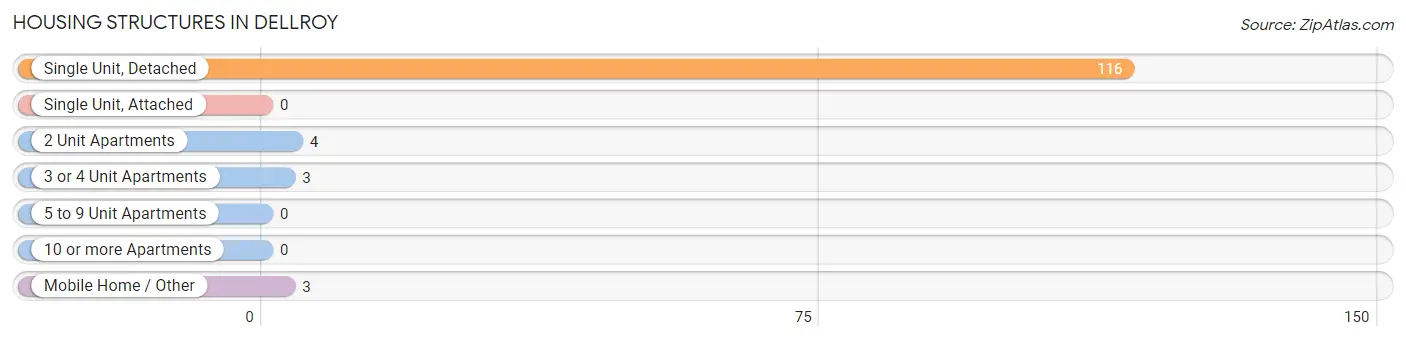
| Structure Type | # Housing Units | % Housing Units |
| Single Unit, Detached | 116 | 92.1% |
| Single Unit, Attached | 0 | 0.0% |
| 2 Unit Apartments | 4 | 3.2% |
| 3 or 4 Unit Apartments | 3 | 2.4% |
| 5 to 9 Unit Apartments | 0 | 0.0% |
| 10 or more Apartments | 0 | 0.0% |
| Mobile Home / Other | 3 | 2.4% |
| Total | 126 | 100.0% |
Housing Structures by Occupancy in Dellroy
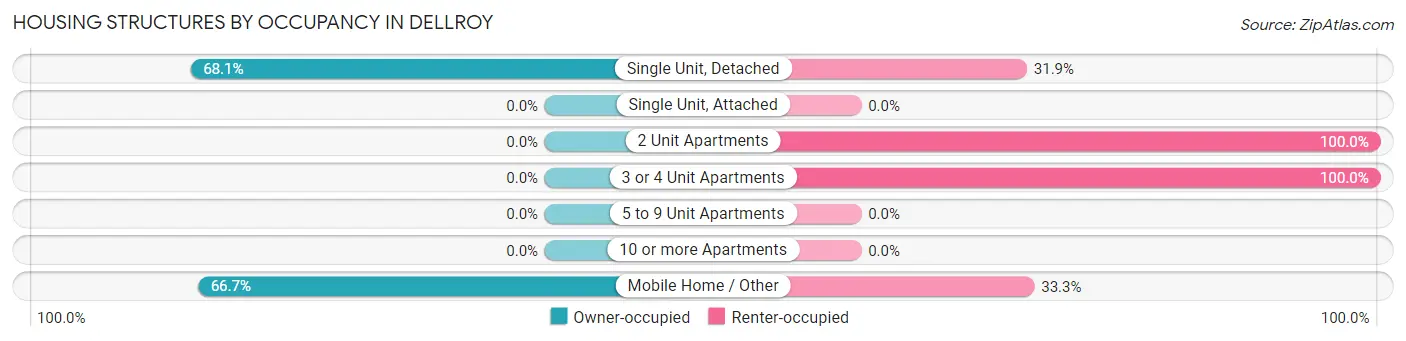
| Structure Type | Owner-occupied | Renter-occupied |
| Single Unit, Detached | 79 (68.1%) | 37 (31.9%) |
| Single Unit, Attached | 0 (0.0%) | 0 (0.0%) |
| 2 Unit Apartments | 0 (0.0%) | 4 (100.0%) |
| 3 or 4 Unit Apartments | 0 (0.0%) | 3 (100.0%) |
| 5 to 9 Unit Apartments | 0 (0.0%) | 0 (0.0%) |
| 10 or more Apartments | 0 (0.0%) | 0 (0.0%) |
| Mobile Home / Other | 2 (66.7%) | 1 (33.3%) |
| Total | 81 (64.3%) | 45 (35.7%) |
Housing Structures by Number of Rooms in Dellroy
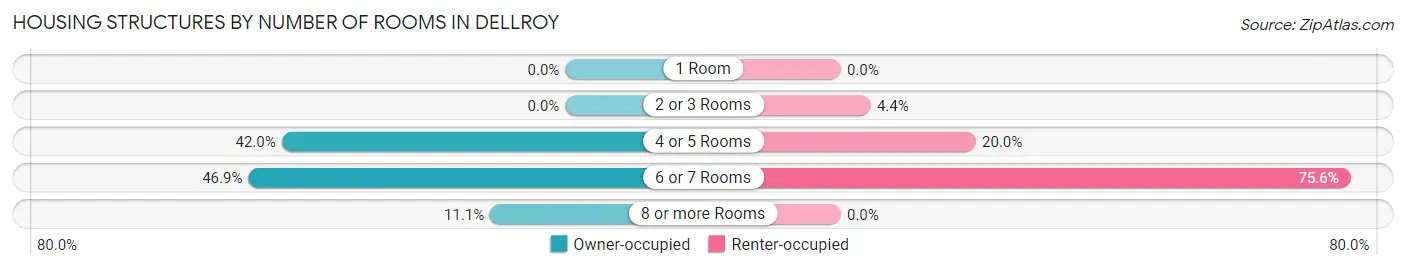
| Number of Rooms | Owner-occupied | Renter-occupied |
| 1 Room | 0 (0.0%) | 0 (0.0%) |
| 2 or 3 Rooms | 0 (0.0%) | 2 (4.4%) |
| 4 or 5 Rooms | 34 (42.0%) | 9 (20.0%) |
| 6 or 7 Rooms | 38 (46.9%) | 34 (75.6%) |
| 8 or more Rooms | 9 (11.1%) | 0 (0.0%) |
| Total | 81 (100.0%) | 45 (100.0%) |
Housing Structure by Heating Type in Dellroy
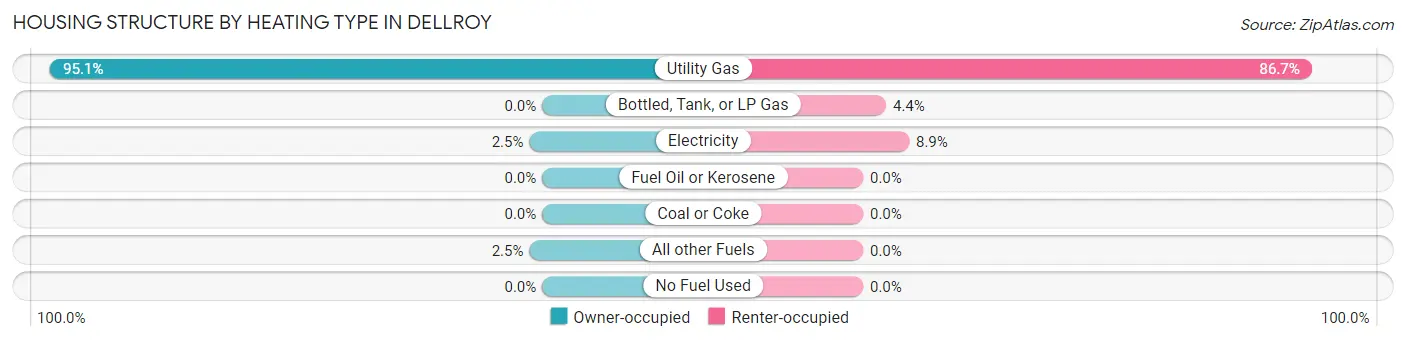
| Heating Type | Owner-occupied | Renter-occupied |
| Utility Gas | 77 (95.1%) | 39 (86.7%) |
| Bottled, Tank, or LP Gas | 0 (0.0%) | 2 (4.4%) |
| Electricity | 2 (2.5%) | 4 (8.9%) |
| Fuel Oil or Kerosene | 0 (0.0%) | 0 (0.0%) |
| Coal or Coke | 0 (0.0%) | 0 (0.0%) |
| All other Fuels | 2 (2.5%) | 0 (0.0%) |
| No Fuel Used | 0 (0.0%) | 0 (0.0%) |
| Total | 81 (100.0%) | 45 (100.0%) |
Household Vehicle Usage in Dellroy
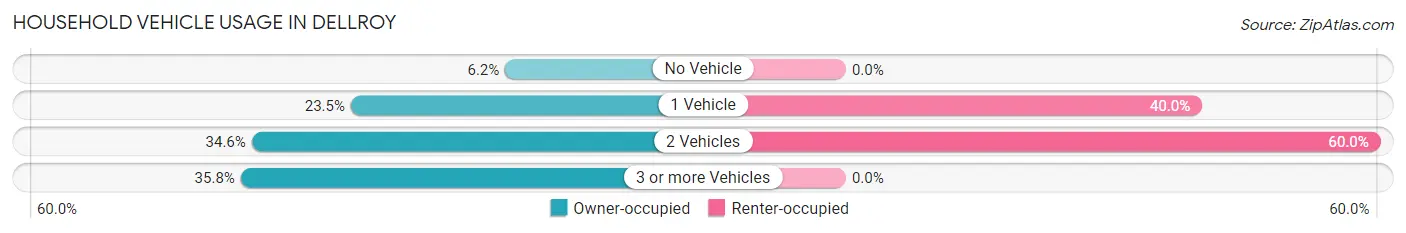
| Vehicles per Household | Owner-occupied | Renter-occupied |
| No Vehicle | 5 (6.2%) | 0 (0.0%) |
| 1 Vehicle | 19 (23.5%) | 18 (40.0%) |
| 2 Vehicles | 28 (34.6%) | 27 (60.0%) |
| 3 or more Vehicles | 29 (35.8%) | 0 (0.0%) |
| Total | 81 (100.0%) | 45 (100.0%) |
Real Estate & Mortgages in Dellroy
Real Estate and Mortgage Overview in Dellroy
| Characteristic | Without Mortgage | With Mortgage |
| Housing Units | 35 | 46 |
| Median Property Value | $116,400 | $134,400 |
| Median Household Income | $36,563 | $4 |
| Monthly Housing Costs | $381 | $0 |
| Real Estate Taxes | $882 | $0 |
Property Value by Mortgage Status in Dellroy
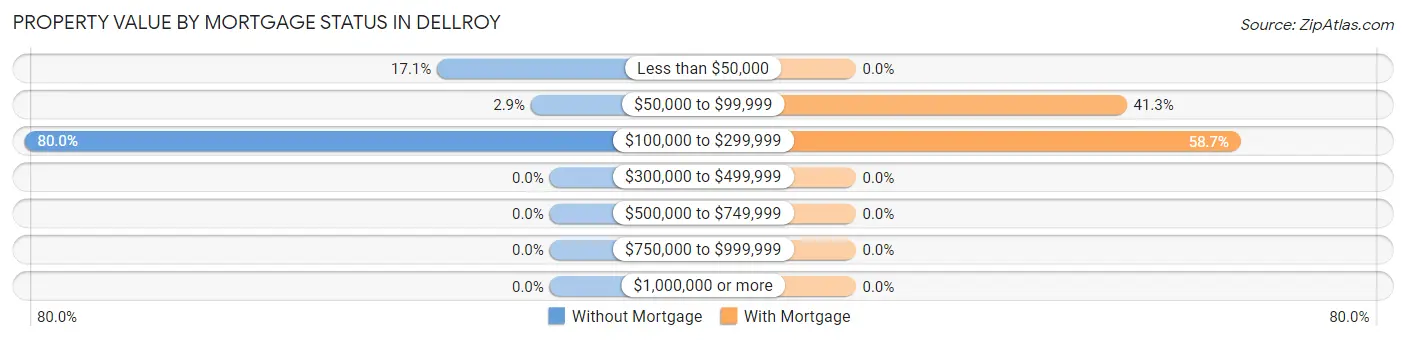
| Property Value | Without Mortgage | With Mortgage |
| Less than $50,000 | 6 (17.1%) | 0 (0.0%) |
| $50,000 to $99,999 | 1 (2.9%) | 19 (41.3%) |
| $100,000 to $299,999 | 28 (80.0%) | 27 (58.7%) |
| $300,000 to $499,999 | 0 (0.0%) | 0 (0.0%) |
| $500,000 to $749,999 | 0 (0.0%) | 0 (0.0%) |
| $750,000 to $999,999 | 0 (0.0%) | 0 (0.0%) |
| $1,000,000 or more | 0 (0.0%) | 0 (0.0%) |
| Total | 35 (100.0%) | 46 (100.0%) |
Household Income by Mortgage Status in Dellroy
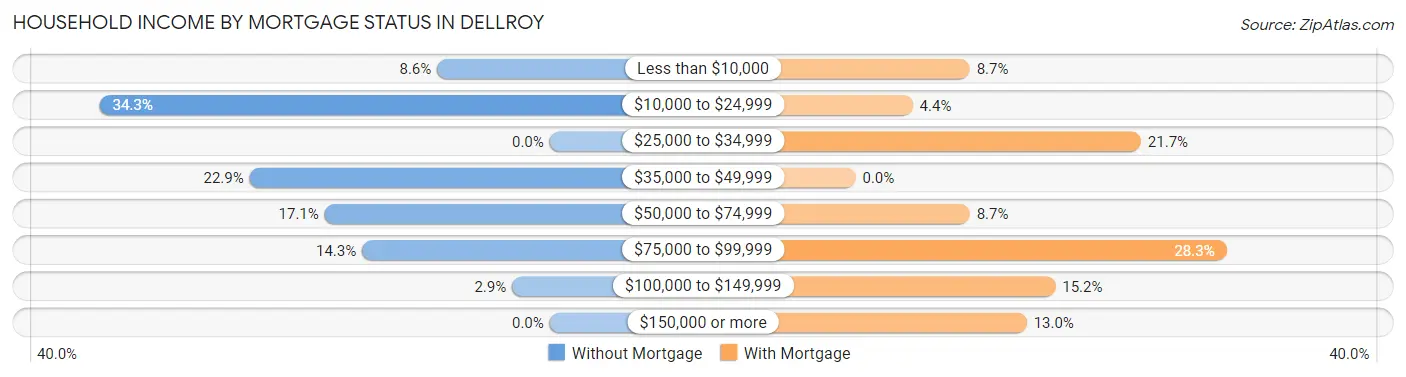
| Household Income | Without Mortgage | With Mortgage |
| Less than $10,000 | 3 (8.6%) | 4 (8.7%) |
| $10,000 to $24,999 | 12 (34.3%) | 2 (4.3%) |
| $25,000 to $34,999 | 0 (0.0%) | 10 (21.7%) |
| $35,000 to $49,999 | 8 (22.9%) | 0 (0.0%) |
| $50,000 to $74,999 | 6 (17.1%) | 4 (8.7%) |
| $75,000 to $99,999 | 5 (14.3%) | 13 (28.3%) |
| $100,000 to $149,999 | 1 (2.9%) | 7 (15.2%) |
| $150,000 or more | 0 (0.0%) | 6 (13.0%) |
| Total | 35 (100.0%) | 46 (100.0%) |
Property Value to Household Income Ratio in Dellroy
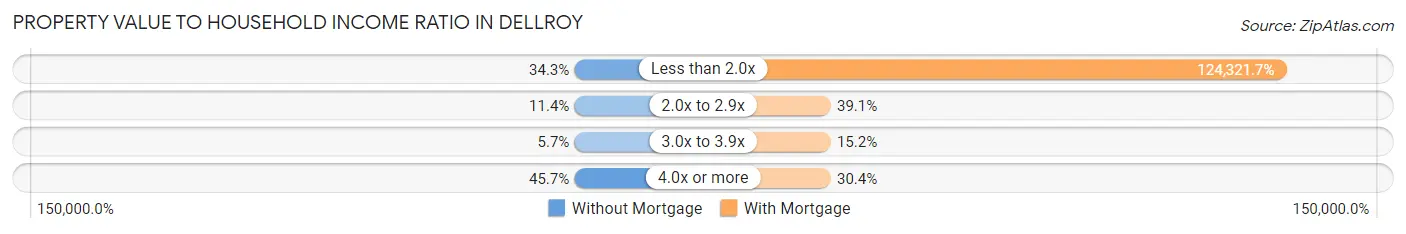
| Value-to-Income Ratio | Without Mortgage | With Mortgage |
| Less than 2.0x | 12 (34.3%) | 57,188 (124,321.7%) |
| 2.0x to 2.9x | 4 (11.4%) | 18 (39.1%) |
| 3.0x to 3.9x | 2 (5.7%) | 7 (15.2%) |
| 4.0x or more | 16 (45.7%) | 14 (30.4%) |
| Total | 35 (100.0%) | 46 (100.0%) |
Real Estate Taxes by Mortgage Status in Dellroy
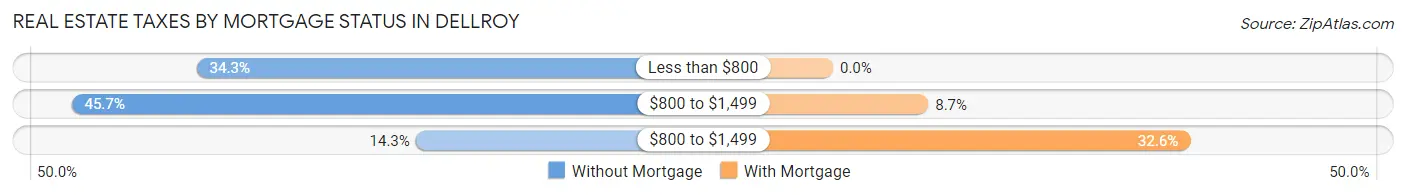
| Property Taxes | Without Mortgage | With Mortgage |
| Less than $800 | 12 (34.3%) | 0 (0.0%) |
| $800 to $1,499 | 16 (45.7%) | 4 (8.7%) |
| $800 to $1,499 | 5 (14.3%) | 15 (32.6%) |
| Total | 35 (100.0%) | 46 (100.0%) |
Health & Disability in Dellroy
Health Insurance Coverage by Age in Dellroy
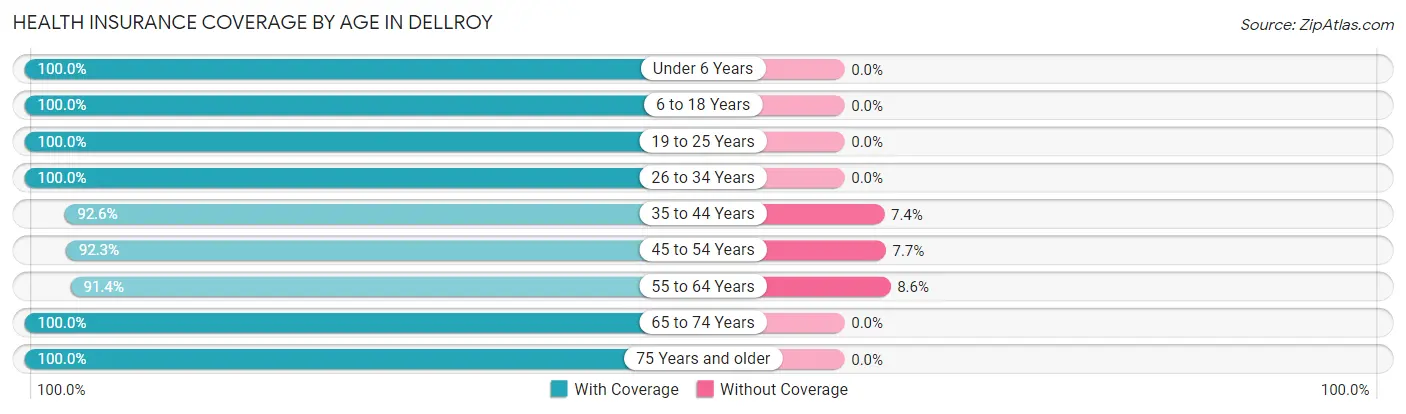
| Age Bracket | With Coverage | Without Coverage |
| Under 6 Years | 14 (100.0%) | 0 (0.0%) |
| 6 to 18 Years | 48 (100.0%) | 0 (0.0%) |
| 19 to 25 Years | 18 (100.0%) | 0 (0.0%) |
| 26 to 34 Years | 30 (100.0%) | 0 (0.0%) |
| 35 to 44 Years | 25 (92.6%) | 2 (7.4%) |
| 45 to 54 Years | 48 (92.3%) | 4 (7.7%) |
| 55 to 64 Years | 32 (91.4%) | 3 (8.6%) |
| 65 to 74 Years | 31 (100.0%) | 0 (0.0%) |
| 75 Years and older | 32 (100.0%) | 0 (0.0%) |
| Total | 278 (96.9%) | 9 (3.1%) |
Health Insurance Coverage by Citizenship Status in Dellroy

| Citizenship Status | With Coverage | Without Coverage |
| Native Born | 14 (100.0%) | 0 (0.0%) |
| Foreign Born, Citizen | 48 (100.0%) | 0 (0.0%) |
| Foreign Born, not a Citizen | 18 (100.0%) | 0 (0.0%) |
Health Insurance Coverage by Household Income in Dellroy
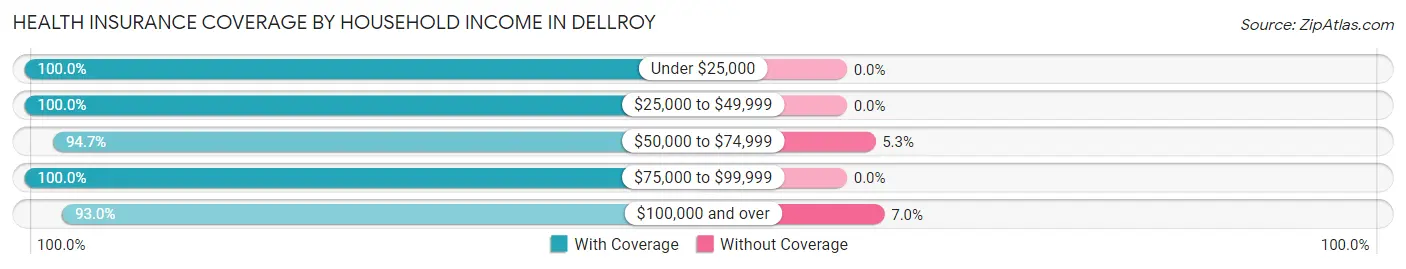
| Household Income | With Coverage | Without Coverage |
| Under $25,000 | 46 (100.0%) | 0 (0.0%) |
| $25,000 to $49,999 | 58 (100.0%) | 0 (0.0%) |
| $50,000 to $74,999 | 89 (94.7%) | 5 (5.3%) |
| $75,000 to $99,999 | 32 (100.0%) | 0 (0.0%) |
| $100,000 and over | 53 (93.0%) | 4 (7.0%) |
Public vs Private Health Insurance Coverage by Age in Dellroy
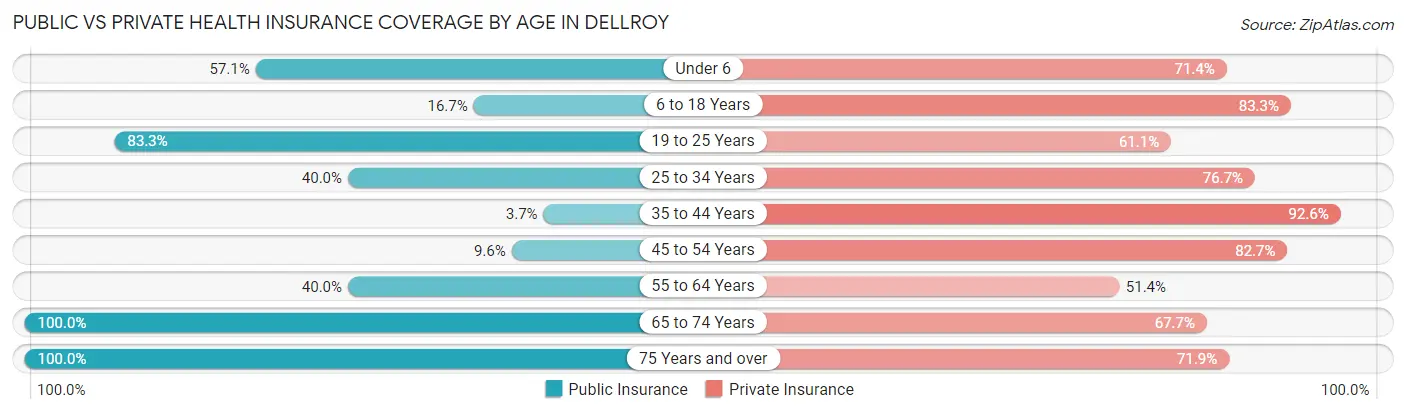
| Age Bracket | Public Insurance | Private Insurance |
| Under 6 | 8 (57.1%) | 10 (71.4%) |
| 6 to 18 Years | 8 (16.7%) | 40 (83.3%) |
| 19 to 25 Years | 15 (83.3%) | 11 (61.1%) |
| 25 to 34 Years | 12 (40.0%) | 23 (76.7%) |
| 35 to 44 Years | 1 (3.7%) | 25 (92.6%) |
| 45 to 54 Years | 5 (9.6%) | 43 (82.7%) |
| 55 to 64 Years | 14 (40.0%) | 18 (51.4%) |
| 65 to 74 Years | 31 (100.0%) | 21 (67.7%) |
| 75 Years and over | 32 (100.0%) | 23 (71.9%) |
| Total | 126 (43.9%) | 214 (74.6%) |
Disability Status by Sex by Age in Dellroy
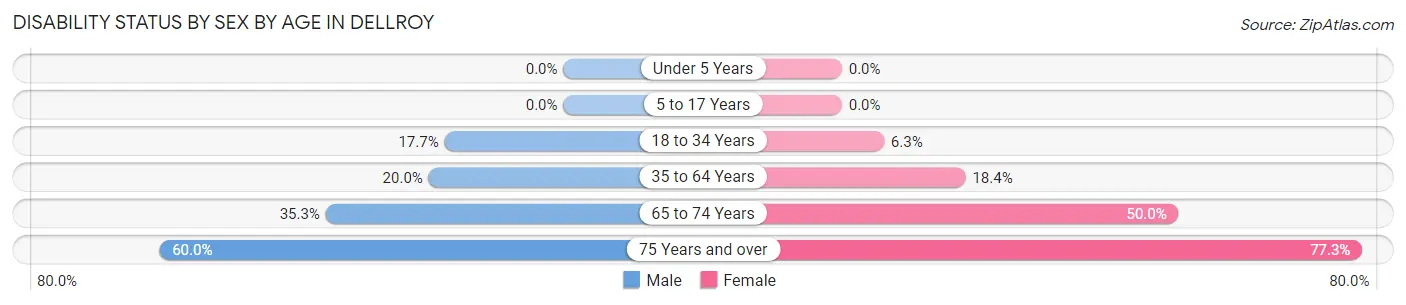
| Age Bracket | Male | Female |
| Under 5 Years | 0 (0.0%) | 0 (0.0%) |
| 5 to 17 Years | 0 (0.0%) | 0 (0.0%) |
| 18 to 34 Years | 3 (17.6%) | 2 (6.2%) |
| 35 to 64 Years | 13 (20.0%) | 9 (18.4%) |
| 65 to 74 Years | 6 (35.3%) | 7 (50.0%) |
| 75 Years and over | 6 (60.0%) | 17 (77.3%) |
Disability Class by Sex by Age in Dellroy
Disability Class: Hearing Difficulty
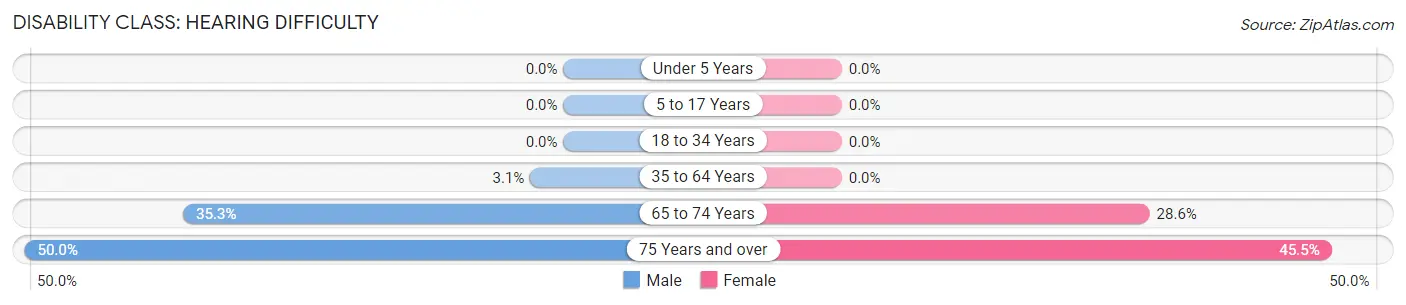
| Age Bracket | Male | Female |
| Under 5 Years | 0 (0.0%) | 0 (0.0%) |
| 5 to 17 Years | 0 (0.0%) | 0 (0.0%) |
| 18 to 34 Years | 0 (0.0%) | 0 (0.0%) |
| 35 to 64 Years | 2 (3.1%) | 0 (0.0%) |
| 65 to 74 Years | 6 (35.3%) | 4 (28.6%) |
| 75 Years and over | 5 (50.0%) | 10 (45.5%) |
Disability Class: Vision Difficulty
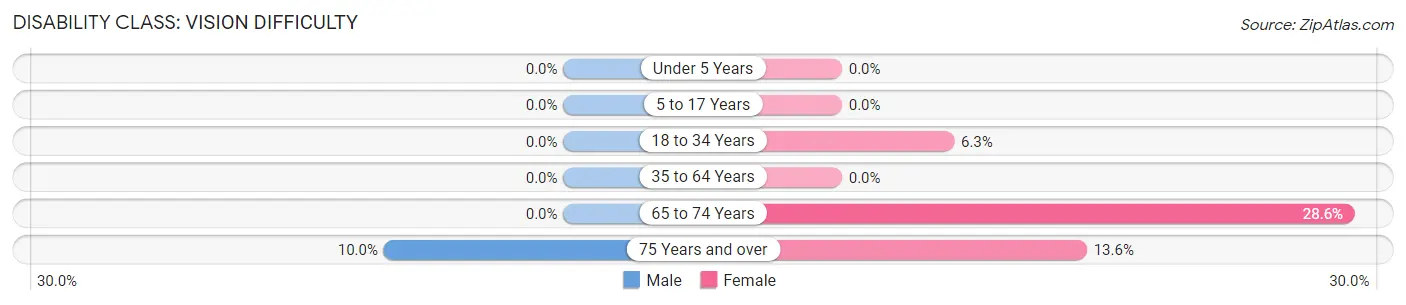
| Age Bracket | Male | Female |
| Under 5 Years | 0 (0.0%) | 0 (0.0%) |
| 5 to 17 Years | 0 (0.0%) | 0 (0.0%) |
| 18 to 34 Years | 0 (0.0%) | 2 (6.2%) |
| 35 to 64 Years | 0 (0.0%) | 0 (0.0%) |
| 65 to 74 Years | 0 (0.0%) | 4 (28.6%) |
| 75 Years and over | 1 (10.0%) | 3 (13.6%) |
Disability Class: Cognitive Difficulty
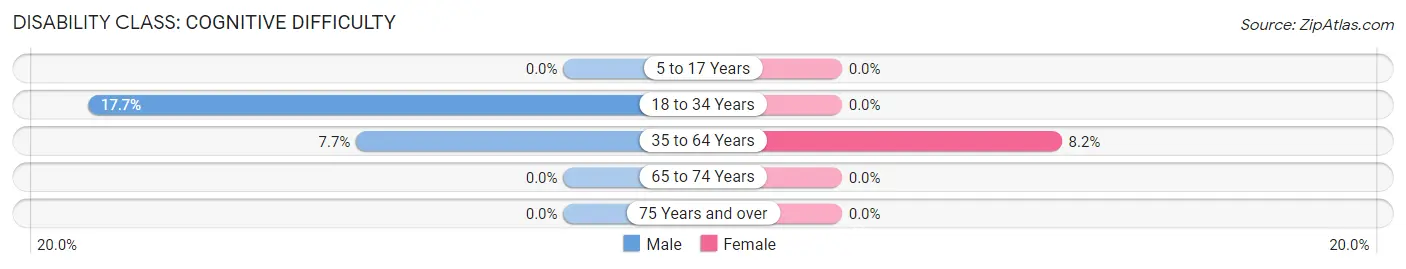
| Age Bracket | Male | Female |
| 5 to 17 Years | 0 (0.0%) | 0 (0.0%) |
| 18 to 34 Years | 3 (17.6%) | 0 (0.0%) |
| 35 to 64 Years | 5 (7.7%) | 4 (8.2%) |
| 65 to 74 Years | 0 (0.0%) | 0 (0.0%) |
| 75 Years and over | 0 (0.0%) | 0 (0.0%) |
Disability Class: Ambulatory Difficulty
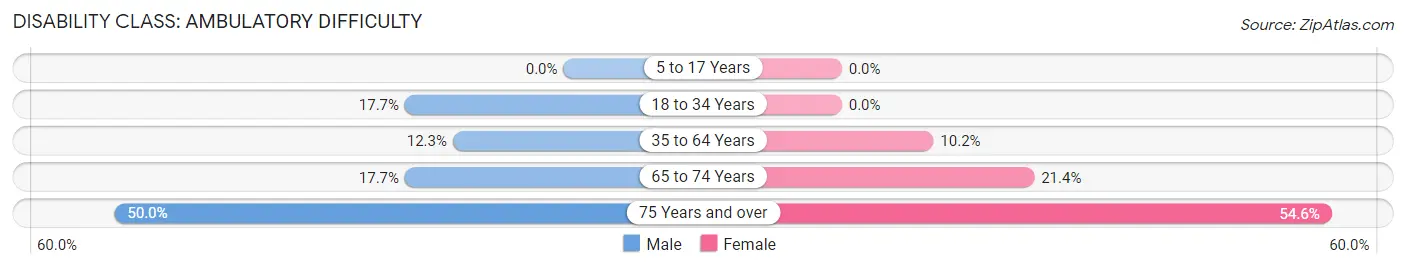
| Age Bracket | Male | Female |
| 5 to 17 Years | 0 (0.0%) | 0 (0.0%) |
| 18 to 34 Years | 3 (17.6%) | 0 (0.0%) |
| 35 to 64 Years | 8 (12.3%) | 5 (10.2%) |
| 65 to 74 Years | 3 (17.6%) | 3 (21.4%) |
| 75 Years and over | 5 (50.0%) | 12 (54.5%) |
Disability Class: Self-Care Difficulty
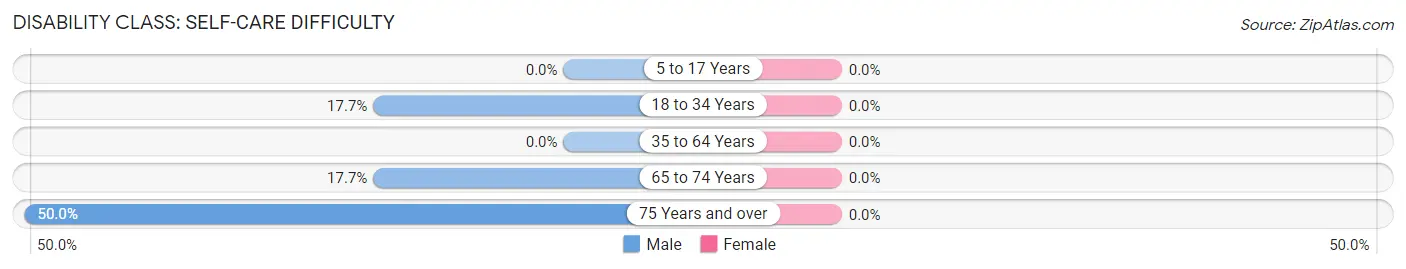
| Age Bracket | Male | Female |
| 5 to 17 Years | 0 (0.0%) | 0 (0.0%) |
| 18 to 34 Years | 3 (17.6%) | 0 (0.0%) |
| 35 to 64 Years | 0 (0.0%) | 0 (0.0%) |
| 65 to 74 Years | 3 (17.6%) | 0 (0.0%) |
| 75 Years and over | 5 (50.0%) | 0 (0.0%) |
Technology Access in Dellroy
Computing Device Access in Dellroy
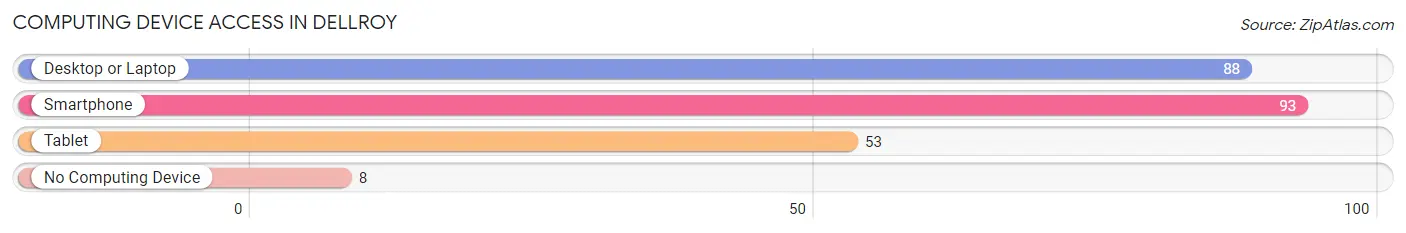
| Device Type | # Households | % Households |
| Desktop or Laptop | 88 | 69.8% |
| Smartphone | 93 | 73.8% |
| Tablet | 53 | 42.1% |
| No Computing Device | 8 | 6.4% |
| Total | 126 | 100.0% |
Internet Access in Dellroy
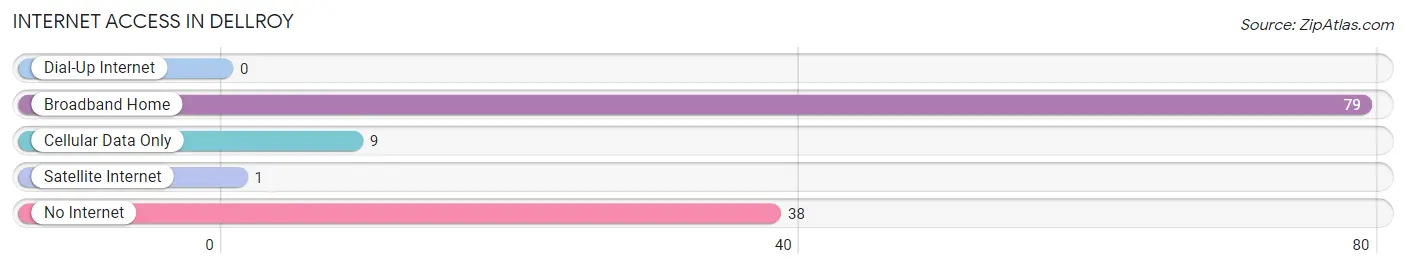
| Internet Type | # Households | % Households |
| Dial-Up Internet | 0 | 0.0% |
| Broadband Home | 79 | 62.7% |
| Cellular Data Only | 9 | 7.1% |
| Satellite Internet | 1 | 0.8% |
| No Internet | 38 | 30.2% |
| Total | 126 | 100.0% |
Dellroy Summary
Dellroy is a small village located in Carroll County, Ohio. It is situated along the Tuscarawas River, approximately 25 miles south of Canton and 40 miles northeast of Columbus. The village has a population of approximately 500 people and covers an area of 0.6 square miles.
History
Dellroy was founded in 1832 by a group of settlers from Pennsylvania. The village was named after a local Native American chief, Dellroy. The first settlers were primarily farmers and the village grew slowly over the years. In 1845, the first post office was established and the village was officially incorporated in 1876.
In the late 19th century, Dellroy was a thriving agricultural community. The village was home to several mills, a cheese factory, a canning factory, and a brickyard. The village also had a railroad station, which connected it to the larger cities of Canton and Akron.
In the early 20th century, Dellroy began to decline as the railroad station closed and the mills and factories moved away. The village was largely forgotten until the 1970s when it was rediscovered by a group of artists and writers who were drawn to its rural charm.
Geography
Dellroy is located in the Appalachian Plateau region of Ohio. The village is situated along the Tuscarawas River, which flows through the village and provides a scenic backdrop. The village is surrounded by rolling hills and wooded areas, making it a popular destination for outdoor activities such as fishing, hunting, and camping.
The village is located approximately 25 miles south of Canton and 40 miles northeast of Columbus. It is also close to the larger cities of Akron and Cleveland.
Economy
Dellroy’s economy is largely based on agriculture and tourism. The village is home to several farms, which produce a variety of crops such as corn, soybeans, and wheat. The village also has several small businesses, including a grocery store, a hardware store, and a restaurant.
The village is also a popular destination for tourists, who come to enjoy the rural charm and outdoor activities. The village is home to several bed and breakfasts, as well as a campground.
Demographics
As of the 2010 census, Dellroy had a population of 500 people. The racial makeup of the village was 97.2% White, 0.6% African American, 0.2% Native American, 0.2% Asian, and 1.8% from other races. The median household income was $37,500 and the median age was 43.
Dellroy is a small, rural village with a rich history and a strong sense of community. The village is home to a diverse population and offers a variety of activities for visitors and residents alike.
Common Questions
What is Per Capita Income in Dellroy?
Per Capita income in Dellroy is $25,218.
What is the Median Family Income in Dellroy?
Median Family Income in Dellroy is $55,313.
What is the Median Household income in Dellroy?
Median Household Income in Dellroy is $52,833.
What is Income or Wage Gap in Dellroy?
Income or Wage Gap in Dellroy is 21.0%.
Women in Dellroy earn 79.0 cents for every dollar earned by a man.
What is Inequality or Gini Index in Dellroy?
Inequality or Gini Index in Dellroy is 0.36.
What is the Total Population of Dellroy?
Total Population of Dellroy is 287.
What is the Total Male Population of Dellroy?
Total Male Population of Dellroy is 145.
What is the Total Female Population of Dellroy?
Total Female Population of Dellroy is 142.
What is the Ratio of Males per 100 Females in Dellroy?
There are 102.11 Males per 100 Females in Dellroy.
What is the Ratio of Females per 100 Males in Dellroy?
There are 97.93 Females per 100 Males in Dellroy.
What is the Median Population Age in Dellroy?
Median Population Age in Dellroy is 47.3 Years.
What is the Average Family Size in Dellroy
Average Family Size in Dellroy is 2.7 People.
What is the Average Household Size in Dellroy
Average Household Size in Dellroy is 2.3 People.
How Large is the Labor Force in Dellroy?
There are 114 People in the Labor Forcein in Dellroy.
What is the Percentage of People in the Labor Force in Dellroy?
48.7% of People are in the Labor Force in Dellroy.
What is the Unemployment Rate in Dellroy?
Unemployment Rate in Dellroy is 2.6%.