Dalton, OH Map & Demographics
Dalton Map
Dalton Overview
$34,858
PER CAPITA INCOME
$91,389
AVG FAMILY INCOME
$60,833
AVG HOUSEHOLD INCOME
34.3%
WAGE / INCOME GAP [ % ]
65.7¢/ $1
WAGE / INCOME GAP [ $ ]
0.45
INEQUALITY / GINI INDEX
1,703
TOTAL POPULATION
790
MALE POPULATION
913
FEMALE POPULATION
86.53
MALES / 100 FEMALES
115.57
FEMALES / 100 MALES
45.4
MEDIAN AGE
3.0
AVG FAMILY SIZE
2.3
AVG HOUSEHOLD SIZE
842
LABOR FORCE [ PEOPLE ]
59.4%
PERCENT IN LABOR FORCE
1.3%
UNEMPLOYMENT RATE
Dalton Zip Codes
Income in Dalton
Income Overview in Dalton
Per Capita Income in Dalton is $34,858, while median incomes of families and households are $91,389 and $60,833 respectively.
| Characteristic | Number | Measure |
| Per Capita Income | 1,703 | $34,858 |
| Median Family Income | 428 | $91,389 |
| Mean Family Income | 428 | $106,287 |
| Median Household Income | 708 | $60,833 |
| Mean Household Income | 708 | $79,909 |
| Income Deficit | 428 | $0 |
| Wage / Income Gap (%) | 1,703 | 34.34% |
| Wage / Income Gap ($) | 1,703 | 65.66¢ per $1 |
| Gini / Inequality Index | 1,703 | 0.45 |
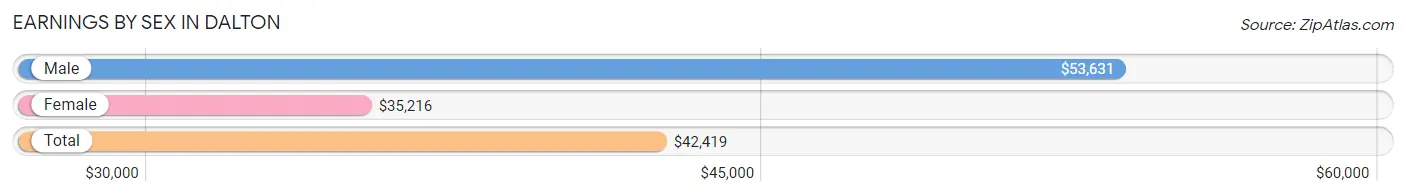
Earnings by Sex in Dalton
Average Earnings in Dalton are $42,419, $53,631 for men and $35,216 for women, a difference of 34.3%.
| Sex | Number | Average Earnings |
| Male | 421 (47.4%) | $53,631 |
| Female | 467 (52.6%) | $35,216 |
| Total | 888 (100.0%) | $42,419 |
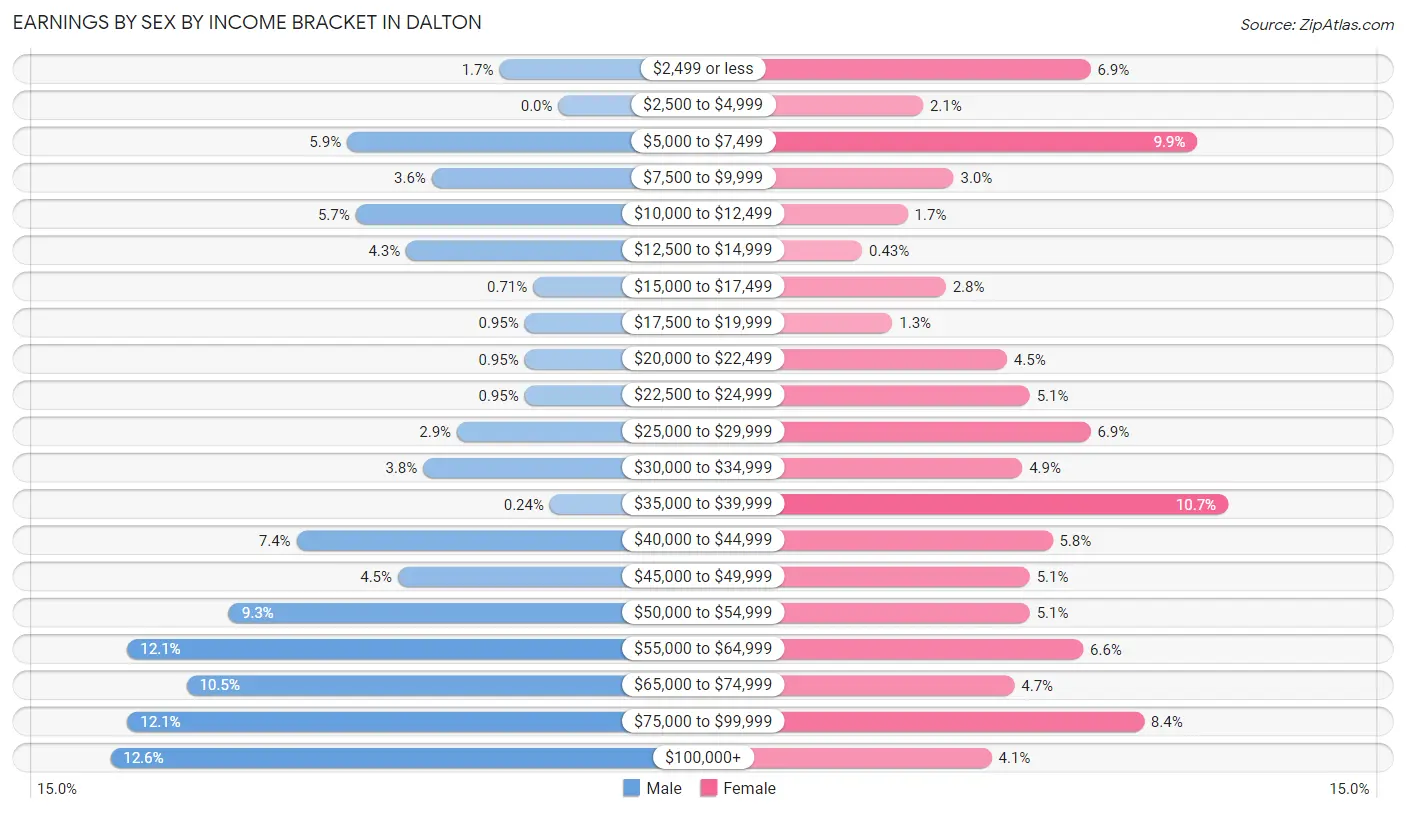
Earnings by Sex by Income Bracket in Dalton
The most common earnings brackets in Dalton are $100,000+ for men (53 | 12.6%) and $35,000 to $39,999 for women (50 | 10.7%).
| Income | Male | Female |
| $2,499 or less | 7 (1.7%) | 32 (6.9%) |
| $2,500 to $4,999 | 0 (0.0%) | 10 (2.1%) |
| $5,000 to $7,499 | 25 (5.9%) | 46 (9.9%) |
| $7,500 to $9,999 | 15 (3.6%) | 14 (3.0%) |
| $10,000 to $12,499 | 24 (5.7%) | 8 (1.7%) |
| $12,500 to $14,999 | 18 (4.3%) | 2 (0.4%) |
| $15,000 to $17,499 | 3 (0.7%) | 13 (2.8%) |
| $17,500 to $19,999 | 4 (0.9%) | 6 (1.3%) |
| $20,000 to $22,499 | 4 (0.9%) | 21 (4.5%) |
| $22,500 to $24,999 | 4 (0.9%) | 24 (5.1%) |
| $25,000 to $29,999 | 12 (2.9%) | 32 (6.9%) |
| $30,000 to $34,999 | 16 (3.8%) | 23 (4.9%) |
| $35,000 to $39,999 | 1 (0.2%) | 50 (10.7%) |
| $40,000 to $44,999 | 31 (7.4%) | 27 (5.8%) |
| $45,000 to $49,999 | 19 (4.5%) | 24 (5.1%) |
| $50,000 to $54,999 | 39 (9.3%) | 24 (5.1%) |
| $55,000 to $64,999 | 51 (12.1%) | 31 (6.6%) |
| $65,000 to $74,999 | 44 (10.4%) | 22 (4.7%) |
| $75,000 to $99,999 | 51 (12.1%) | 39 (8.4%) |
| $100,000+ | 53 (12.6%) | 19 (4.1%) |
| Total | 421 (100.0%) | 467 (100.0%) |
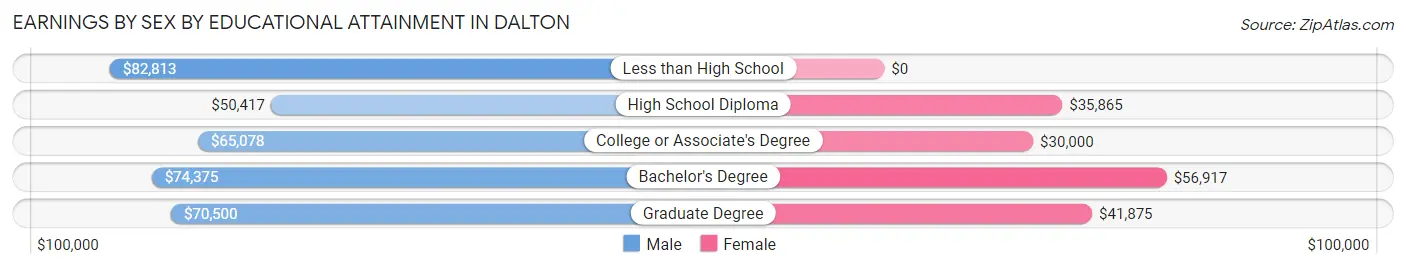
Earnings by Sex by Educational Attainment in Dalton
Average earnings in Dalton are $60,238 for men and $38,214 for women, a difference of 36.6%. Men with an educational attainment of less than high school enjoy the highest average annual earnings of $82,813, while those with high school diploma education earn the least with $50,417. Women with an educational attainment of bachelor's degree earn the most with the average annual earnings of $56,917, while those with college or associate's degree education have the smallest earnings of $30,000.
| Educational Attainment | Male Income | Female Income |
| Less than High School | $82,813 | $0 |
| High School Diploma | $50,417 | $35,865 |
| College or Associate's Degree | $65,078 | $30,000 |
| Bachelor's Degree | $74,375 | $56,917 |
| Graduate Degree | $70,500 | $41,875 |
| Total | $60,238 | $38,214 |
Family Income in Dalton
Family Income Brackets in Dalton
According to the Dalton family income data, there are 106 families falling into the $100,000 to $149,999 income range, which is the most common income bracket and makes up 24.8% of all families.
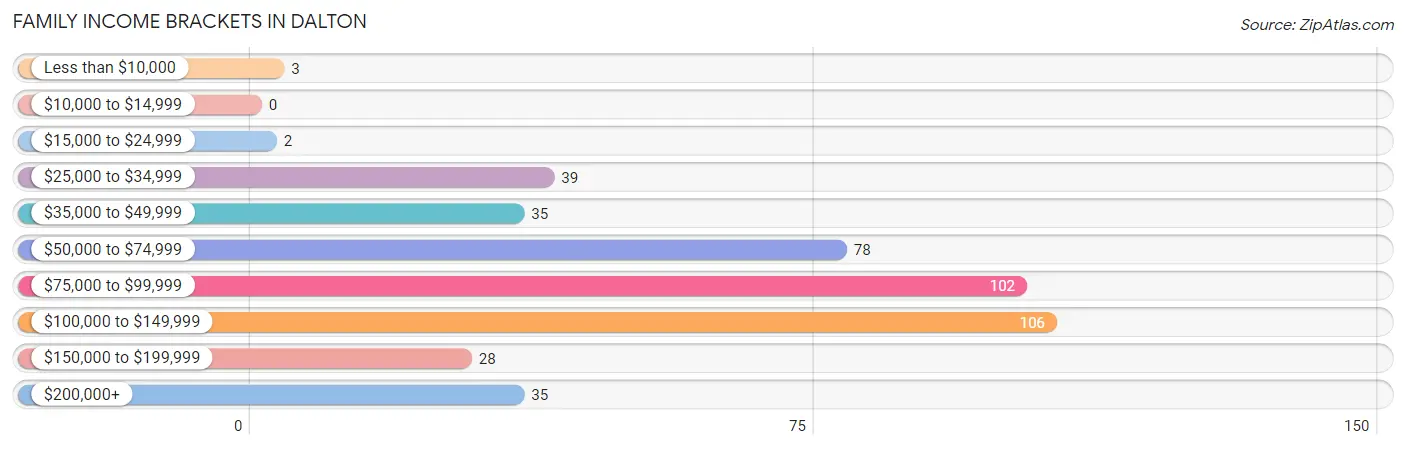
| Income Bracket | # Families | % Families |
| Less than $10,000 | 3 | 0.7% |
| $10,000 to $14,999 | 0 | 0.0% |
| $15,000 to $24,999 | 2 | 0.5% |
| $25,000 to $34,999 | 39 | 9.1% |
| $35,000 to $49,999 | 35 | 8.2% |
| $50,000 to $74,999 | 78 | 18.2% |
| $75,000 to $99,999 | 102 | 23.8% |
| $100,000 to $149,999 | 106 | 24.8% |
| $150,000 to $199,999 | 28 | 6.5% |
| $200,000+ | 35 | 8.2% |
Family Income by Famaliy Size in Dalton
4-person families (71 | 16.6%) account for the highest median family income in Dalton with $139,583 per family, while 2-person families (202 | 47.2%) have the highest median income of $35,782 per family member.
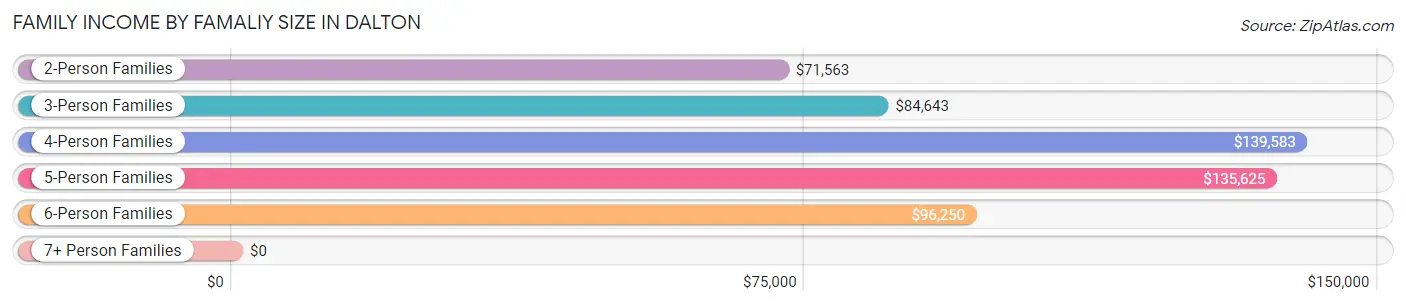
| Income Bracket | # Families | Median Income |
| 2-Person Families | 202 (47.2%) | $71,563 |
| 3-Person Families | 94 (22.0%) | $84,643 |
| 4-Person Families | 71 (16.6%) | $139,583 |
| 5-Person Families | 22 (5.1%) | $135,625 |
| 6-Person Families | 35 (8.2%) | $96,250 |
| 7+ Person Families | 4 (0.9%) | $0 |
| Total | 428 (100.0%) | $91,389 |
Family Income by Number of Earners in Dalton
The median family income in Dalton is $91,389, with families comprising 3+ earners (80) having the highest median family income of $110,417, while families with no earners (59) have the lowest median family income of $52,188, accounting for 18.7% and 13.8% of families, respectively.
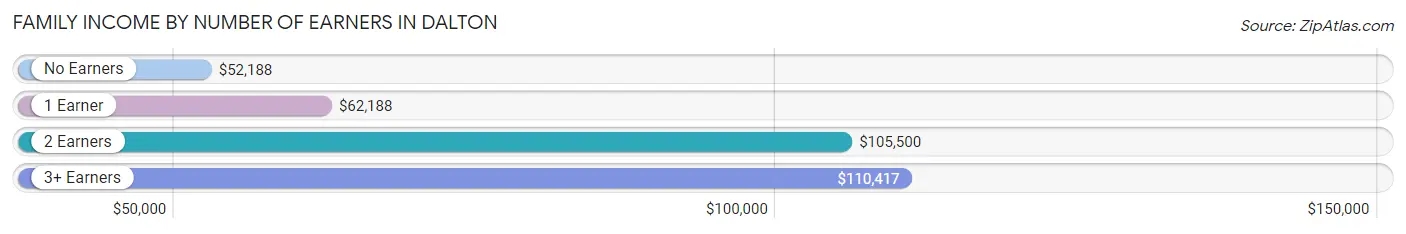
| Number of Earners | # Families | Median Income |
| No Earners | 59 (13.8%) | $52,188 |
| 1 Earner | 79 (18.5%) | $62,188 |
| 2 Earners | 210 (49.1%) | $105,500 |
| 3+ Earners | 80 (18.7%) | $110,417 |
| Total | 428 (100.0%) | $91,389 |
Household Income in Dalton
Household Income Brackets in Dalton
With 116 households falling in the category, the $100,000 to $149,999 income range is the most frequent in Dalton, accounting for 16.4% of all households. In contrast, only 14 households (2.0%) fall into the $10,000 to $14,999 income bracket, making it the least populous group.
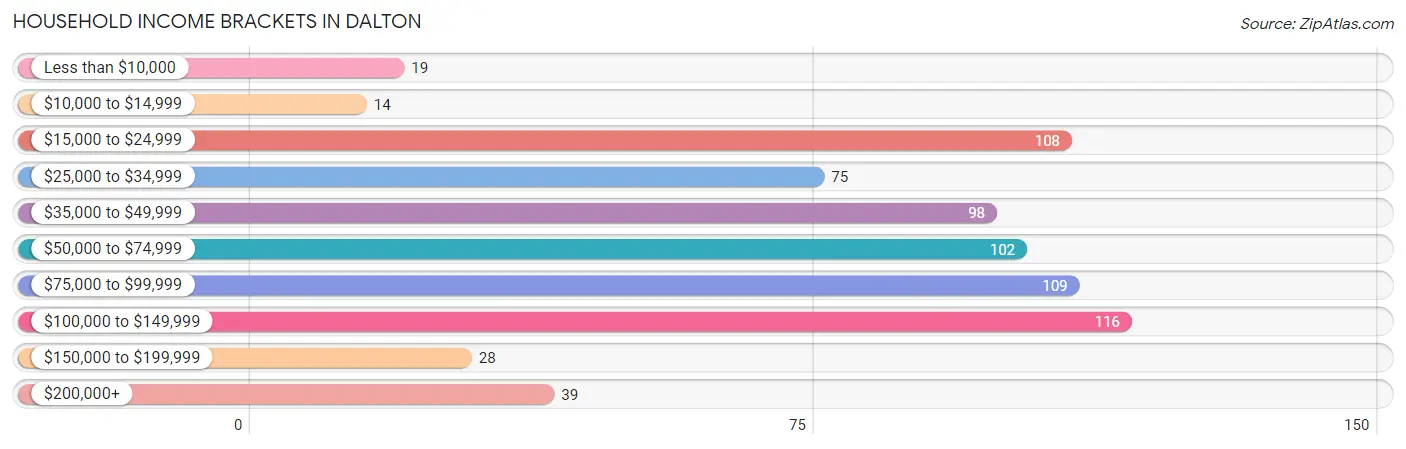
| Income Bracket | # Households | % Households |
| Less than $10,000 | 19 | 2.7% |
| $10,000 to $14,999 | 14 | 2.0% |
| $15,000 to $24,999 | 108 | 15.3% |
| $25,000 to $34,999 | 75 | 10.6% |
| $35,000 to $49,999 | 98 | 13.8% |
| $50,000 to $74,999 | 102 | 14.4% |
| $75,000 to $99,999 | 109 | 15.4% |
| $100,000 to $149,999 | 116 | 16.4% |
| $150,000 to $199,999 | 28 | 4.0% |
| $200,000+ | 39 | 5.5% |
Household Income by Householder Age in Dalton
The median household income in Dalton is $60,833, with the highest median household income of $88,672 found in the 25 to 44 years age bracket for the primary householder. A total of 213 households (30.1%) fall into this category. Meanwhile, the 65+ years age bracket for the primary householder has the lowest median household income of $32,875, with 239 households (33.8%) in this group.
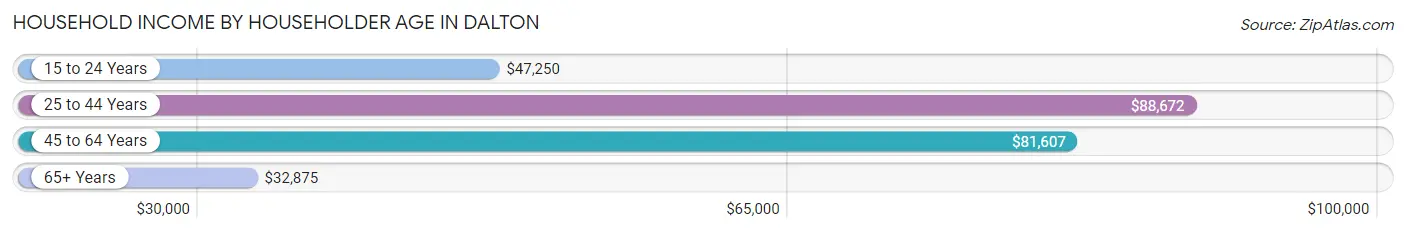
| Income Bracket | # Households | Median Income |
| 15 to 24 Years | 15 (2.1%) | $47,250 |
| 25 to 44 Years | 213 (30.1%) | $88,672 |
| 45 to 64 Years | 241 (34.0%) | $81,607 |
| 65+ Years | 239 (33.8%) | $32,875 |
| Total | 708 (100.0%) | $60,833 |
Poverty in Dalton
Income Below Poverty by Sex and Age in Dalton
With 2.3% poverty level for males and 4.1% for females among the residents of Dalton, 55 to 64 year old males and 55 to 64 year old females are the most vulnerable to poverty, with 8 males (8.9%) and 14 females (11.8%) in their respective age groups living below the poverty level.
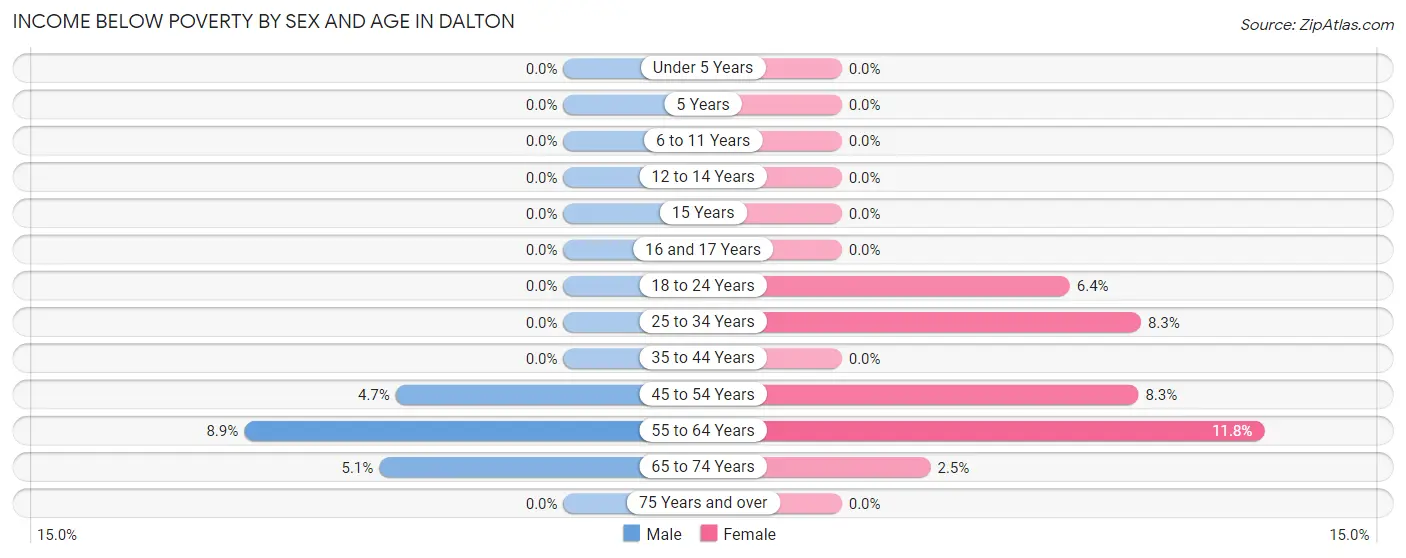
| Age Bracket | Male | Female |
| Under 5 Years | 0 (0.0%) | 0 (0.0%) |
| 5 Years | 0 (0.0%) | 0 (0.0%) |
| 6 to 11 Years | 0 (0.0%) | 0 (0.0%) |
| 12 to 14 Years | 0 (0.0%) | 0 (0.0%) |
| 15 Years | 0 (0.0%) | 0 (0.0%) |
| 16 and 17 Years | 0 (0.0%) | 0 (0.0%) |
| 18 to 24 Years | 0 (0.0%) | 4 (6.4%) |
| 25 to 34 Years | 0 (0.0%) | 6 (8.3%) |
| 35 to 44 Years | 0 (0.0%) | 0 (0.0%) |
| 45 to 54 Years | 5 (4.7%) | 9 (8.3%) |
| 55 to 64 Years | 8 (8.9%) | 14 (11.8%) |
| 65 to 74 Years | 4 (5.1%) | 2 (2.5%) |
| 75 Years and over | 0 (0.0%) | 0 (0.0%) |
| Total | 17 (2.3%) | 35 (4.1%) |
Income Above Poverty by Sex and Age in Dalton
According to the poverty statistics in Dalton, males aged under 5 years and females aged under 5 years are the age groups that are most secure financially, with 100.0% of males and 100.0% of females in these age groups living above the poverty line.
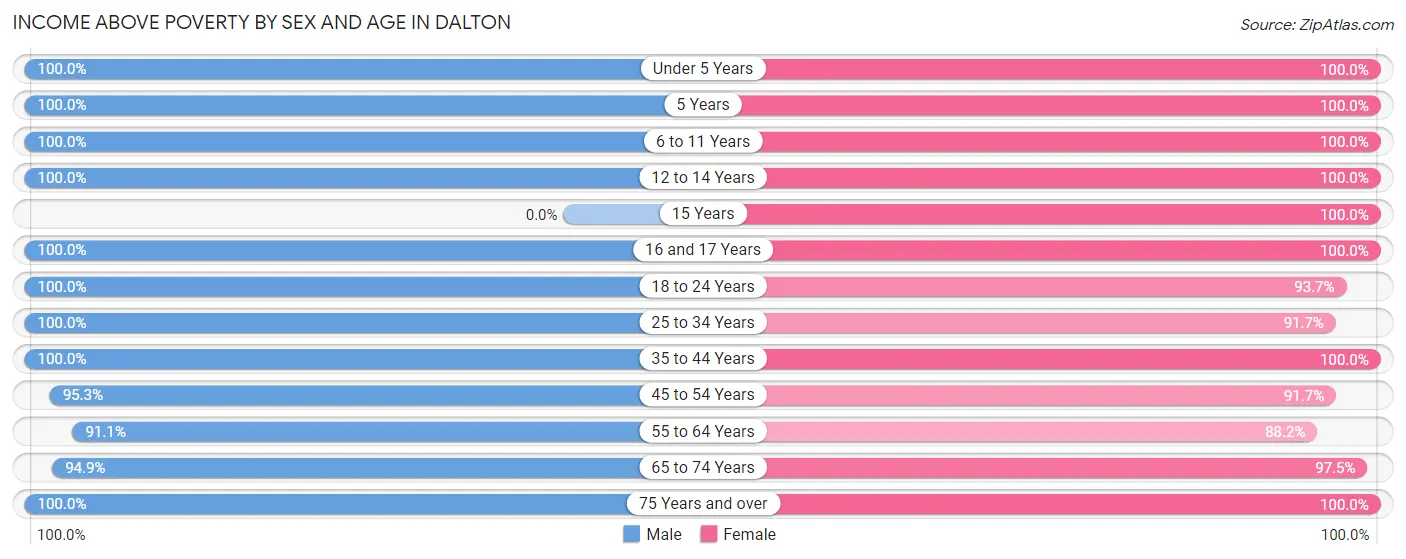
| Age Bracket | Male | Female |
| Under 5 Years | 34 (100.0%) | 31 (100.0%) |
| 5 Years | 7 (100.0%) | 6 (100.0%) |
| 6 to 11 Years | 82 (100.0%) | 68 (100.0%) |
| 12 to 14 Years | 29 (100.0%) | 17 (100.0%) |
| 15 Years | 0 (0.0%) | 11 (100.0%) |
| 16 and 17 Years | 31 (100.0%) | 35 (100.0%) |
| 18 to 24 Years | 58 (100.0%) | 59 (93.6%) |
| 25 to 34 Years | 74 (100.0%) | 66 (91.7%) |
| 35 to 44 Years | 106 (100.0%) | 112 (100.0%) |
| 45 to 54 Years | 102 (95.3%) | 100 (91.7%) |
| 55 to 64 Years | 82 (91.1%) | 105 (88.2%) |
| 65 to 74 Years | 74 (94.9%) | 79 (97.5%) |
| 75 Years and over | 55 (100.0%) | 128 (100.0%) |
| Total | 734 (97.7%) | 817 (95.9%) |
Income Below Poverty Among Married-Couple Families in Dalton
The poverty statistics for married-couple families in Dalton show that 0.8% or 3 of the total 376 families live below the poverty line. Families with no children have the highest poverty rate of 1.3%, comprising of 3 families. On the other hand, families with 1 or 2 children have the lowest poverty rate of 0.0%, which includes 0 families.
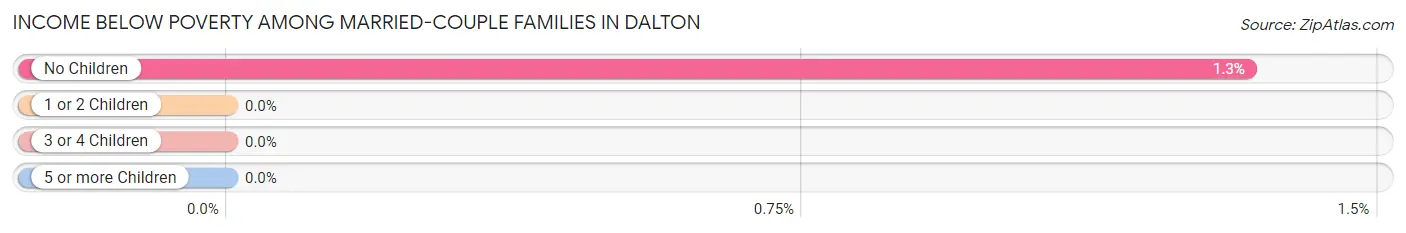
| Children | Above Poverty | Below Poverty |
| No Children | 223 (98.7%) | 3 (1.3%) |
| 1 or 2 Children | 99 (100.0%) | 0 (0.0%) |
| 3 or 4 Children | 47 (100.0%) | 0 (0.0%) |
| 5 or more Children | 4 (100.0%) | 0 (0.0%) |
| Total | 373 (99.2%) | 3 (0.8%) |
Income Below Poverty Among Single-Parent Households in Dalton
| Children | Single Father | Single Mother |
| No Children | 0 (0.0%) | 0 (0.0%) |
| 1 or 2 Children | 0 (0.0%) | 0 (0.0%) |
| 3 or 4 Children | 0 (0.0%) | 0 (0.0%) |
| 5 or more Children | 0 (0.0%) | 0 (0.0%) |
| Total | 0 (0.0%) | 0 (0.0%) |
Income Below Poverty Among Married-Couple vs Single-Parent Households in Dalton
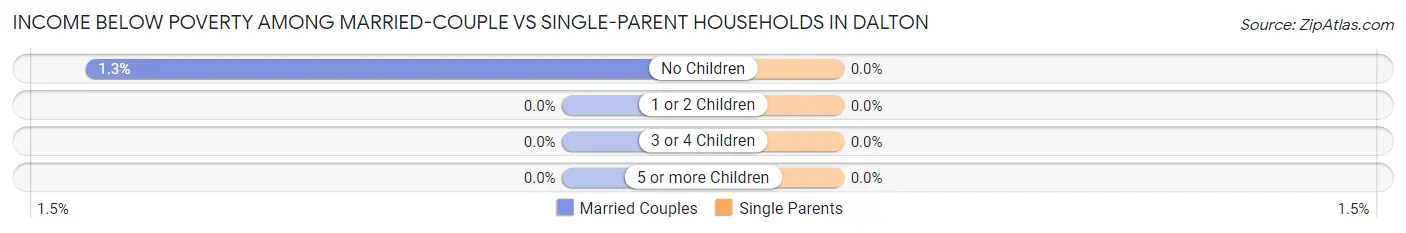
| Children | Married-Couple Families | Single-Parent Households |
| No Children | 3 (1.3%) | 0 (0.0%) |
| 1 or 2 Children | 0 (0.0%) | 0 (0.0%) |
| 3 or 4 Children | 0 (0.0%) | 0 (0.0%) |
| 5 or more Children | 0 (0.0%) | 0 (0.0%) |
| Total | 3 (0.8%) | 0 (0.0%) |
Race in Dalton
The most populous races in Dalton are White / Caucasian (1,654 | 97.1%), Hispanic or Latino (37 | 2.2%), and Two or more Races (35 | 2.1%).
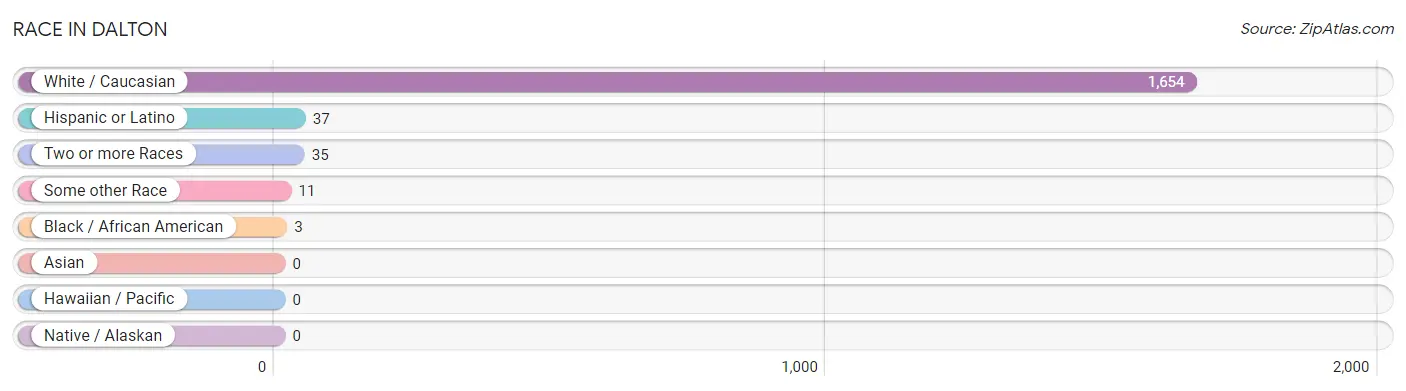
| Race | # Population | % Population |
| Asian | 0 | 0.0% |
| Black / African American | 3 | 0.2% |
| Hawaiian / Pacific | 0 | 0.0% |
| Hispanic or Latino | 37 | 2.2% |
| Native / Alaskan | 0 | 0.0% |
| White / Caucasian | 1,654 | 97.1% |
| Two or more Races | 35 | 2.1% |
| Some other Race | 11 | 0.6% |
| Total | 1,703 | 100.0% |
Ancestry in Dalton
The most populous ancestries reported in Dalton are German (660 | 38.8%), Irish (183 | 10.7%), Swiss (148 | 8.7%), English (119 | 7.0%), and American (111 | 6.5%), together accounting for 71.7% of all Dalton residents.
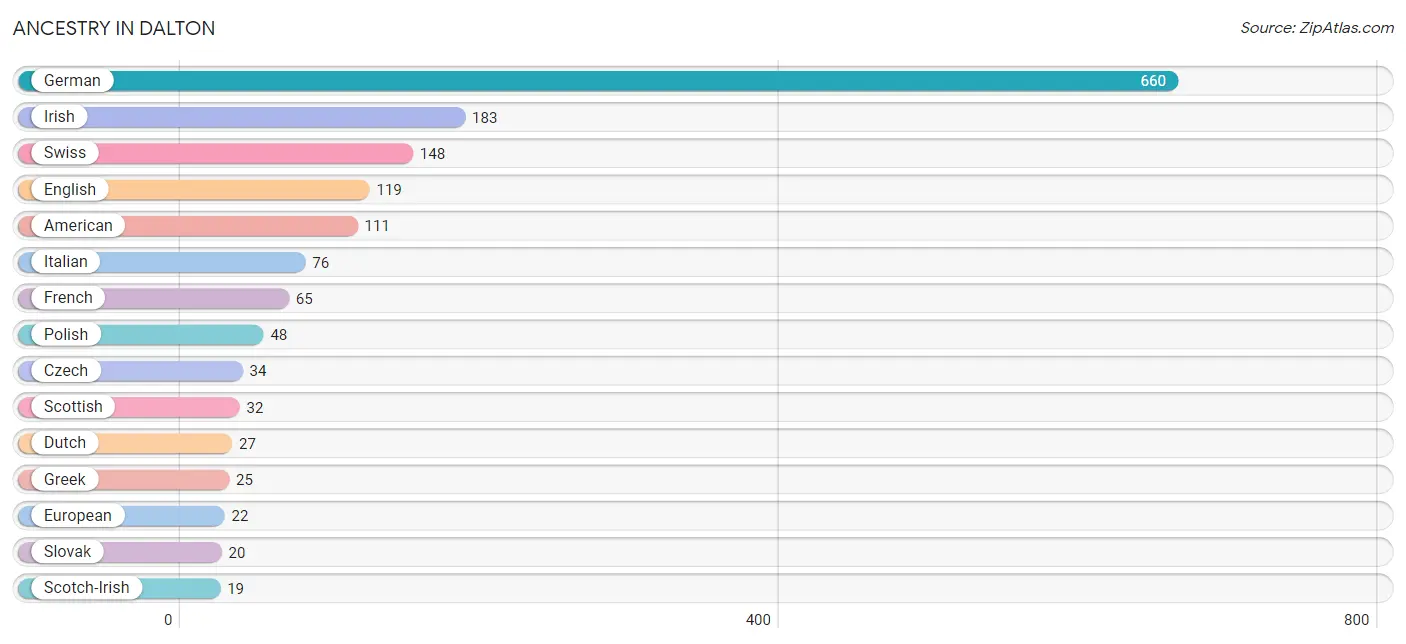
| Ancestry | # Population | % Population |
| American | 111 | 6.5% |
| Arab | 2 | 0.1% |
| Austrian | 2 | 0.1% |
| British | 3 | 0.2% |
| Cherokee | 6 | 0.4% |
| Colombian | 4 | 0.2% |
| Cree | 2 | 0.1% |
| Czech | 34 | 2.0% |
| Dutch | 27 | 1.6% |
| Eastern European | 9 | 0.5% |
| English | 119 | 7.0% |
| European | 22 | 1.3% |
| French | 65 | 3.8% |
| German | 660 | 38.8% |
| Greek | 25 | 1.5% |
| Hungarian | 5 | 0.3% |
| Irish | 183 | 10.7% |
| Italian | 76 | 4.5% |
| Lebanese | 2 | 0.1% |
| Mexican | 11 | 0.6% |
| Norwegian | 10 | 0.6% |
| Osage | 2 | 0.1% |
| Peruvian | 8 | 0.5% |
| Polish | 48 | 2.8% |
| Puerto Rican | 10 | 0.6% |
| Scotch-Irish | 19 | 1.1% |
| Scottish | 32 | 1.9% |
| Slovak | 20 | 1.2% |
| Slovene | 12 | 0.7% |
| South American | 12 | 0.7% |
| Spaniard | 4 | 0.2% |
| Swedish | 5 | 0.3% |
| Swiss | 148 | 8.7% |
| Welsh | 11 | 0.6% | View All 34 Rows |
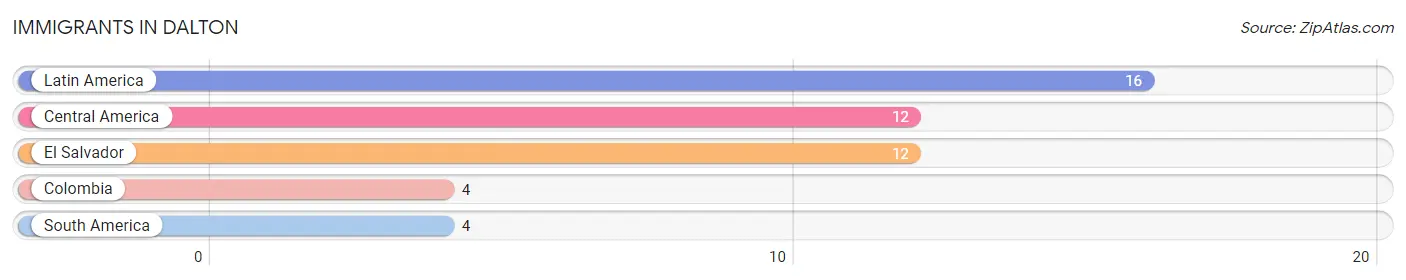
Immigrants in Dalton
The most numerous immigrant groups reported in Dalton came from Latin America (16 | 0.9%), Central America (12 | 0.7%), El Salvador (12 | 0.7%), Colombia (4 | 0.2%), and South America (4 | 0.2%), together accounting for 2.8% of all Dalton residents.
| Immigration Origin | # Population | % Population |
| Central America | 12 | 0.7% |
| Colombia | 4 | 0.2% |
| El Salvador | 12 | 0.7% |
| Latin America | 16 | 0.9% |
| South America | 4 | 0.2% | View All 5 Rows |
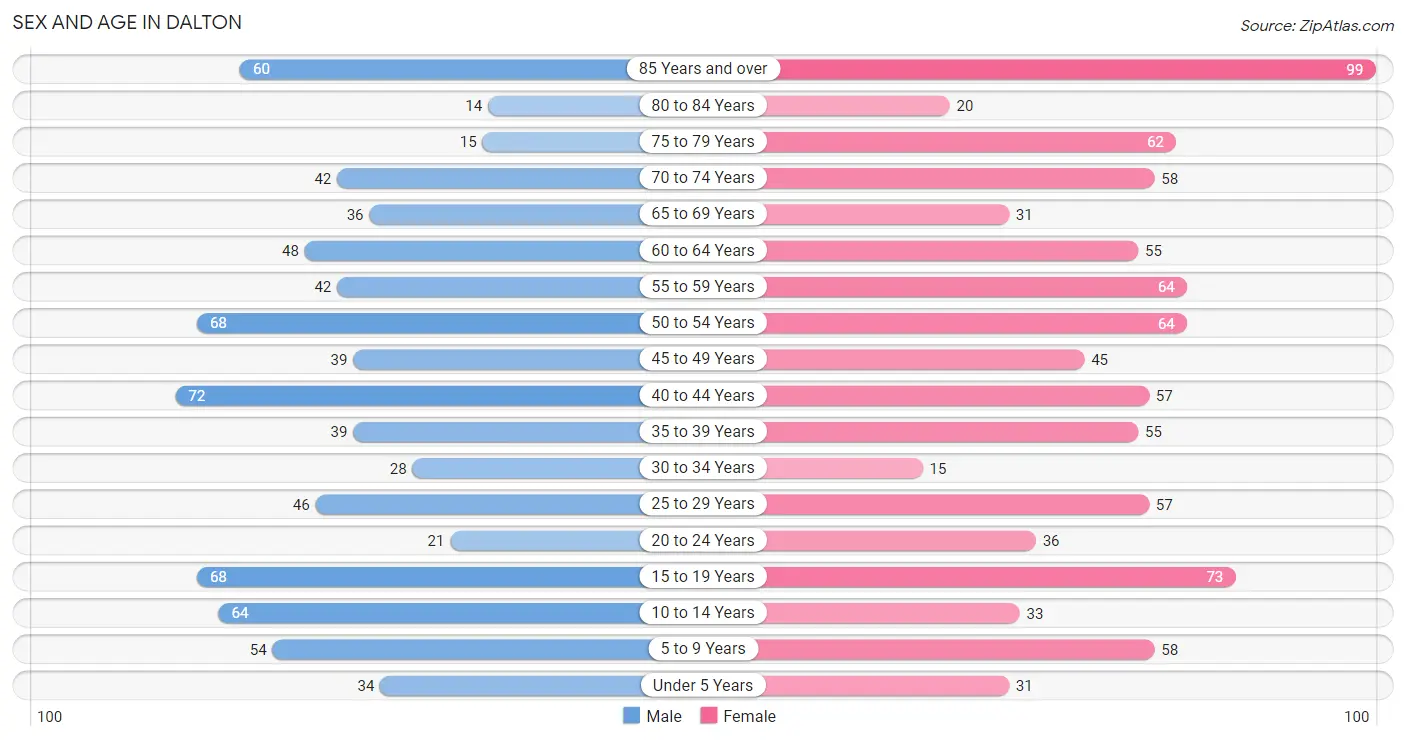
Sex and Age in Dalton
Sex and Age in Dalton
The most populous age groups in Dalton are 40 to 44 Years (72 | 9.1%) for men and 85 Years and over (99 | 10.8%) for women.
| Age Bracket | Male | Female |
| Under 5 Years | 34 (4.3%) | 31 (3.4%) |
| 5 to 9 Years | 54 (6.8%) | 58 (6.4%) |
| 10 to 14 Years | 64 (8.1%) | 33 (3.6%) |
| 15 to 19 Years | 68 (8.6%) | 73 (8.0%) |
| 20 to 24 Years | 21 (2.7%) | 36 (3.9%) |
| 25 to 29 Years | 46 (5.8%) | 57 (6.2%) |
| 30 to 34 Years | 28 (3.5%) | 15 (1.6%) |
| 35 to 39 Years | 39 (4.9%) | 55 (6.0%) |
| 40 to 44 Years | 72 (9.1%) | 57 (6.2%) |
| 45 to 49 Years | 39 (4.9%) | 45 (4.9%) |
| 50 to 54 Years | 68 (8.6%) | 64 (7.0%) |
| 55 to 59 Years | 42 (5.3%) | 64 (7.0%) |
| 60 to 64 Years | 48 (6.1%) | 55 (6.0%) |
| 65 to 69 Years | 36 (4.6%) | 31 (3.4%) |
| 70 to 74 Years | 42 (5.3%) | 58 (6.4%) |
| 75 to 79 Years | 15 (1.9%) | 62 (6.8%) |
| 80 to 84 Years | 14 (1.8%) | 20 (2.2%) |
| 85 Years and over | 60 (7.6%) | 99 (10.8%) |
| Total | 790 (100.0%) | 913 (100.0%) |
Families and Households in Dalton
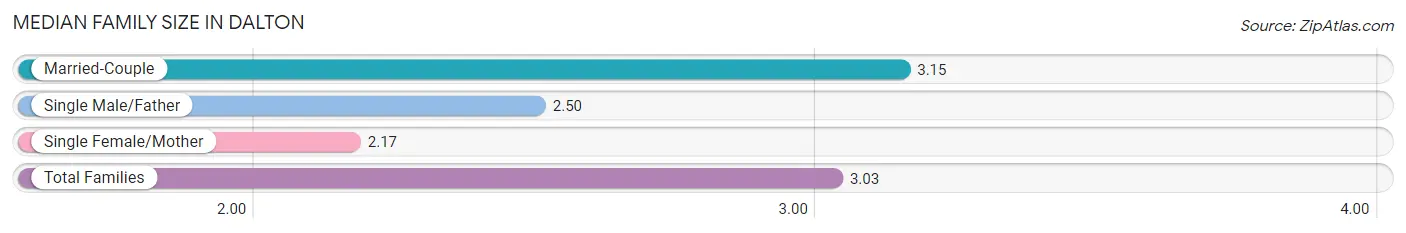
Median Family Size in Dalton
The median family size in Dalton is 3.03 persons per family, with married-couple families (376 | 87.8%) accounting for the largest median family size of 3.15 persons per family. On the other hand, single female/mother families (46 | 10.7%) represent the smallest median family size with 2.17 persons per family.
| Family Type | # Families | Family Size |
| Married-Couple | 376 (87.8%) | 3.15 |
| Single Male/Father | 6 (1.4%) | 2.50 |
| Single Female/Mother | 46 (10.7%) | 2.17 |
| Total Families | 428 (100.0%) | 3.03 |
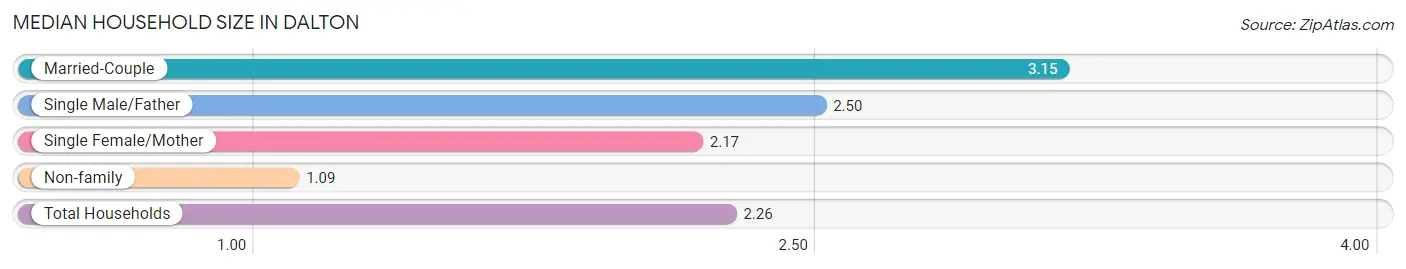
Median Household Size in Dalton
The median household size in Dalton is 2.26 persons per household, with married-couple households (376 | 53.1%) accounting for the largest median household size of 3.15 persons per household. non-family households (280 | 39.6%) represent the smallest median household size with 1.09 persons per household.
| Household Type | # Households | Household Size |
| Married-Couple | 376 (53.1%) | 3.15 |
| Single Male/Father | 6 (0.9%) | 2.50 |
| Single Female/Mother | 46 (6.5%) | 2.17 |
| Non-family | 280 (39.6%) | 1.09 |
| Total Households | 708 (100.0%) | 2.26 |
Household Size by Marriage Status in Dalton
Out of a total of 708 households in Dalton, 428 (60.5%) are family households, while 280 (39.6%) are nonfamily households. The most numerous type of family households are 2-person households, comprising 202, and the most common type of nonfamily households are 1-person households, comprising 257.
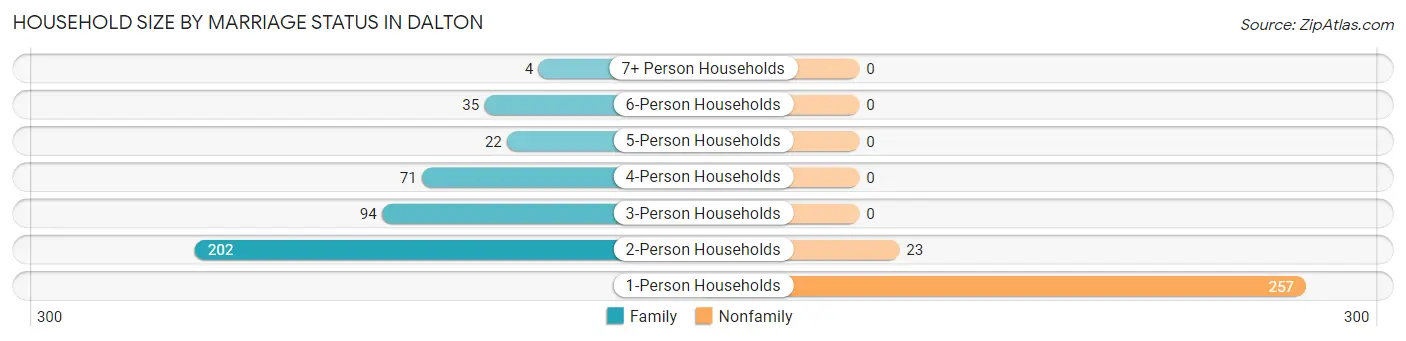
| Household Size | Family Households | Nonfamily Households |
| 1-Person Households | - | 257 (36.3%) |
| 2-Person Households | 202 (28.5%) | 23 (3.3%) |
| 3-Person Households | 94 (13.3%) | 0 (0.0%) |
| 4-Person Households | 71 (10.0%) | 0 (0.0%) |
| 5-Person Households | 22 (3.1%) | 0 (0.0%) |
| 6-Person Households | 35 (4.9%) | 0 (0.0%) |
| 7+ Person Households | 4 (0.6%) | 0 (0.0%) |
| Total | 428 (60.5%) | 280 (39.6%) |
Female Fertility in Dalton
Fertility by Age in Dalton
Average fertility rate in Dalton is 52.0 births per 1,000 women. Women in the age bracket of 20 to 34 years have the highest fertility rate with 139.0 births per 1,000 women. Women in the age bracket of 20 to 34 years acount for 83.3% of all women with births.
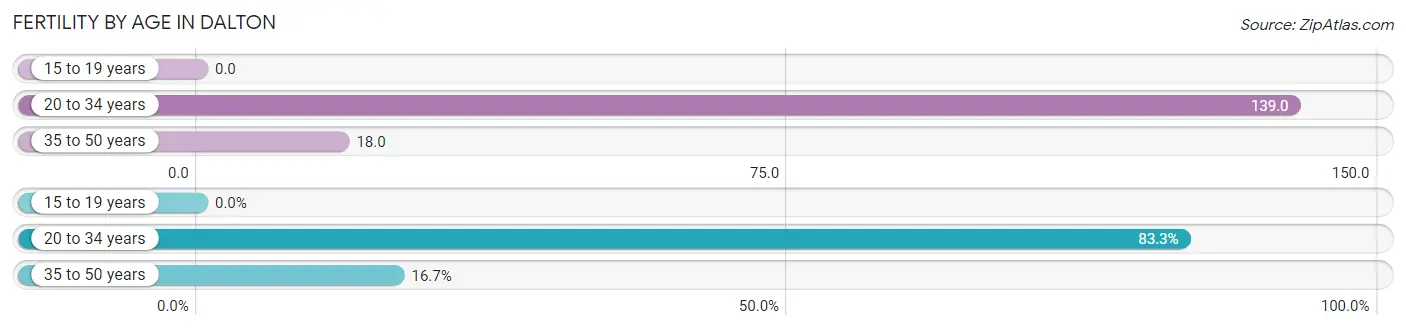
| Age Bracket | Women with Births | Births / 1,000 Women |
| 15 to 19 years | 0 (0.0%) | 0.0 |
| 20 to 34 years | 15 (83.3%) | 139.0 |
| 35 to 50 years | 3 (16.7%) | 18.0 |
| Total | 18 (100.0%) | 52.0 |
Fertility by Age by Marriage Status in Dalton
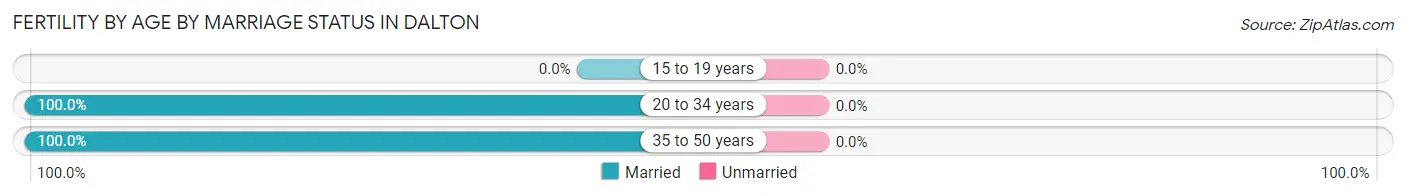
| Age Bracket | Married | Unmarried |
| 15 to 19 years | 0 (0.0%) | 0 (0.0%) |
| 20 to 34 years | 15 (100.0%) | 0 (0.0%) |
| 35 to 50 years | 3 (100.0%) | 0 (0.0%) |
| Total | 18 (100.0%) | 0 (0.0%) |
Fertility by Education in Dalton
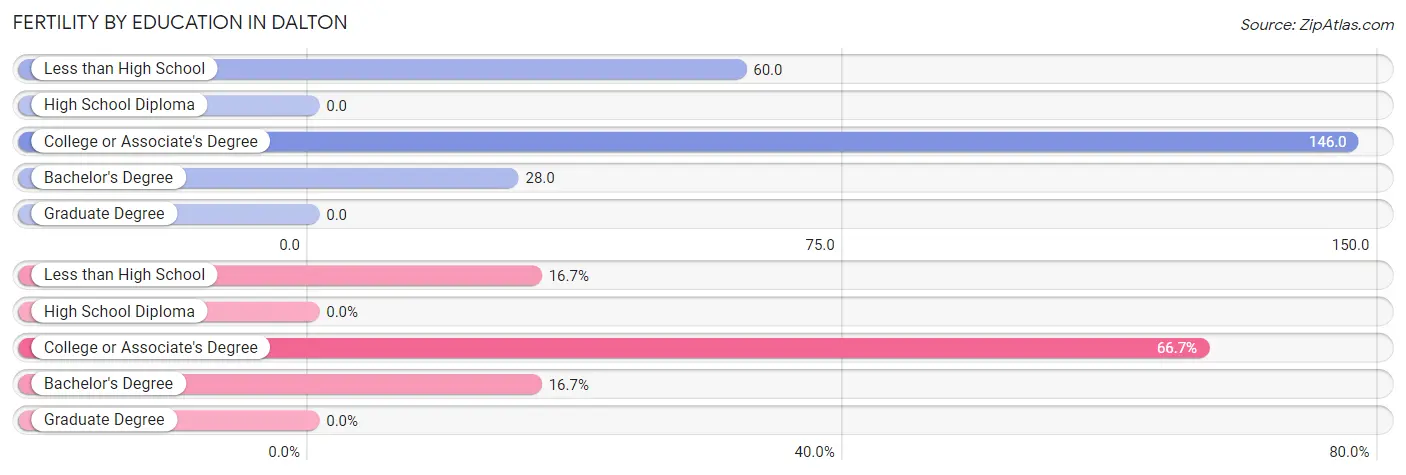
| Educational Attainment | Women with Births | Births / 1,000 Women |
| Less than High School | 3 (16.7%) | 60.0 |
| High School Diploma | 0 (0.0%) | 0.0 |
| College or Associate's Degree | 12 (66.7%) | 146.0 |
| Bachelor's Degree | 3 (16.7%) | 28.0 |
| Graduate Degree | 0 (0.0%) | 0.0 |
| Total | 18 (100.0%) | 52.0 |
Fertility by Education by Marriage Status in Dalton
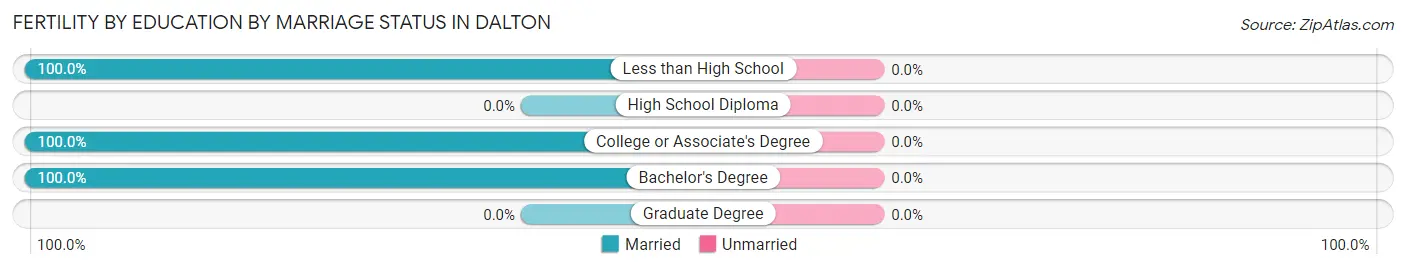
| Educational Attainment | Married | Unmarried |
| Less than High School | 3 (100.0%) | 0 (0.0%) |
| High School Diploma | 0 (0.0%) | 0 (0.0%) |
| College or Associate's Degree | 12 (100.0%) | 0 (0.0%) |
| Bachelor's Degree | 3 (100.0%) | 0 (0.0%) |
| Graduate Degree | 0 (0.0%) | 0 (0.0%) |
| Total | 18 (100.0%) | 0 (0.0%) |
Employment Characteristics in Dalton
Employment by Class of Employer in Dalton
Among the 823 employed individuals in Dalton, private company employees (532 | 64.6%), not-for-profit organizations (100 | 12.1%), and local government employees (89 | 10.8%) make up the most common classes of employment.
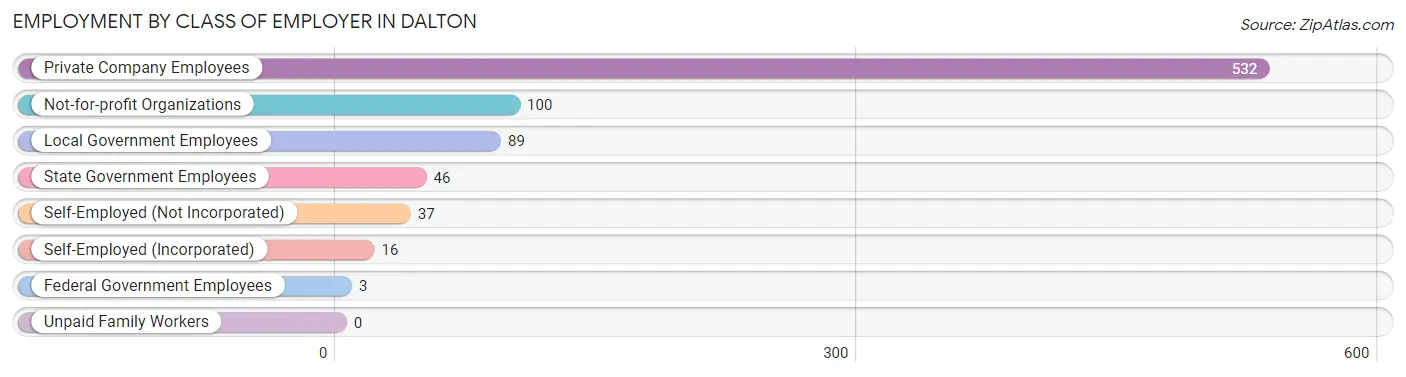
| Employer Class | # Employees | % Employees |
| Private Company Employees | 532 | 64.6% |
| Self-Employed (Incorporated) | 16 | 1.9% |
| Self-Employed (Not Incorporated) | 37 | 4.5% |
| Not-for-profit Organizations | 100 | 12.1% |
| Local Government Employees | 89 | 10.8% |
| State Government Employees | 46 | 5.6% |
| Federal Government Employees | 3 | 0.4% |
| Unpaid Family Workers | 0 | 0.0% |
| Total | 823 | 100.0% |
Employment Status by Age in Dalton
According to the labor force statistics for Dalton, out of the total population over 16 years of age (1,418), 59.4% or 842 individuals are in the labor force, with 1.3% or 11 of them unemployed. The age group with the highest labor force participation rate is 55 to 59 years, with 98.1% or 104 individuals in the labor force. Within the labor force, the 75 years and over age range has the highest percentage of unemployed individuals, with 33.3% or 2 of them being unemployed.
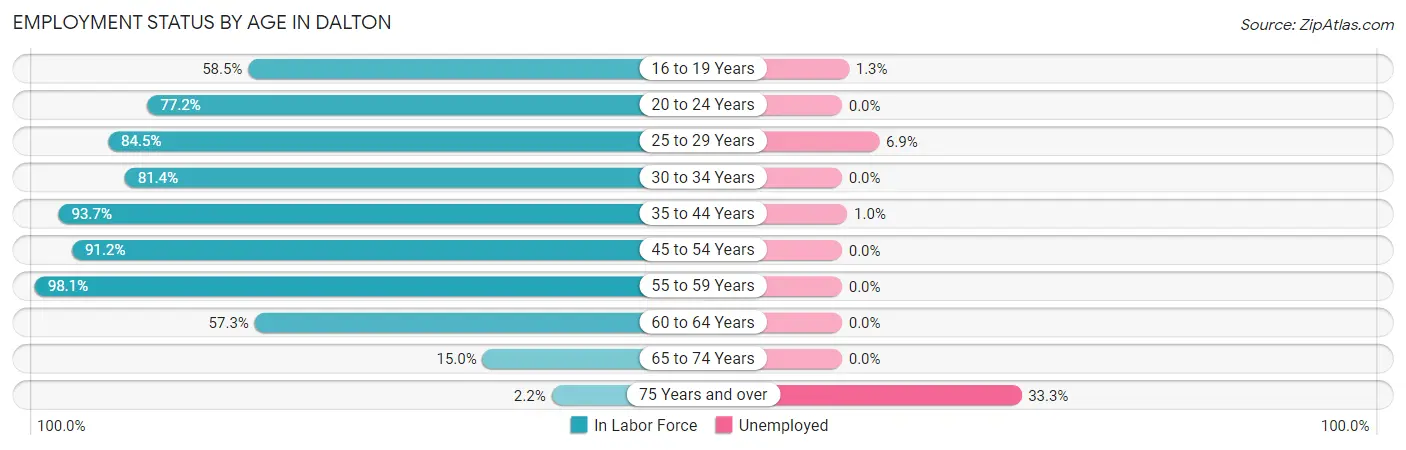
| Age Bracket | In Labor Force | Unemployed |
| 16 to 19 Years | 76 (58.5%) | 1 (1.3%) |
| 20 to 24 Years | 44 (77.2%) | 0 (0.0%) |
| 25 to 29 Years | 87 (84.5%) | 6 (6.9%) |
| 30 to 34 Years | 35 (81.4%) | 0 (0.0%) |
| 35 to 44 Years | 209 (93.7%) | 2 (1.0%) |
| 45 to 54 Years | 197 (91.2%) | 0 (0.0%) |
| 55 to 59 Years | 104 (98.1%) | 0 (0.0%) |
| 60 to 64 Years | 59 (57.3%) | 0 (0.0%) |
| 65 to 74 Years | 25 (15.0%) | 0 (0.0%) |
| 75 Years and over | 6 (2.2%) | 2 (33.3%) |
| Total | 842 (59.4%) | 11 (1.3%) |
Employment Status by Educational Attainment in Dalton
According to labor force statistics for Dalton, 87.0% of individuals (691) out of the total population between 25 and 64 years of age (794) are in the labor force, with 1.2% or 8 of them being unemployed. The group with the highest labor force participation rate are those with the educational attainment of college / associate degree, with 94.0% or 173 individuals in the labor force. Within the labor force, individuals with high school diploma education have the highest percentage of unemployment, with 2.0% or 5 of them being unemployed.
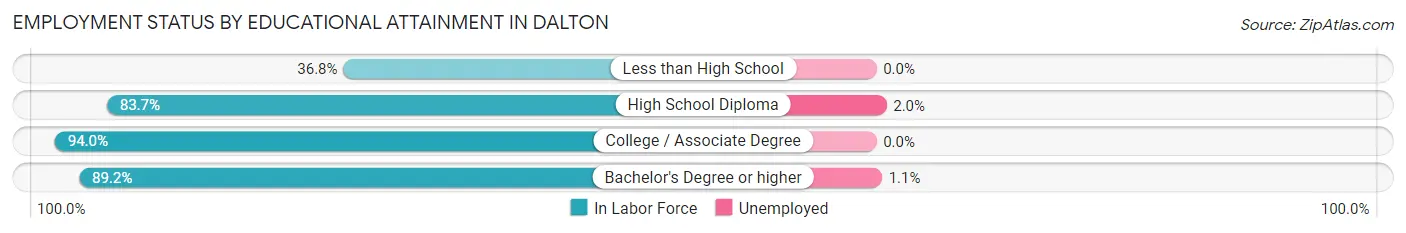
| Educational Attainment | In Labor Force | Unemployed |
| Less than High School | 7 (36.8%) | 0 (0.0%) |
| High School Diploma | 246 (83.7%) | 6 (2.0%) |
| College / Associate Degree | 173 (94.0%) | 0 (0.0%) |
| Bachelor's Degree or higher | 265 (89.2%) | 3 (1.1%) |
| Total | 691 (87.0%) | 10 (1.2%) |
Employment Occupations by Sex in Dalton
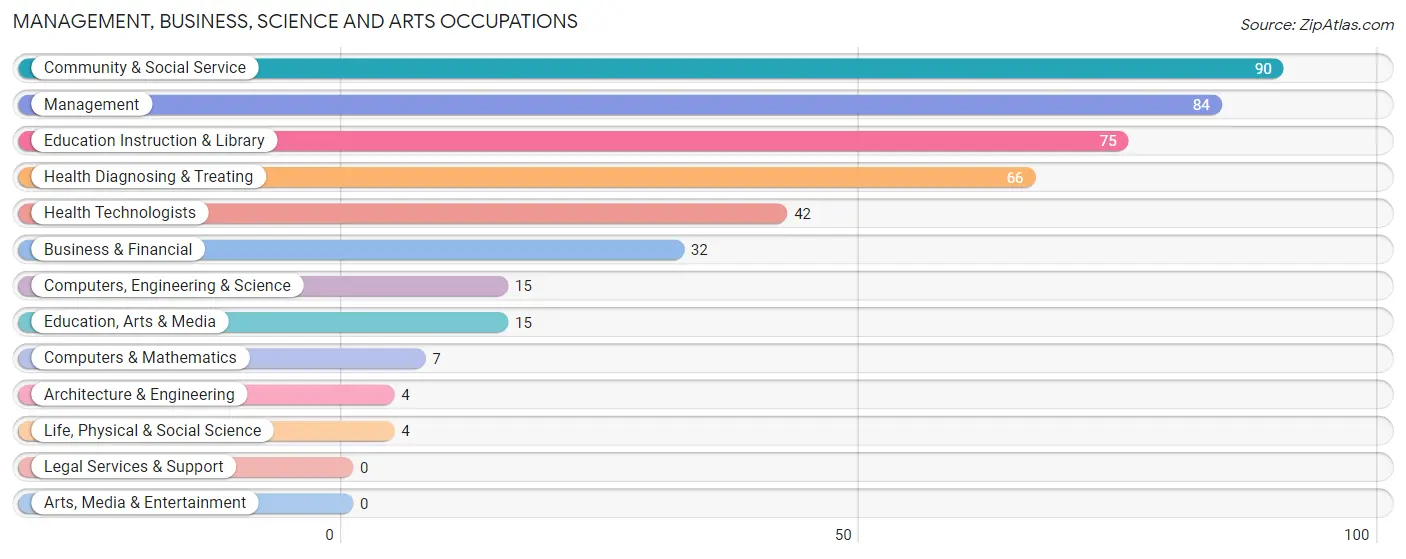
Management, Business, Science and Arts Occupations
The most common Management, Business, Science and Arts occupations in Dalton are Community & Social Service (90 | 10.8%), Management (84 | 10.1%), Education Instruction & Library (75 | 9.0%), Health Diagnosing & Treating (66 | 7.9%), and Health Technologists (42 | 5.1%).
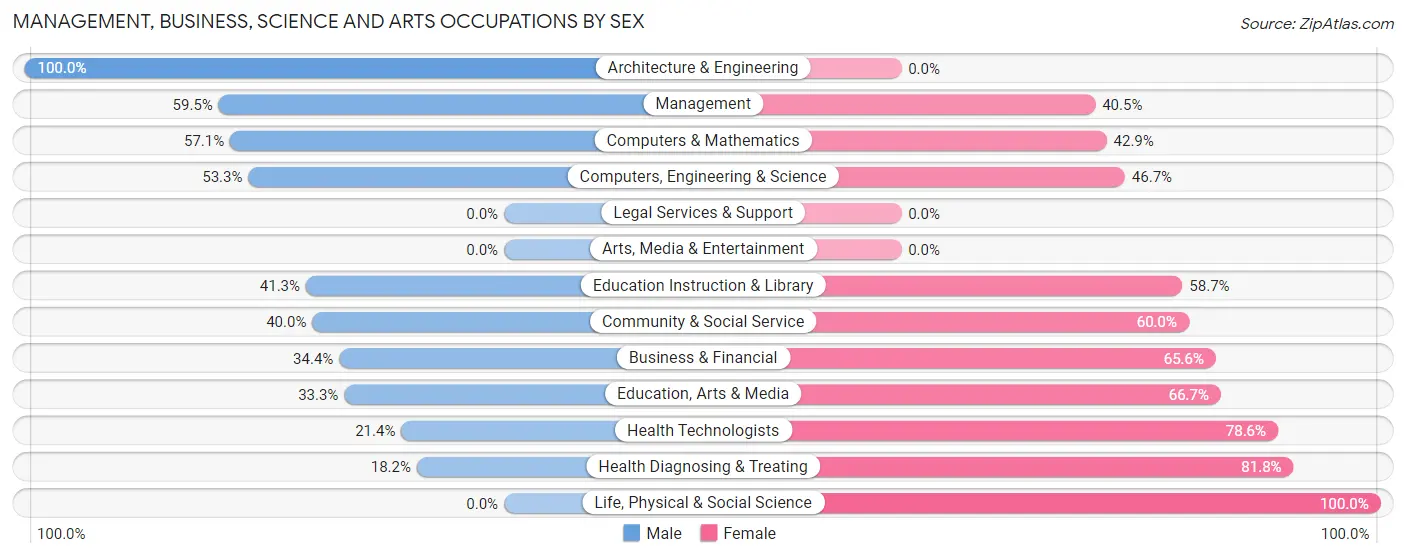
Management, Business, Science and Arts Occupations by Sex
Within the Management, Business, Science and Arts occupations in Dalton, the most male-oriented occupations are Architecture & Engineering (100.0%), Management (59.5%), and Computers & Mathematics (57.1%), while the most female-oriented occupations are Life, Physical & Social Science (100.0%), Health Diagnosing & Treating (81.8%), and Health Technologists (78.6%).
| Occupation | Male | Female |
| Management | 50 (59.5%) | 34 (40.5%) |
| Business & Financial | 11 (34.4%) | 21 (65.6%) |
| Computers, Engineering & Science | 8 (53.3%) | 7 (46.7%) |
| Computers & Mathematics | 4 (57.1%) | 3 (42.9%) |
| Architecture & Engineering | 4 (100.0%) | 0 (0.0%) |
| Life, Physical & Social Science | 0 (0.0%) | 4 (100.0%) |
| Community & Social Service | 36 (40.0%) | 54 (60.0%) |
| Education, Arts & Media | 5 (33.3%) | 10 (66.7%) |
| Legal Services & Support | 0 (0.0%) | 0 (0.0%) |
| Education Instruction & Library | 31 (41.3%) | 44 (58.7%) |
| Arts, Media & Entertainment | 0 (0.0%) | 0 (0.0%) |
| Health Diagnosing & Treating | 12 (18.2%) | 54 (81.8%) |
| Health Technologists | 9 (21.4%) | 33 (78.6%) |
| Total (Category) | 117 (40.8%) | 170 (59.2%) |
| Total (Overall) | 398 (47.9%) | 433 (52.1%) |
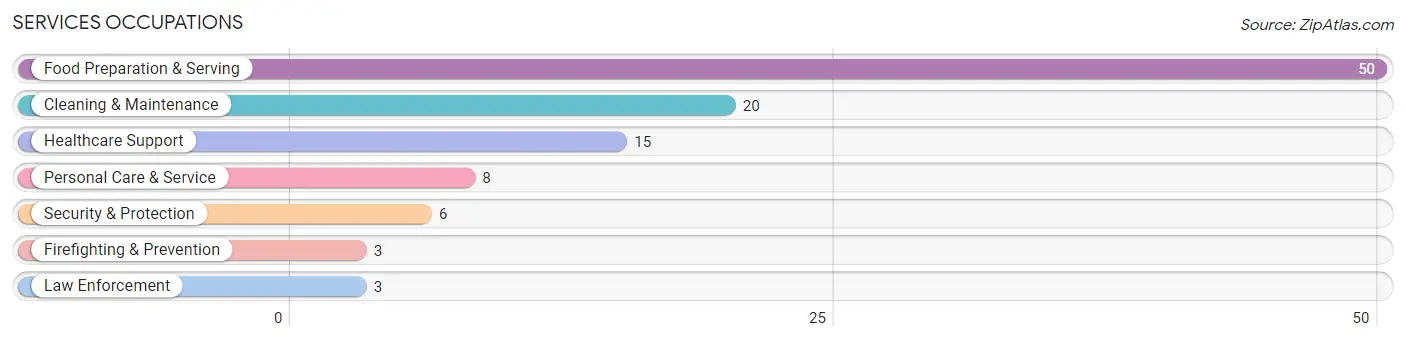
Services Occupations
The most common Services occupations in Dalton are Food Preparation & Serving (50 | 6.0%), Cleaning & Maintenance (20 | 2.4%), Healthcare Support (15 | 1.8%), Personal Care & Service (8 | 1.0%), and Security & Protection (6 | 0.7%).
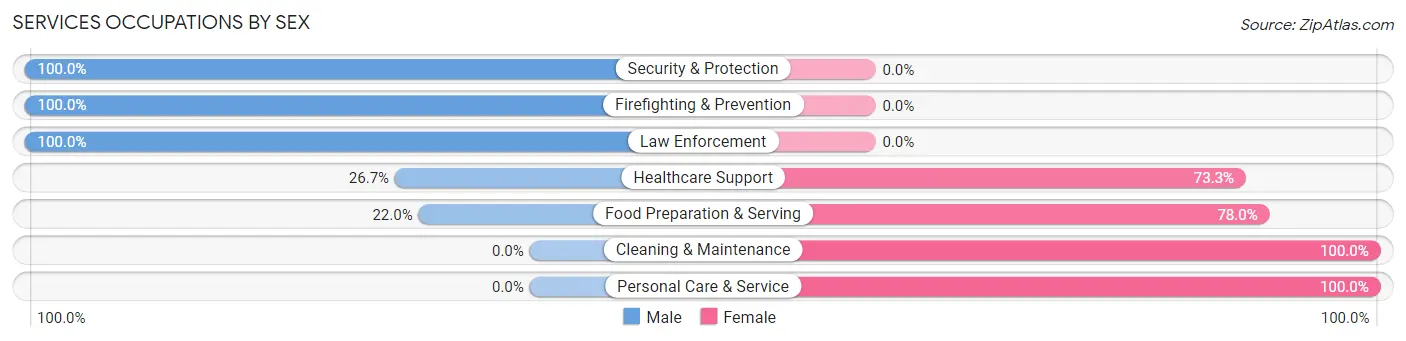
Services Occupations by Sex
Within the Services occupations in Dalton, the most male-oriented occupations are Security & Protection (100.0%), Firefighting & Prevention (100.0%), and Law Enforcement (100.0%), while the most female-oriented occupations are Cleaning & Maintenance (100.0%), Personal Care & Service (100.0%), and Food Preparation & Serving (78.0%).
| Occupation | Male | Female |
| Healthcare Support | 4 (26.7%) | 11 (73.3%) |
| Security & Protection | 6 (100.0%) | 0 (0.0%) |
| Firefighting & Prevention | 3 (100.0%) | 0 (0.0%) |
| Law Enforcement | 3 (100.0%) | 0 (0.0%) |
| Food Preparation & Serving | 11 (22.0%) | 39 (78.0%) |
| Cleaning & Maintenance | 0 (0.0%) | 20 (100.0%) |
| Personal Care & Service | 0 (0.0%) | 8 (100.0%) |
| Total (Category) | 21 (21.2%) | 78 (78.8%) |
| Total (Overall) | 398 (47.9%) | 433 (52.1%) |
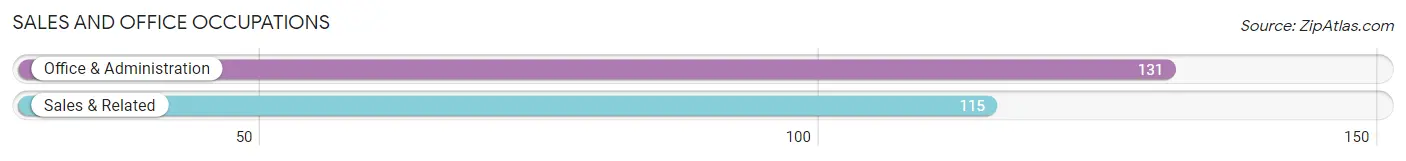
Sales and Office Occupations
The most common Sales and Office occupations in Dalton are Office & Administration (131 | 15.8%), and Sales & Related (115 | 13.8%).
Sales and Office Occupations by Sex
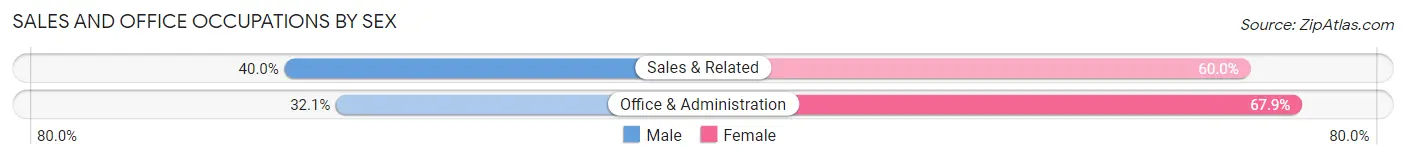
| Occupation | Male | Female |
| Sales & Related | 46 (40.0%) | 69 (60.0%) |
| Office & Administration | 42 (32.1%) | 89 (67.9%) |
| Total (Category) | 88 (35.8%) | 158 (64.2%) |
| Total (Overall) | 398 (47.9%) | 433 (52.1%) |
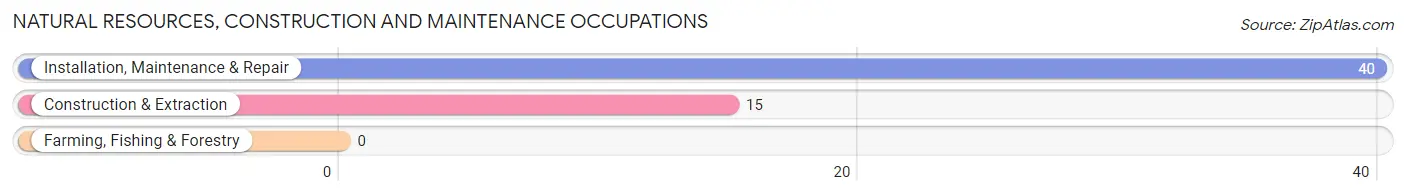
Natural Resources, Construction and Maintenance Occupations
The most common Natural Resources, Construction and Maintenance occupations in Dalton are Installation, Maintenance & Repair (40 | 4.8%), and Construction & Extraction (15 | 1.8%).
Natural Resources, Construction and Maintenance Occupations by Sex
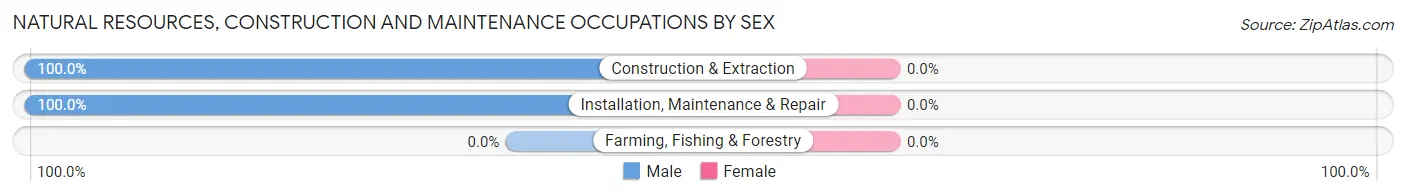
| Occupation | Male | Female |
| Farming, Fishing & Forestry | 0 (0.0%) | 0 (0.0%) |
| Construction & Extraction | 15 (100.0%) | 0 (0.0%) |
| Installation, Maintenance & Repair | 40 (100.0%) | 0 (0.0%) |
| Total (Category) | 55 (100.0%) | 0 (0.0%) |
| Total (Overall) | 398 (47.9%) | 433 (52.1%) |
Production, Transportation and Moving Occupations
The most common Production, Transportation and Moving occupations in Dalton are Production (75 | 9.0%), Material Moving (37 | 4.4%), and Transportation (32 | 3.8%).
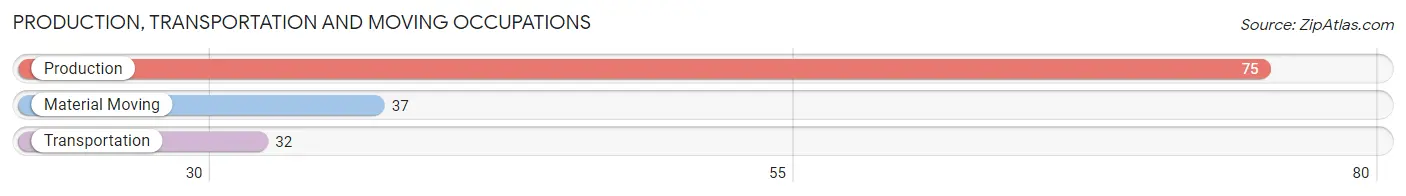
Production, Transportation and Moving Occupations by Sex
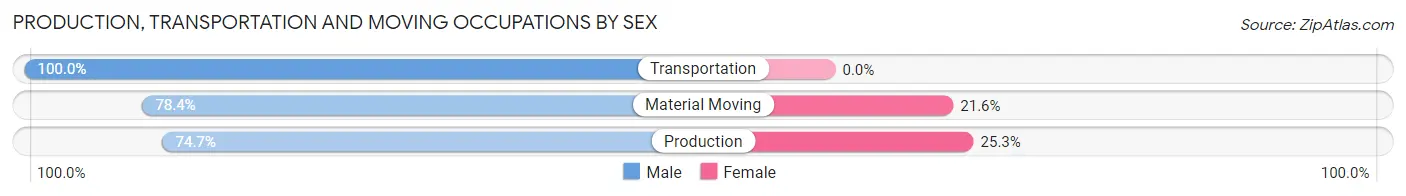
| Occupation | Male | Female |
| Production | 56 (74.7%) | 19 (25.3%) |
| Transportation | 32 (100.0%) | 0 (0.0%) |
| Material Moving | 29 (78.4%) | 8 (21.6%) |
| Total (Category) | 117 (81.2%) | 27 (18.8%) |
| Total (Overall) | 398 (47.9%) | 433 (52.1%) |
Employment Industries by Sex in Dalton
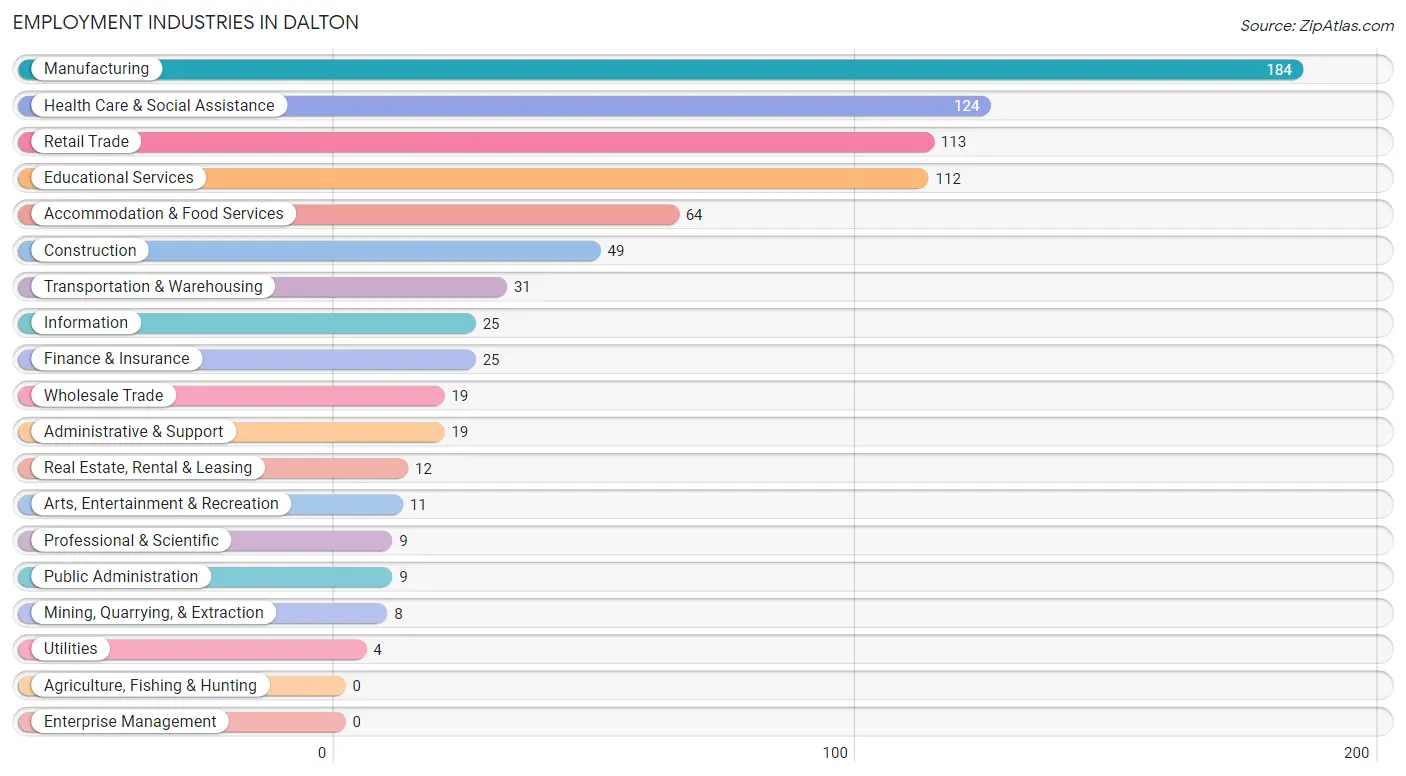
Employment Industries in Dalton
The major employment industries in Dalton include Manufacturing (184 | 22.1%), Health Care & Social Assistance (124 | 14.9%), Retail Trade (113 | 13.6%), Educational Services (112 | 13.5%), and Accommodation & Food Services (64 | 7.7%).
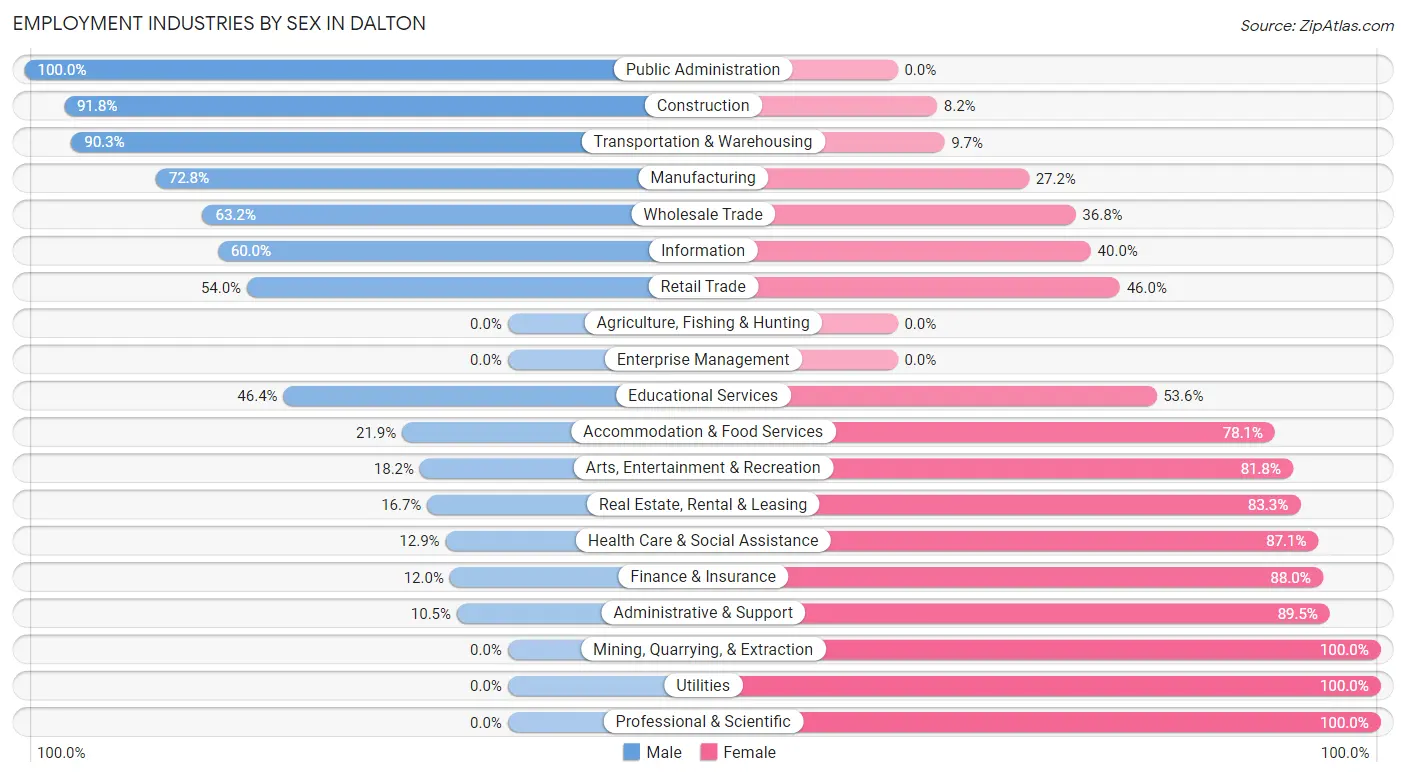
Employment Industries by Sex in Dalton
The Dalton industries that see more men than women are Public Administration (100.0%), Construction (91.8%), and Transportation & Warehousing (90.3%), whereas the industries that tend to have a higher number of women are Mining, Quarrying, & Extraction (100.0%), Utilities (100.0%), and Professional & Scientific (100.0%).
| Industry | Male | Female |
| Agriculture, Fishing & Hunting | 0 (0.0%) | 0 (0.0%) |
| Mining, Quarrying, & Extraction | 0 (0.0%) | 8 (100.0%) |
| Construction | 45 (91.8%) | 4 (8.2%) |
| Manufacturing | 134 (72.8%) | 50 (27.2%) |
| Wholesale Trade | 12 (63.2%) | 7 (36.8%) |
| Retail Trade | 61 (54.0%) | 52 (46.0%) |
| Transportation & Warehousing | 28 (90.3%) | 3 (9.7%) |
| Utilities | 0 (0.0%) | 4 (100.0%) |
| Information | 15 (60.0%) | 10 (40.0%) |
| Finance & Insurance | 3 (12.0%) | 22 (88.0%) |
| Real Estate, Rental & Leasing | 2 (16.7%) | 10 (83.3%) |
| Professional & Scientific | 0 (0.0%) | 9 (100.0%) |
| Enterprise Management | 0 (0.0%) | 0 (0.0%) |
| Administrative & Support | 2 (10.5%) | 17 (89.5%) |
| Educational Services | 52 (46.4%) | 60 (53.6%) |
| Health Care & Social Assistance | 16 (12.9%) | 108 (87.1%) |
| Arts, Entertainment & Recreation | 2 (18.2%) | 9 (81.8%) |
| Accommodation & Food Services | 14 (21.9%) | 50 (78.1%) |
| Public Administration | 9 (100.0%) | 0 (0.0%) |
| Total | 398 (47.9%) | 433 (52.1%) |
Education in Dalton
School Enrollment in Dalton
The most common levels of schooling among the 403 students in Dalton are elementary school (106 | 26.3%), high school (93 | 23.1%), and college / undergraduate (88 | 21.8%).
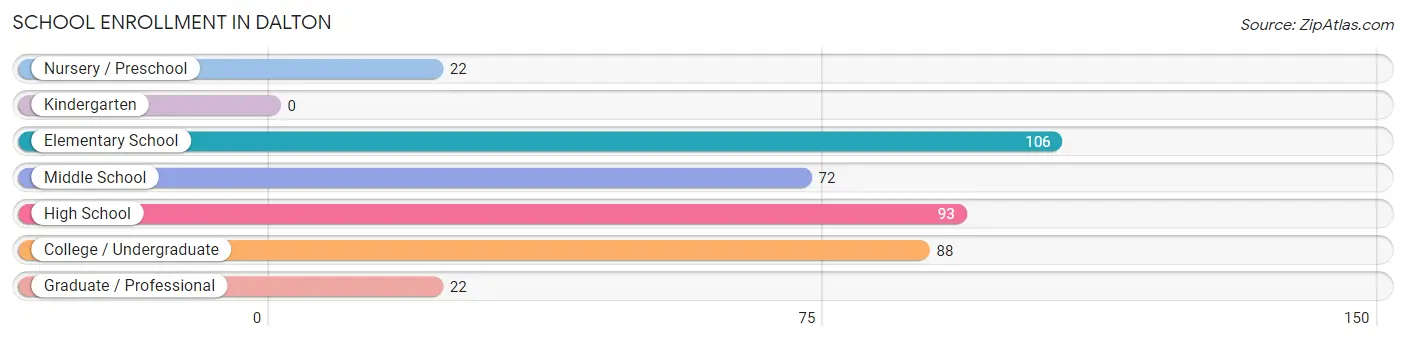
| School Level | # Students | % Students |
| Nursery / Preschool | 22 | 5.5% |
| Kindergarten | 0 | 0.0% |
| Elementary School | 106 | 26.3% |
| Middle School | 72 | 17.9% |
| High School | 93 | 23.1% |
| College / Undergraduate | 88 | 21.8% |
| Graduate / Professional | 22 | 5.5% |
| Total | 403 | 100.0% |
School Enrollment by Age by Funding Source in Dalton
Out of a total of 403 students who are enrolled in schools in Dalton, 88 (21.8%) attend a private institution, while the remaining 315 (78.2%) are enrolled in public schools. The age group of 3 to 4 year olds has the highest likelihood of being enrolled in private schools, with 8 (66.7% in the age bracket) enrolled. Conversely, the age group of 35 years and over has the lowest likelihood of being enrolled in a private school, with 13 (100.0% in the age bracket) attending a public institution.
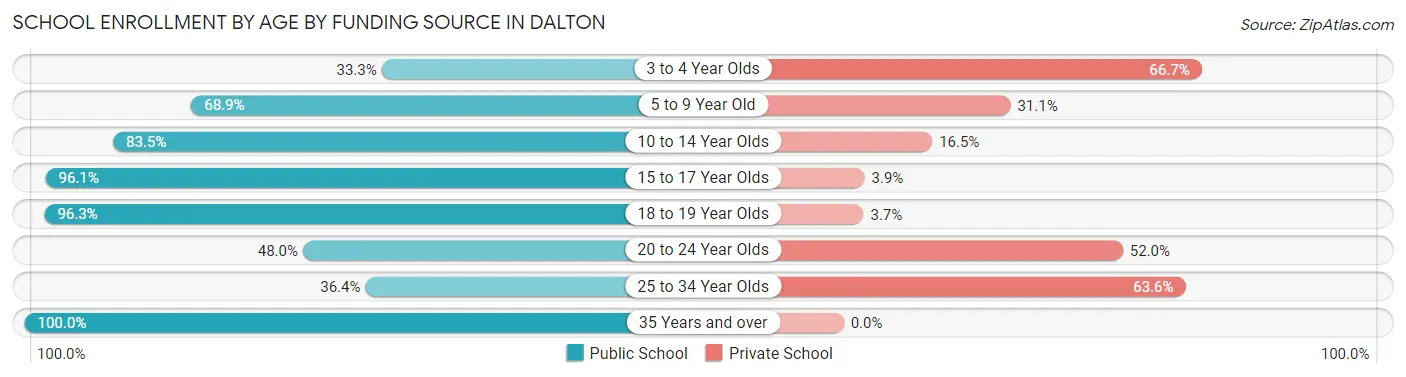
| Age Bracket | Public School | Private School |
| 3 to 4 Year Olds | 4 (33.3%) | 8 (66.7%) |
| 5 to 9 Year Old | 71 (68.9%) | 32 (31.1%) |
| 10 to 14 Year Olds | 81 (83.5%) | 16 (16.5%) |
| 15 to 17 Year Olds | 74 (96.1%) | 3 (3.9%) |
| 18 to 19 Year Olds | 52 (96.3%) | 2 (3.7%) |
| 20 to 24 Year Olds | 12 (48.0%) | 13 (52.0%) |
| 25 to 34 Year Olds | 8 (36.4%) | 14 (63.6%) |
| 35 Years and over | 13 (100.0%) | 0 (0.0%) |
| Total | 315 (78.2%) | 88 (21.8%) |
Educational Attainment by Field of Study in Dalton
Education (106 | 28.3%), business (67 | 17.9%), science & technology (63 | 16.8%), arts & humanities (36 | 9.6%), and liberal arts & history (20 | 5.3%) are the most common fields of study among 374 individuals in Dalton who have obtained a bachelor's degree or higher.
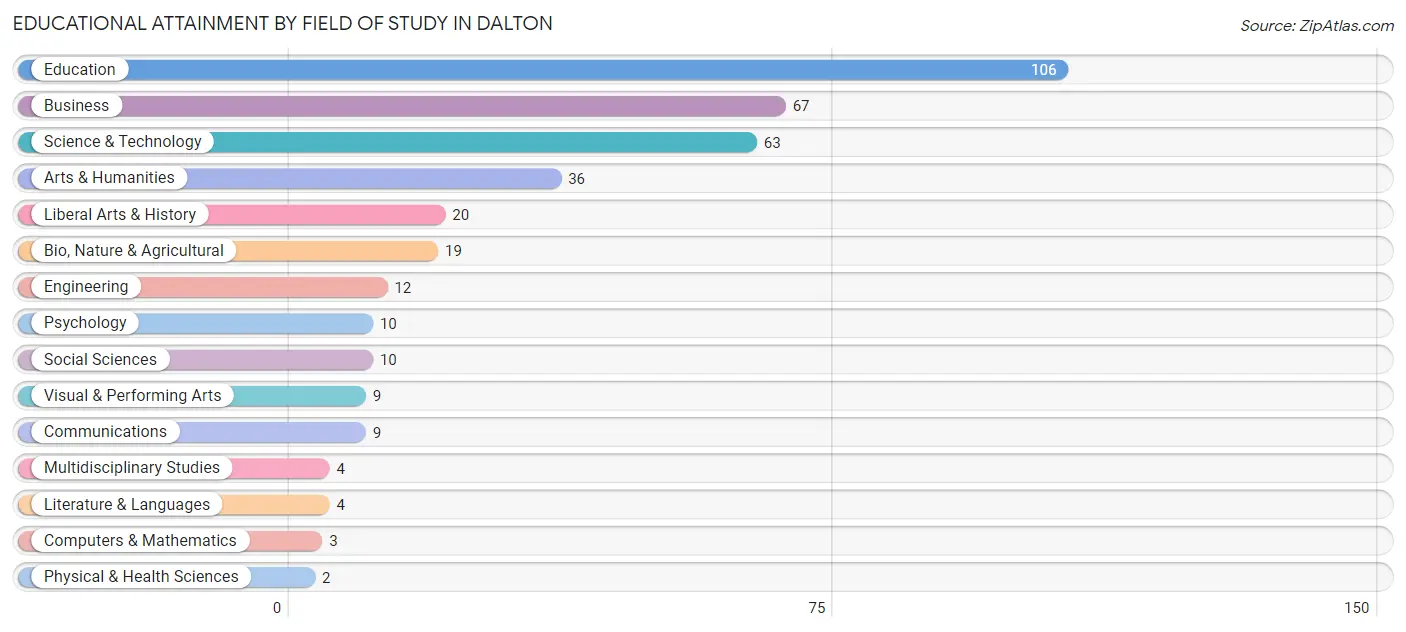
| Field of Study | # Graduates | % Graduates |
| Computers & Mathematics | 3 | 0.8% |
| Bio, Nature & Agricultural | 19 | 5.1% |
| Physical & Health Sciences | 2 | 0.5% |
| Psychology | 10 | 2.7% |
| Social Sciences | 10 | 2.7% |
| Engineering | 12 | 3.2% |
| Multidisciplinary Studies | 4 | 1.1% |
| Science & Technology | 63 | 16.8% |
| Business | 67 | 17.9% |
| Education | 106 | 28.3% |
| Literature & Languages | 4 | 1.1% |
| Liberal Arts & History | 20 | 5.3% |
| Visual & Performing Arts | 9 | 2.4% |
| Communications | 9 | 2.4% |
| Arts & Humanities | 36 | 9.6% |
| Total | 374 | 100.0% |
Transportation & Commute in Dalton
Vehicle Availability by Sex in Dalton
The most prevalent vehicle ownership categories in Dalton are males with 2 vehicles (165, accounting for 41.5%) and females with 2 vehicles (180, making up 38.8%).
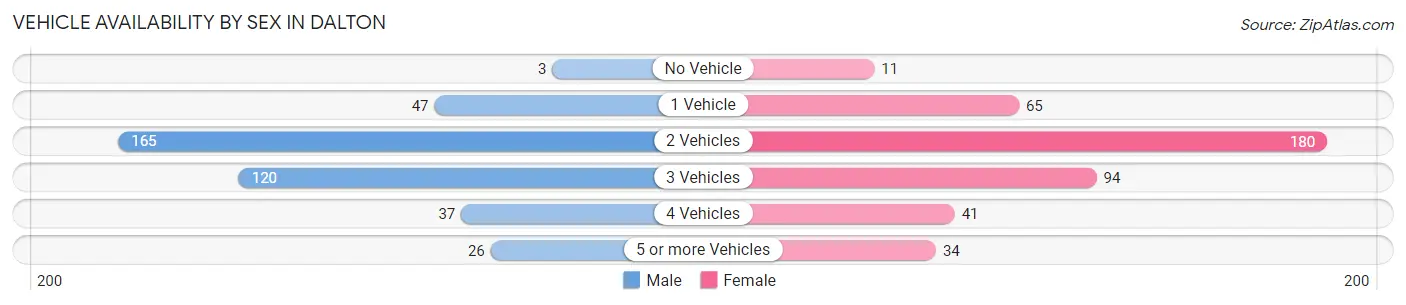
| Vehicles Available | Male | Female |
| No Vehicle | 3 (0.7%) | 11 (2.6%) |
| 1 Vehicle | 47 (11.8%) | 65 (15.3%) |
| 2 Vehicles | 165 (41.5%) | 180 (42.3%) |
| 3 Vehicles | 120 (30.1%) | 94 (22.1%) |
| 4 Vehicles | 37 (9.3%) | 41 (9.7%) |
| 5 or more Vehicles | 26 (6.5%) | 34 (8.0%) |
| Total | 398 (100.0%) | 425 (100.0%) |
Commute Time in Dalton
The most frequently occuring commute durations in Dalton are 20 to 24 minutes (146 commuters, 18.2%), less than 5 minutes (112 commuters, 14.0%), and 15 to 19 minutes (112 commuters, 14.0%).
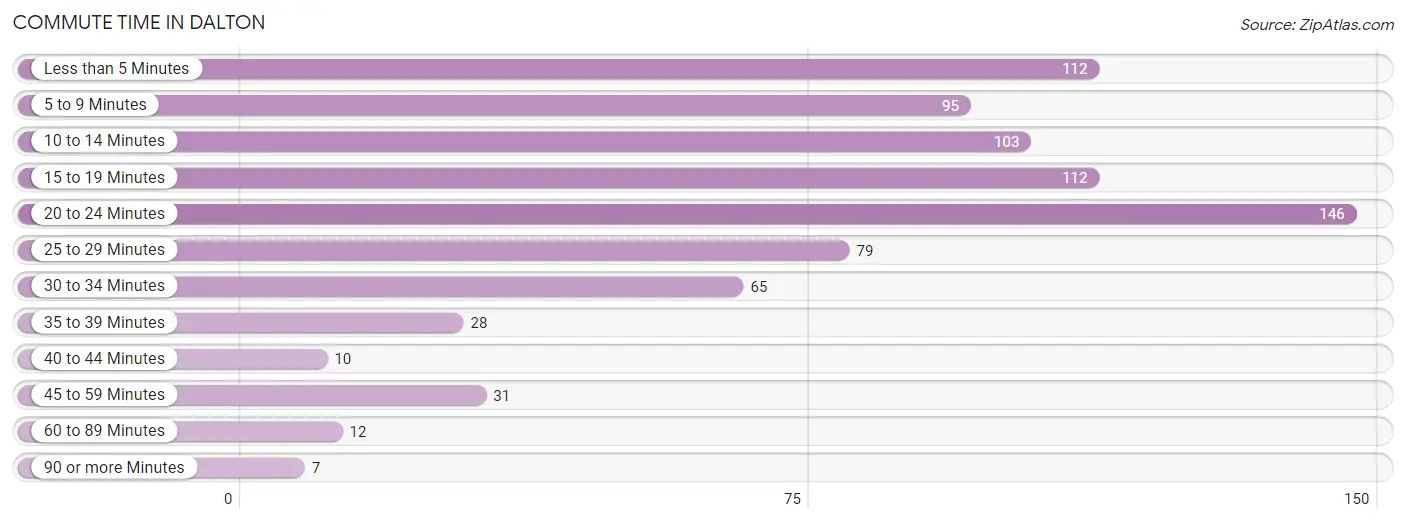
| Commute Time | # Commuters | % Commuters |
| Less than 5 Minutes | 112 | 14.0% |
| 5 to 9 Minutes | 95 | 11.9% |
| 10 to 14 Minutes | 103 | 12.9% |
| 15 to 19 Minutes | 112 | 14.0% |
| 20 to 24 Minutes | 146 | 18.2% |
| 25 to 29 Minutes | 79 | 9.9% |
| 30 to 34 Minutes | 65 | 8.1% |
| 35 to 39 Minutes | 28 | 3.5% |
| 40 to 44 Minutes | 10 | 1.3% |
| 45 to 59 Minutes | 31 | 3.9% |
| 60 to 89 Minutes | 12 | 1.5% |
| 90 or more Minutes | 7 | 0.9% |
Commute Time by Sex in Dalton
The most common commute times in Dalton are 15 to 19 minutes (62 commuters, 15.9%) for males and 20 to 24 minutes (87 commuters, 21.2%) for females.
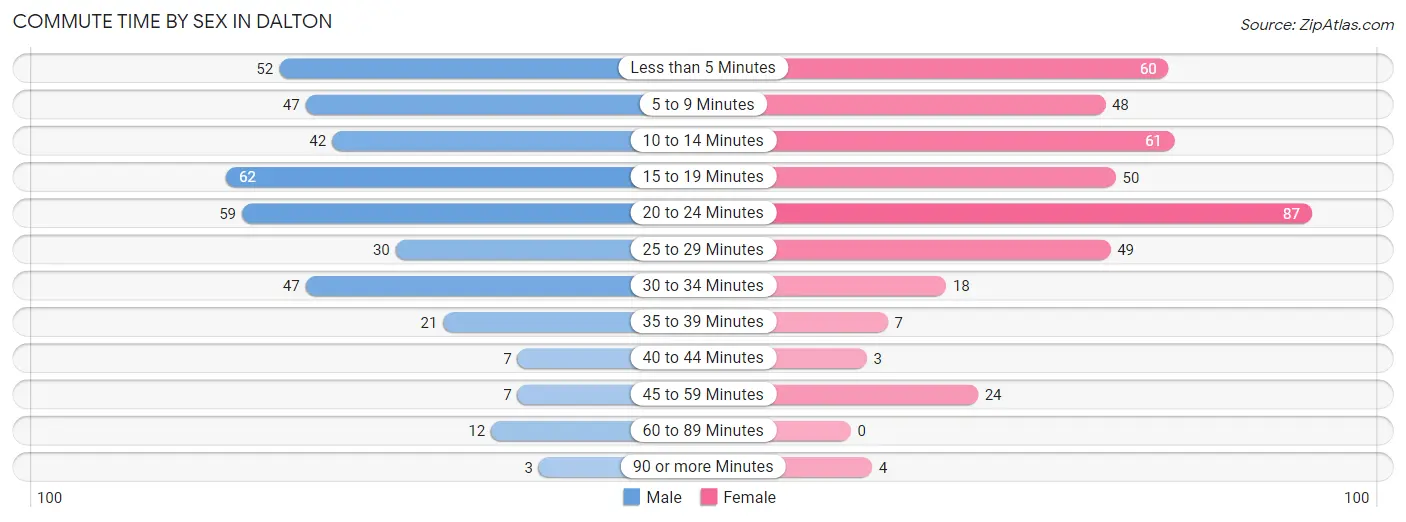
| Commute Time | Male | Female |
| Less than 5 Minutes | 52 (13.4%) | 60 (14.6%) |
| 5 to 9 Minutes | 47 (12.1%) | 48 (11.7%) |
| 10 to 14 Minutes | 42 (10.8%) | 61 (14.8%) |
| 15 to 19 Minutes | 62 (15.9%) | 50 (12.2%) |
| 20 to 24 Minutes | 59 (15.2%) | 87 (21.2%) |
| 25 to 29 Minutes | 30 (7.7%) | 49 (11.9%) |
| 30 to 34 Minutes | 47 (12.1%) | 18 (4.4%) |
| 35 to 39 Minutes | 21 (5.4%) | 7 (1.7%) |
| 40 to 44 Minutes | 7 (1.8%) | 3 (0.7%) |
| 45 to 59 Minutes | 7 (1.8%) | 24 (5.8%) |
| 60 to 89 Minutes | 12 (3.1%) | 0 (0.0%) |
| 90 or more Minutes | 3 (0.8%) | 4 (1.0%) |
Time of Departure to Work by Sex in Dalton
The most frequent times of departure to work in Dalton are 12:00 AM to 4:59 AM (64, 16.5%) for males and 7:30 AM to 7:59 AM (110, 26.8%) for females.
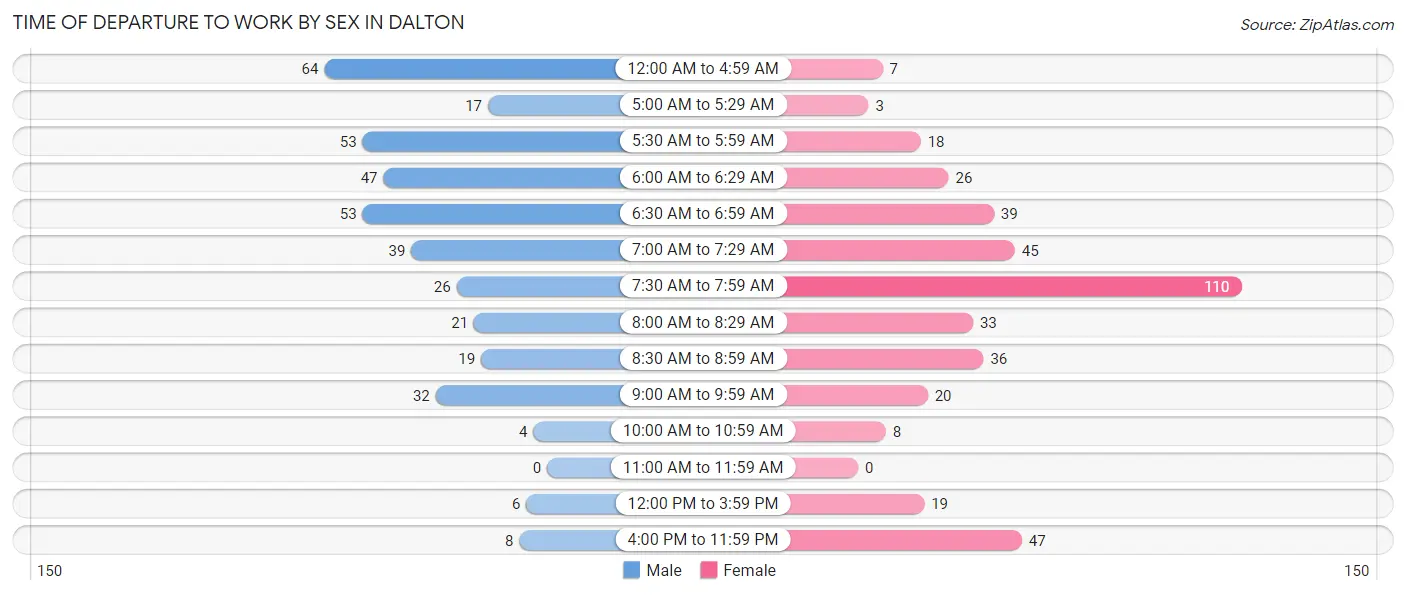
| Time of Departure | Male | Female |
| 12:00 AM to 4:59 AM | 64 (16.5%) | 7 (1.7%) |
| 5:00 AM to 5:29 AM | 17 (4.4%) | 3 (0.7%) |
| 5:30 AM to 5:59 AM | 53 (13.6%) | 18 (4.4%) |
| 6:00 AM to 6:29 AM | 47 (12.1%) | 26 (6.3%) |
| 6:30 AM to 6:59 AM | 53 (13.6%) | 39 (9.5%) |
| 7:00 AM to 7:29 AM | 39 (10.0%) | 45 (11.0%) |
| 7:30 AM to 7:59 AM | 26 (6.7%) | 110 (26.8%) |
| 8:00 AM to 8:29 AM | 21 (5.4%) | 33 (8.0%) |
| 8:30 AM to 8:59 AM | 19 (4.9%) | 36 (8.8%) |
| 9:00 AM to 9:59 AM | 32 (8.2%) | 20 (4.9%) |
| 10:00 AM to 10:59 AM | 4 (1.0%) | 8 (1.9%) |
| 11:00 AM to 11:59 AM | 0 (0.0%) | 0 (0.0%) |
| 12:00 PM to 3:59 PM | 6 (1.5%) | 19 (4.6%) |
| 4:00 PM to 11:59 PM | 8 (2.1%) | 47 (11.4%) |
| Total | 389 (100.0%) | 411 (100.0%) |
Housing Occupancy in Dalton
Occupancy by Ownership in Dalton
Of the total 708 dwellings in Dalton, owner-occupied units account for 524 (74.0%), while renter-occupied units make up 184 (26.0%).
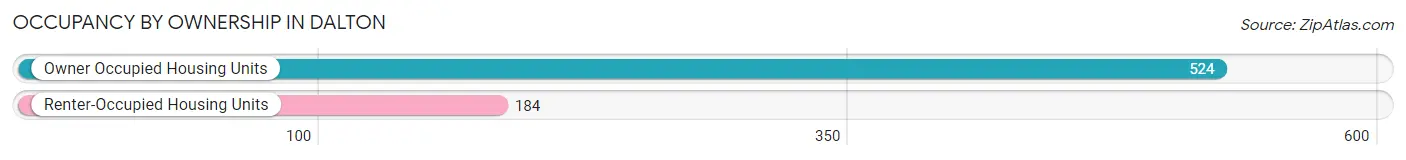
| Occupancy | # Housing Units | % Housing Units |
| Owner Occupied Housing Units | 524 | 74.0% |
| Renter-Occupied Housing Units | 184 | 26.0% |
| Total Occupied Housing Units | 708 | 100.0% |
Occupancy by Household Size in Dalton
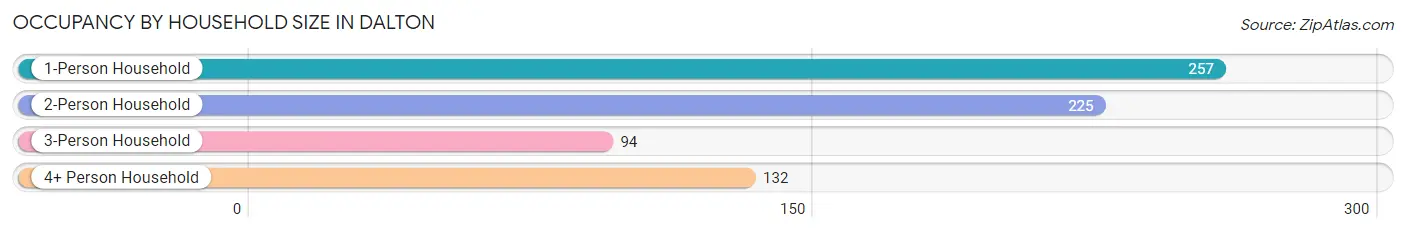
| Household Size | # Housing Units | % Housing Units |
| 1-Person Household | 257 | 36.3% |
| 2-Person Household | 225 | 31.8% |
| 3-Person Household | 94 | 13.3% |
| 4+ Person Household | 132 | 18.6% |
| Total Housing Units | 708 | 100.0% |
Occupancy by Ownership by Household Size in Dalton
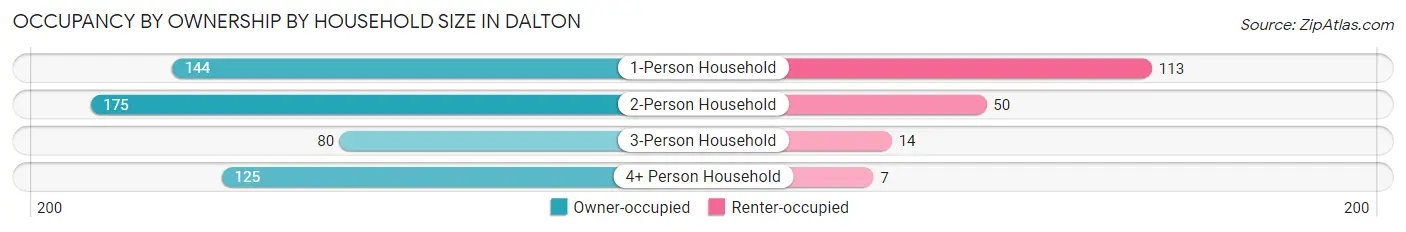
| Household Size | Owner-occupied | Renter-occupied |
| 1-Person Household | 144 (56.0%) | 113 (44.0%) |
| 2-Person Household | 175 (77.8%) | 50 (22.2%) |
| 3-Person Household | 80 (85.1%) | 14 (14.9%) |
| 4+ Person Household | 125 (94.7%) | 7 (5.3%) |
| Total Housing Units | 524 (74.0%) | 184 (26.0%) |
Occupancy by Educational Attainment in Dalton
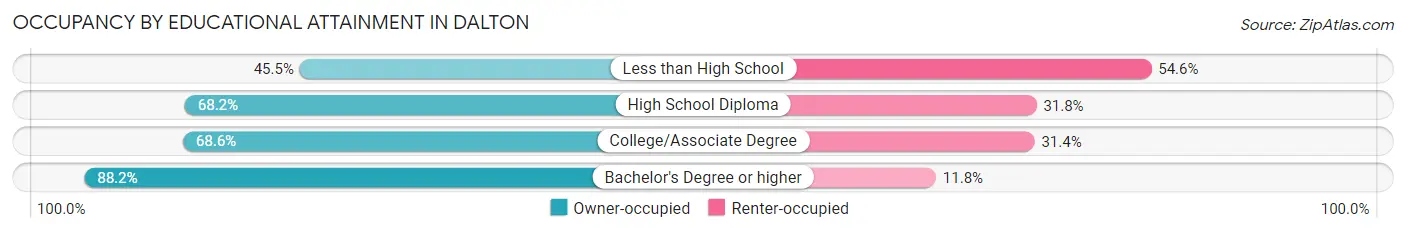
| Household Size | Owner-occupied | Renter-occupied |
| Less than High School | 10 (45.5%) | 12 (54.5%) |
| High School Diploma | 219 (68.2%) | 102 (31.8%) |
| College/Associate Degree | 94 (68.6%) | 43 (31.4%) |
| Bachelor's Degree or higher | 201 (88.2%) | 27 (11.8%) |
Occupancy by Age of Householder in Dalton
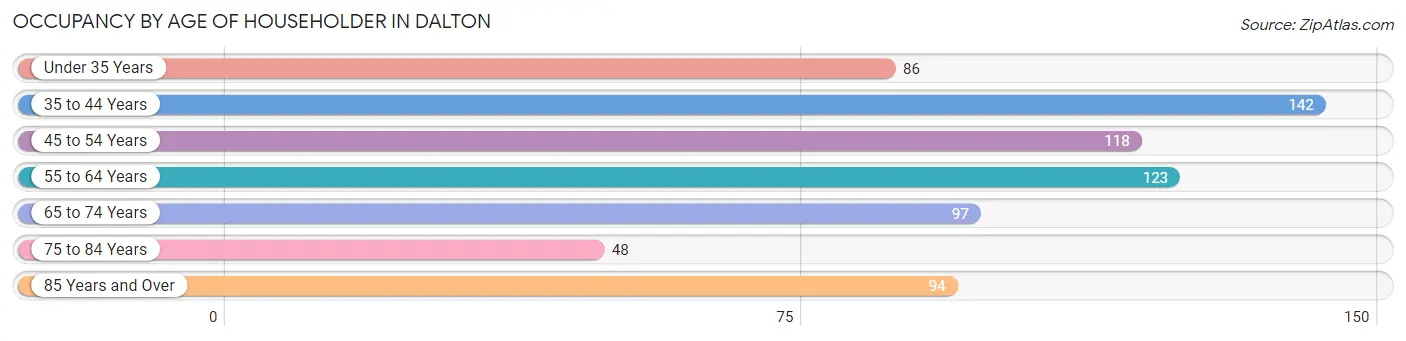
| Age Bracket | # Households | % Households |
| Under 35 Years | 86 | 12.1% |
| 35 to 44 Years | 142 | 20.1% |
| 45 to 54 Years | 118 | 16.7% |
| 55 to 64 Years | 123 | 17.4% |
| 65 to 74 Years | 97 | 13.7% |
| 75 to 84 Years | 48 | 6.8% |
| 85 Years and Over | 94 | 13.3% |
| Total | 708 | 100.0% |
Housing Finances in Dalton
Median Income by Occupancy in Dalton
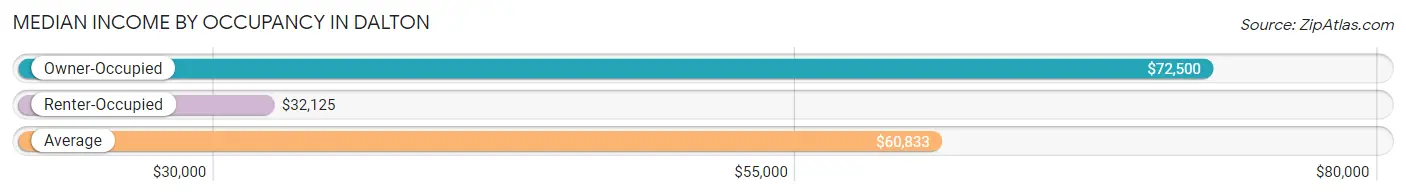
| Occupancy Type | # Households | Median Income |
| Owner-Occupied | 524 (74.0%) | $72,500 |
| Renter-Occupied | 184 (26.0%) | $32,125 |
| Average | 708 (100.0%) | $60,833 |
Occupancy by Householder Income Bracket in Dalton
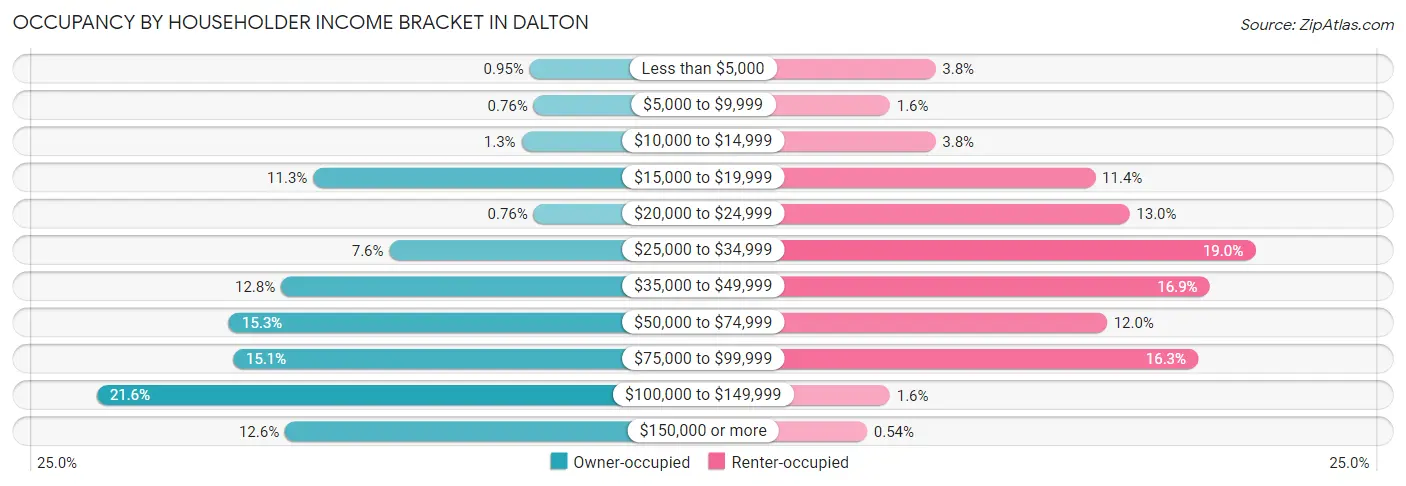
| Income Bracket | Owner-occupied | Renter-occupied |
| Less than $5,000 | 5 (0.9%) | 7 (3.8%) |
| $5,000 to $9,999 | 4 (0.8%) | 3 (1.6%) |
| $10,000 to $14,999 | 7 (1.3%) | 7 (3.8%) |
| $15,000 to $19,999 | 59 (11.3%) | 21 (11.4%) |
| $20,000 to $24,999 | 4 (0.8%) | 24 (13.0%) |
| $25,000 to $34,999 | 40 (7.6%) | 35 (19.0%) |
| $35,000 to $49,999 | 67 (12.8%) | 31 (16.9%) |
| $50,000 to $74,999 | 80 (15.3%) | 22 (12.0%) |
| $75,000 to $99,999 | 79 (15.1%) | 30 (16.3%) |
| $100,000 to $149,999 | 113 (21.6%) | 3 (1.6%) |
| $150,000 or more | 66 (12.6%) | 1 (0.5%) |
| Total | 524 (100.0%) | 184 (100.0%) |
Monthly Housing Cost Tiers in Dalton
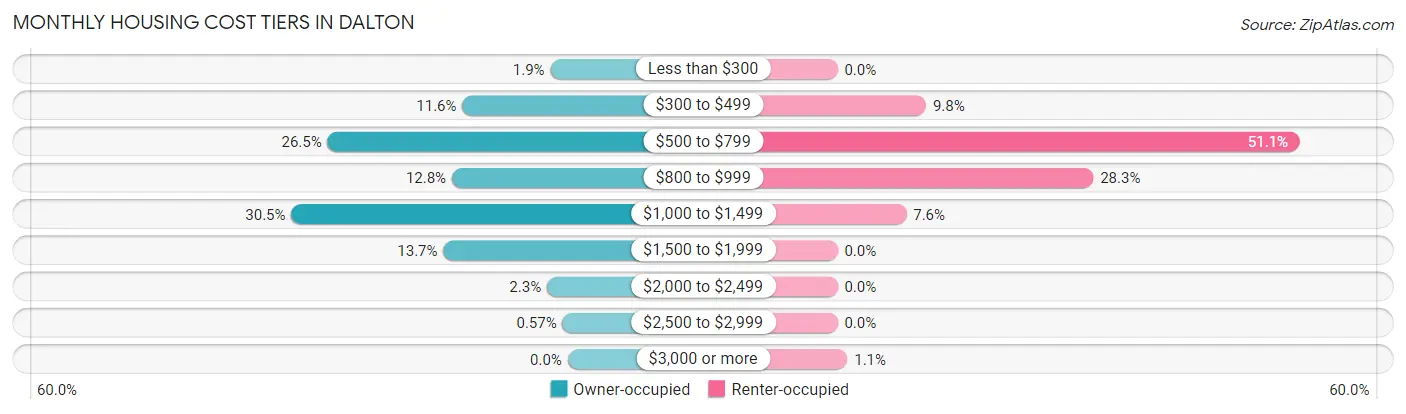
| Monthly Cost | Owner-occupied | Renter-occupied |
| Less than $300 | 10 (1.9%) | 0 (0.0%) |
| $300 to $499 | 61 (11.6%) | 18 (9.8%) |
| $500 to $799 | 139 (26.5%) | 94 (51.1%) |
| $800 to $999 | 67 (12.8%) | 52 (28.3%) |
| $1,000 to $1,499 | 160 (30.5%) | 14 (7.6%) |
| $1,500 to $1,999 | 72 (13.7%) | 0 (0.0%) |
| $2,000 to $2,499 | 12 (2.3%) | 0 (0.0%) |
| $2,500 to $2,999 | 3 (0.6%) | 0 (0.0%) |
| $3,000 or more | 0 (0.0%) | 2 (1.1%) |
| Total | 524 (100.0%) | 184 (100.0%) |
Physical Housing Characteristics in Dalton
Housing Structures in Dalton
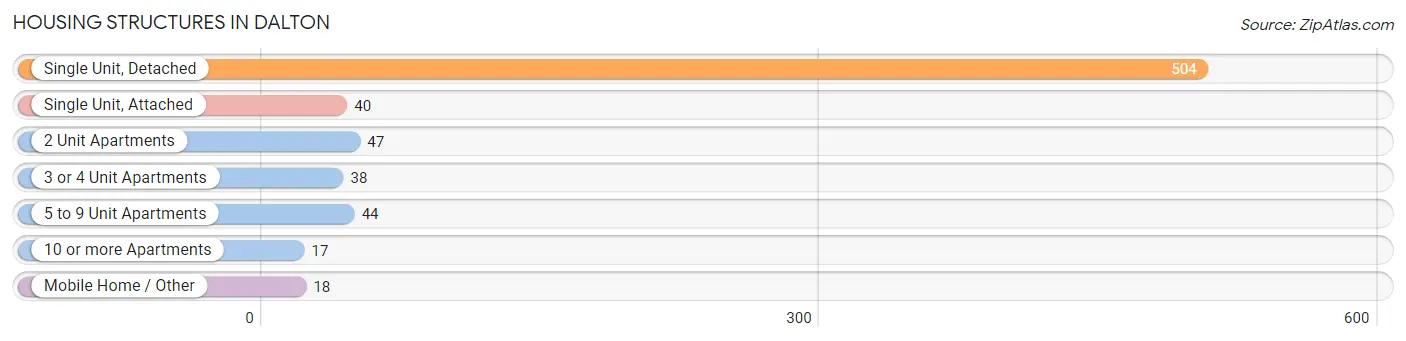
| Structure Type | # Housing Units | % Housing Units |
| Single Unit, Detached | 504 | 71.2% |
| Single Unit, Attached | 40 | 5.7% |
| 2 Unit Apartments | 47 | 6.6% |
| 3 or 4 Unit Apartments | 38 | 5.4% |
| 5 to 9 Unit Apartments | 44 | 6.2% |
| 10 or more Apartments | 17 | 2.4% |
| Mobile Home / Other | 18 | 2.5% |
| Total | 708 | 100.0% |
Housing Structures by Occupancy in Dalton
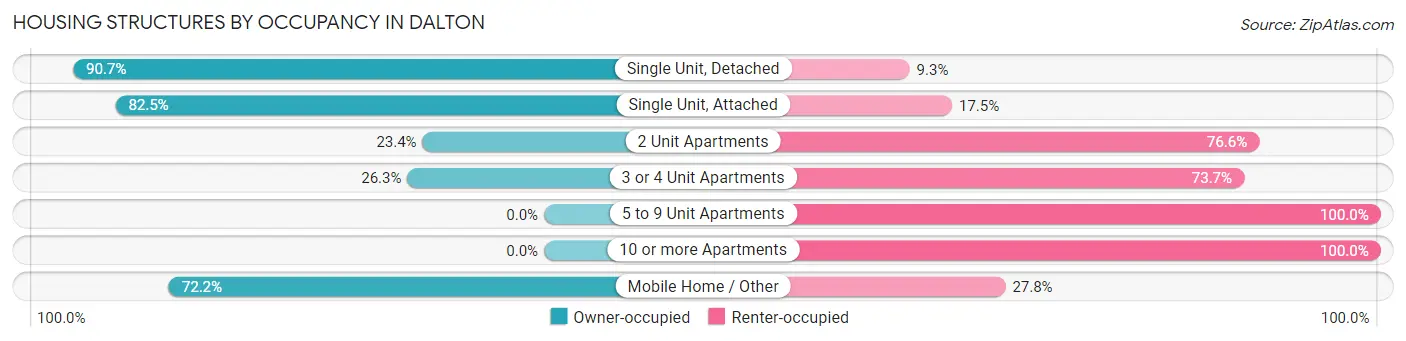
| Structure Type | Owner-occupied | Renter-occupied |
| Single Unit, Detached | 457 (90.7%) | 47 (9.3%) |
| Single Unit, Attached | 33 (82.5%) | 7 (17.5%) |
| 2 Unit Apartments | 11 (23.4%) | 36 (76.6%) |
| 3 or 4 Unit Apartments | 10 (26.3%) | 28 (73.7%) |
| 5 to 9 Unit Apartments | 0 (0.0%) | 44 (100.0%) |
| 10 or more Apartments | 0 (0.0%) | 17 (100.0%) |
| Mobile Home / Other | 13 (72.2%) | 5 (27.8%) |
| Total | 524 (74.0%) | 184 (26.0%) |
Housing Structures by Number of Rooms in Dalton
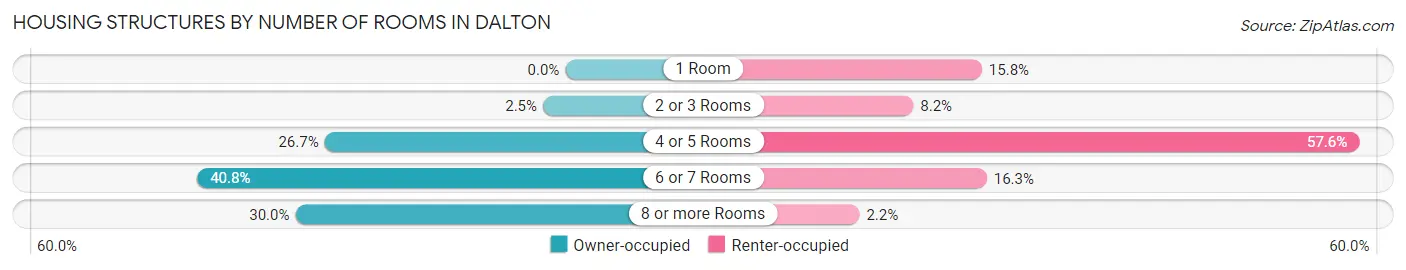
| Number of Rooms | Owner-occupied | Renter-occupied |
| 1 Room | 0 (0.0%) | 29 (15.8%) |
| 2 or 3 Rooms | 13 (2.5%) | 15 (8.2%) |
| 4 or 5 Rooms | 140 (26.7%) | 106 (57.6%) |
| 6 or 7 Rooms | 214 (40.8%) | 30 (16.3%) |
| 8 or more Rooms | 157 (30.0%) | 4 (2.2%) |
| Total | 524 (100.0%) | 184 (100.0%) |
Housing Structure by Heating Type in Dalton
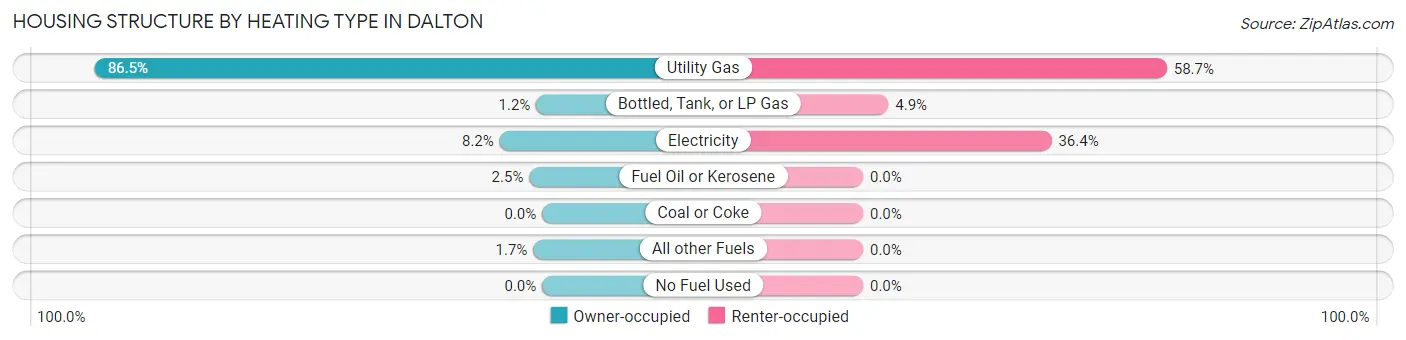
| Heating Type | Owner-occupied | Renter-occupied |
| Utility Gas | 453 (86.5%) | 108 (58.7%) |
| Bottled, Tank, or LP Gas | 6 (1.1%) | 9 (4.9%) |
| Electricity | 43 (8.2%) | 67 (36.4%) |
| Fuel Oil or Kerosene | 13 (2.5%) | 0 (0.0%) |
| Coal or Coke | 0 (0.0%) | 0 (0.0%) |
| All other Fuels | 9 (1.7%) | 0 (0.0%) |
| No Fuel Used | 0 (0.0%) | 0 (0.0%) |
| Total | 524 (100.0%) | 184 (100.0%) |
Household Vehicle Usage in Dalton
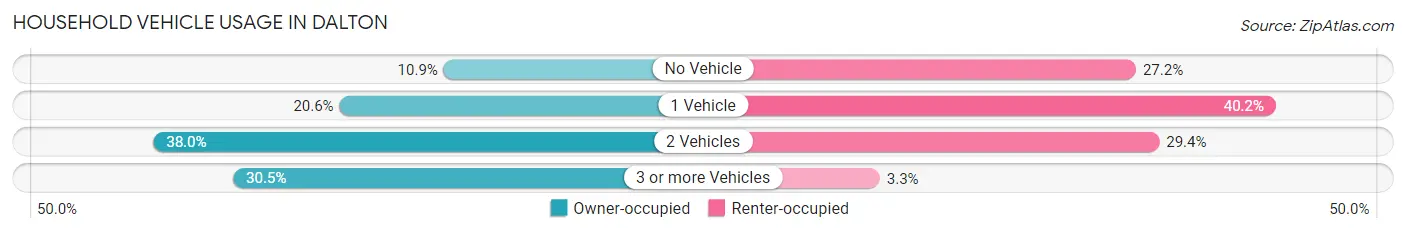
| Vehicles per Household | Owner-occupied | Renter-occupied |
| No Vehicle | 57 (10.9%) | 50 (27.2%) |
| 1 Vehicle | 108 (20.6%) | 74 (40.2%) |
| 2 Vehicles | 199 (38.0%) | 54 (29.3%) |
| 3 or more Vehicles | 160 (30.5%) | 6 (3.3%) |
| Total | 524 (100.0%) | 184 (100.0%) |
Real Estate & Mortgages in Dalton
Real Estate and Mortgage Overview in Dalton
| Characteristic | Without Mortgage | With Mortgage |
| Housing Units | 192 | 332 |
| Median Property Value | $176,000 | $171,200 |
| Median Household Income | $62,500 | $41 |
| Monthly Housing Costs | $537 | $0 |
| Real Estate Taxes | $1,988 | $2 |
Property Value by Mortgage Status in Dalton
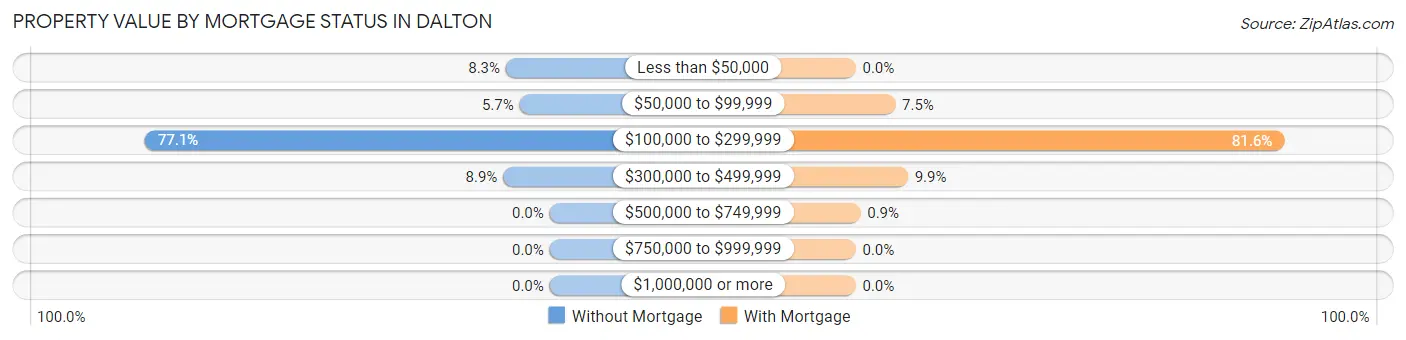
| Property Value | Without Mortgage | With Mortgage |
| Less than $50,000 | 16 (8.3%) | 0 (0.0%) |
| $50,000 to $99,999 | 11 (5.7%) | 25 (7.5%) |
| $100,000 to $299,999 | 148 (77.1%) | 271 (81.6%) |
| $300,000 to $499,999 | 17 (8.8%) | 33 (9.9%) |
| $500,000 to $749,999 | 0 (0.0%) | 3 (0.9%) |
| $750,000 to $999,999 | 0 (0.0%) | 0 (0.0%) |
| $1,000,000 or more | 0 (0.0%) | 0 (0.0%) |
| Total | 192 (100.0%) | 332 (100.0%) |
Household Income by Mortgage Status in Dalton
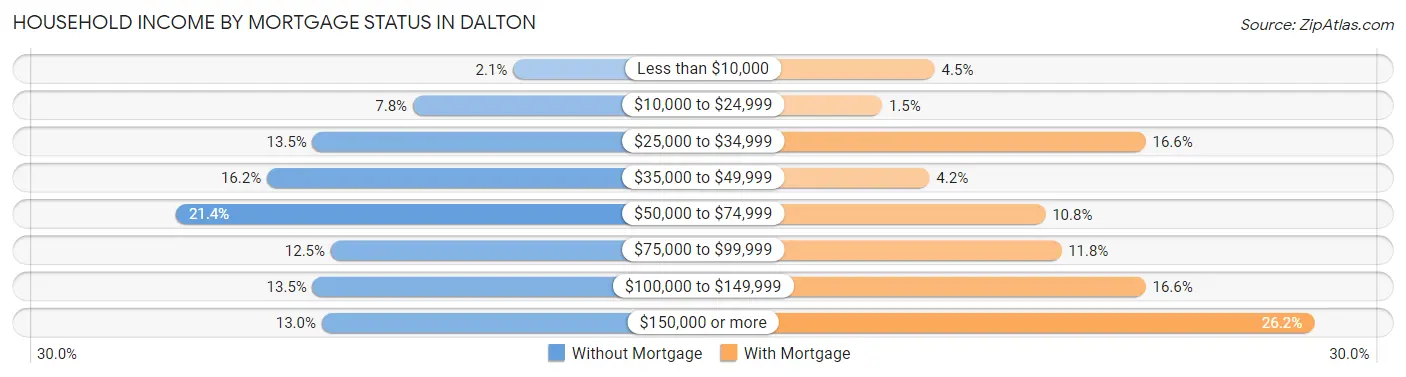
| Household Income | Without Mortgage | With Mortgage |
| Less than $10,000 | 4 (2.1%) | 15 (4.5%) |
| $10,000 to $24,999 | 15 (7.8%) | 5 (1.5%) |
| $25,000 to $34,999 | 26 (13.5%) | 55 (16.6%) |
| $35,000 to $49,999 | 31 (16.2%) | 14 (4.2%) |
| $50,000 to $74,999 | 41 (21.3%) | 36 (10.8%) |
| $75,000 to $99,999 | 24 (12.5%) | 39 (11.7%) |
| $100,000 to $149,999 | 26 (13.5%) | 55 (16.6%) |
| $150,000 or more | 25 (13.0%) | 87 (26.2%) |
| Total | 192 (100.0%) | 332 (100.0%) |
Property Value to Household Income Ratio in Dalton
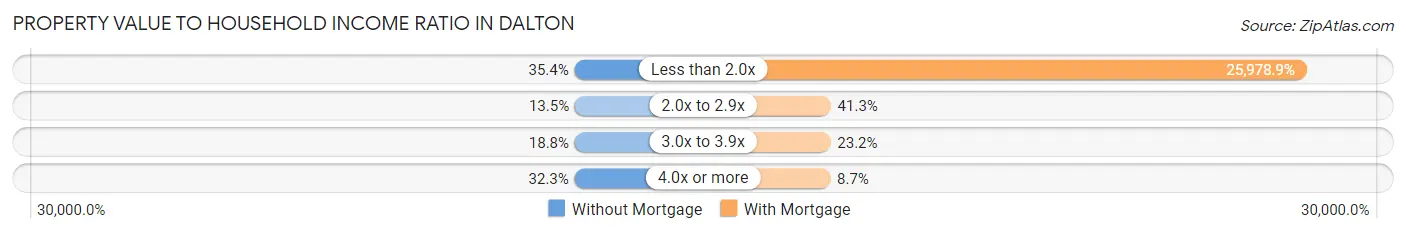
| Value-to-Income Ratio | Without Mortgage | With Mortgage |
| Less than 2.0x | 68 (35.4%) | 86,250 (25,978.9%) |
| 2.0x to 2.9x | 26 (13.5%) | 137 (41.3%) |
| 3.0x to 3.9x | 36 (18.8%) | 77 (23.2%) |
| 4.0x or more | 62 (32.3%) | 29 (8.7%) |
| Total | 192 (100.0%) | 332 (100.0%) |
Real Estate Taxes by Mortgage Status in Dalton
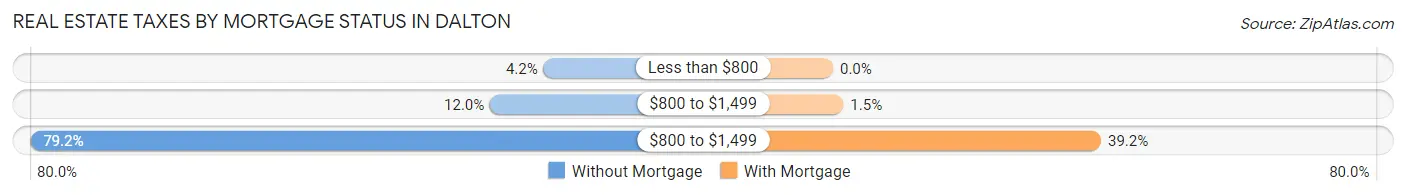
| Property Taxes | Without Mortgage | With Mortgage |
| Less than $800 | 8 (4.2%) | 0 (0.0%) |
| $800 to $1,499 | 23 (12.0%) | 5 (1.5%) |
| $800 to $1,499 | 152 (79.2%) | 130 (39.2%) |
| Total | 192 (100.0%) | 332 (100.0%) |
Health & Disability in Dalton
Health Insurance Coverage by Age in Dalton
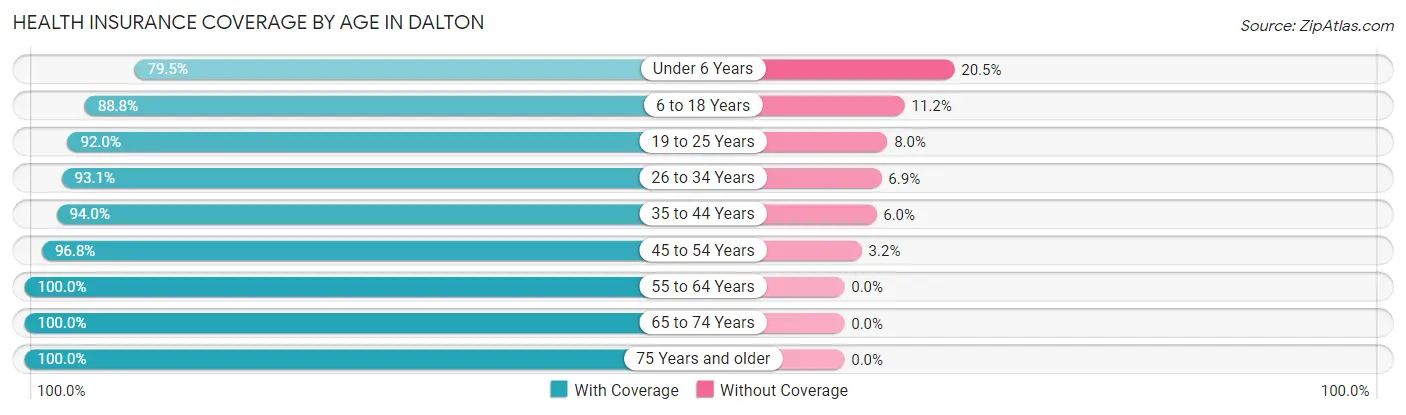
| Age Bracket | With Coverage | Without Coverage |
| Under 6 Years | 62 (79.5%) | 16 (20.5%) |
| 6 to 18 Years | 253 (88.8%) | 32 (11.2%) |
| 19 to 25 Years | 115 (92.0%) | 10 (8.0%) |
| 26 to 34 Years | 121 (93.1%) | 9 (6.9%) |
| 35 to 44 Years | 205 (94.0%) | 13 (6.0%) |
| 45 to 54 Years | 209 (96.8%) | 7 (3.2%) |
| 55 to 64 Years | 209 (100.0%) | 0 (0.0%) |
| 65 to 74 Years | 159 (100.0%) | 0 (0.0%) |
| 75 Years and older | 183 (100.0%) | 0 (0.0%) |
| Total | 1,516 (94.6%) | 87 (5.4%) |
Health Insurance Coverage by Citizenship Status in Dalton
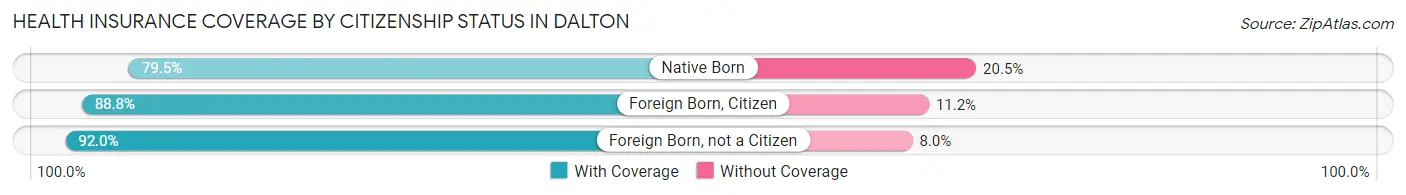
| Citizenship Status | With Coverage | Without Coverage |
| Native Born | 62 (79.5%) | 16 (20.5%) |
| Foreign Born, Citizen | 253 (88.8%) | 32 (11.2%) |
| Foreign Born, not a Citizen | 115 (92.0%) | 10 (8.0%) |
Health Insurance Coverage by Household Income in Dalton
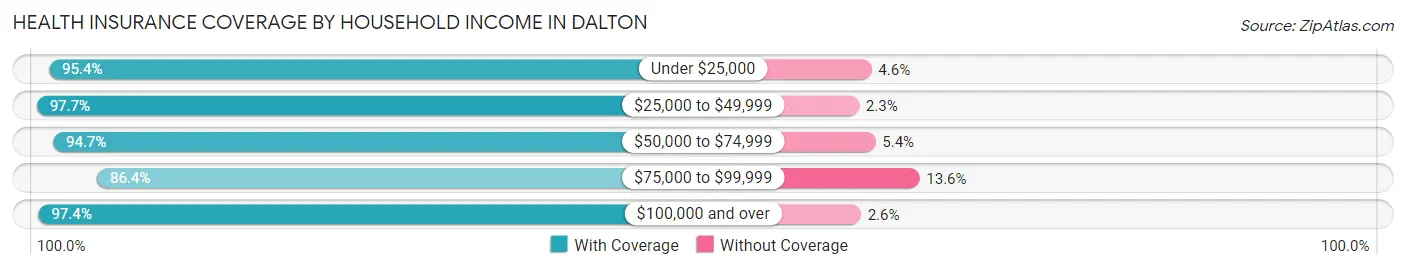
| Household Income | With Coverage | Without Coverage |
| Under $25,000 | 145 (95.4%) | 7 (4.6%) |
| $25,000 to $49,999 | 258 (97.7%) | 6 (2.3%) |
| $50,000 to $74,999 | 230 (94.7%) | 13 (5.3%) |
| $75,000 to $99,999 | 286 (86.4%) | 45 (13.6%) |
| $100,000 and over | 597 (97.4%) | 16 (2.6%) |
Public vs Private Health Insurance Coverage by Age in Dalton
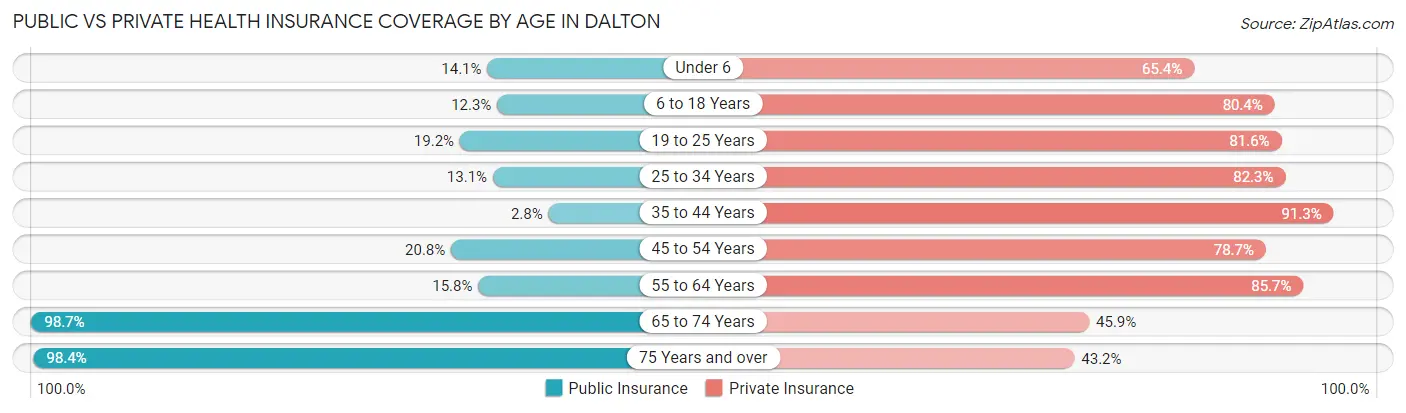
| Age Bracket | Public Insurance | Private Insurance |
| Under 6 | 11 (14.1%) | 51 (65.4%) |
| 6 to 18 Years | 35 (12.3%) | 229 (80.3%) |
| 19 to 25 Years | 24 (19.2%) | 102 (81.6%) |
| 25 to 34 Years | 17 (13.1%) | 107 (82.3%) |
| 35 to 44 Years | 6 (2.8%) | 199 (91.3%) |
| 45 to 54 Years | 45 (20.8%) | 170 (78.7%) |
| 55 to 64 Years | 33 (15.8%) | 179 (85.7%) |
| 65 to 74 Years | 157 (98.7%) | 73 (45.9%) |
| 75 Years and over | 180 (98.4%) | 79 (43.2%) |
| Total | 508 (31.7%) | 1,189 (74.2%) |
Disability Status by Sex by Age in Dalton
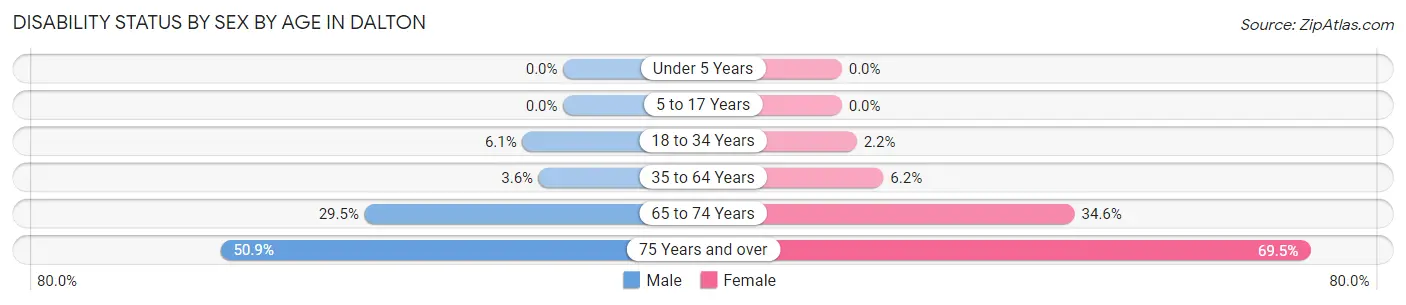
| Age Bracket | Male | Female |
| Under 5 Years | 0 (0.0%) | 0 (0.0%) |
| 5 to 17 Years | 0 (0.0%) | 0 (0.0%) |
| 18 to 34 Years | 8 (6.1%) | 3 (2.2%) |
| 35 to 64 Years | 11 (3.6%) | 21 (6.2%) |
| 65 to 74 Years | 23 (29.5%) | 28 (34.6%) |
| 75 Years and over | 28 (50.9%) | 89 (69.5%) |
Disability Class by Sex by Age in Dalton
Disability Class: Hearing Difficulty
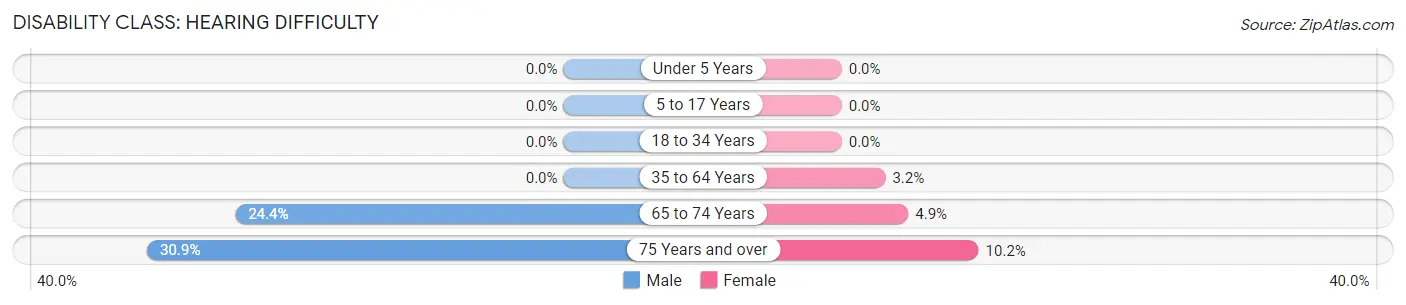
| Age Bracket | Male | Female |
| Under 5 Years | 0 (0.0%) | 0 (0.0%) |
| 5 to 17 Years | 0 (0.0%) | 0 (0.0%) |
| 18 to 34 Years | 0 (0.0%) | 0 (0.0%) |
| 35 to 64 Years | 0 (0.0%) | 11 (3.2%) |
| 65 to 74 Years | 19 (24.4%) | 4 (4.9%) |
| 75 Years and over | 17 (30.9%) | 13 (10.2%) |
Disability Class: Vision Difficulty
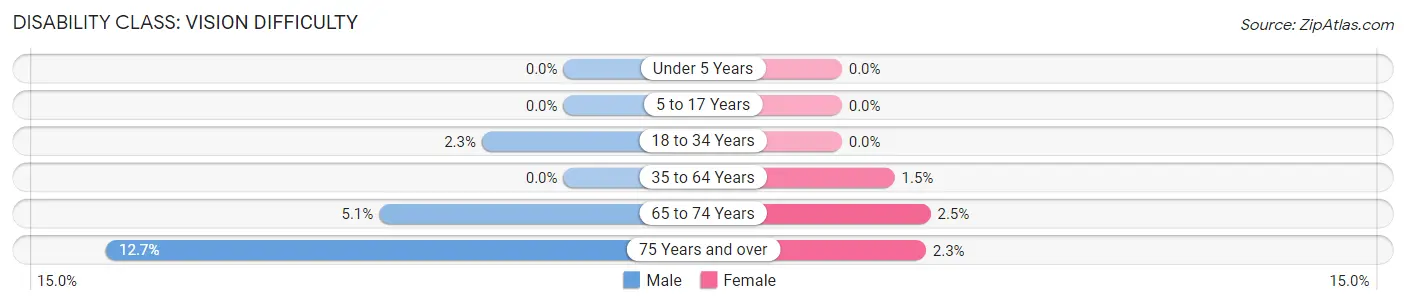
| Age Bracket | Male | Female |
| Under 5 Years | 0 (0.0%) | 0 (0.0%) |
| 5 to 17 Years | 0 (0.0%) | 0 (0.0%) |
| 18 to 34 Years | 3 (2.3%) | 0 (0.0%) |
| 35 to 64 Years | 0 (0.0%) | 5 (1.5%) |
| 65 to 74 Years | 4 (5.1%) | 2 (2.5%) |
| 75 Years and over | 7 (12.7%) | 3 (2.3%) |
Disability Class: Cognitive Difficulty
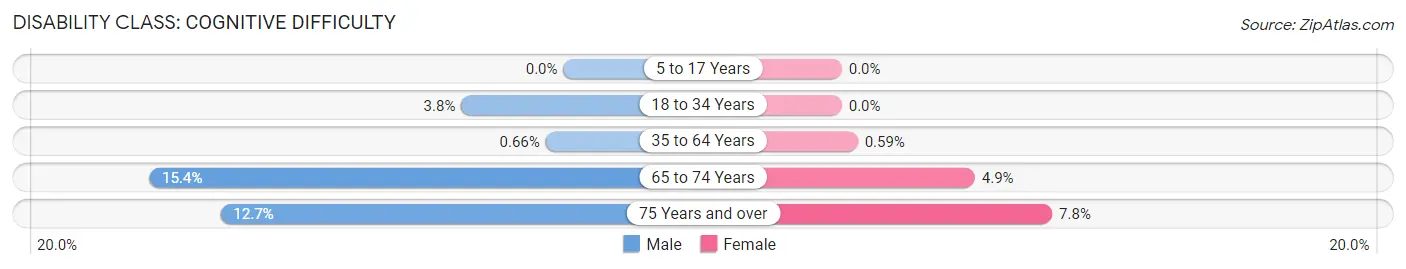
| Age Bracket | Male | Female |
| 5 to 17 Years | 0 (0.0%) | 0 (0.0%) |
| 18 to 34 Years | 5 (3.8%) | 0 (0.0%) |
| 35 to 64 Years | 2 (0.7%) | 2 (0.6%) |
| 65 to 74 Years | 12 (15.4%) | 4 (4.9%) |
| 75 Years and over | 7 (12.7%) | 10 (7.8%) |
Disability Class: Ambulatory Difficulty
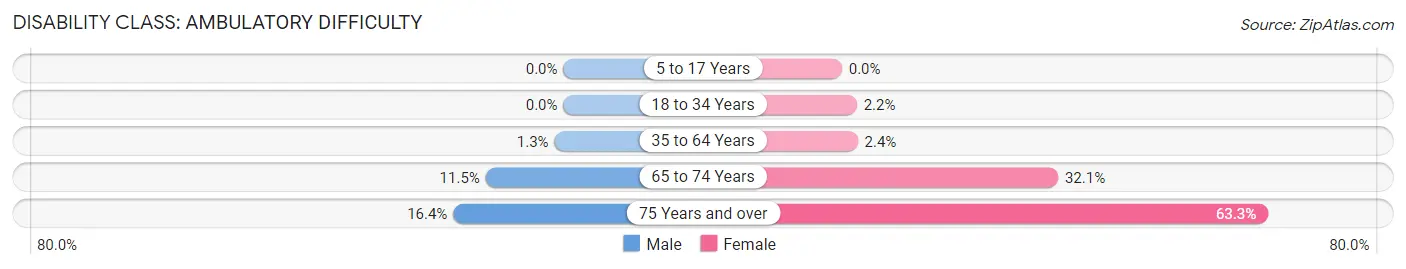
| Age Bracket | Male | Female |
| 5 to 17 Years | 0 (0.0%) | 0 (0.0%) |
| 18 to 34 Years | 0 (0.0%) | 3 (2.2%) |
| 35 to 64 Years | 4 (1.3%) | 8 (2.4%) |
| 65 to 74 Years | 9 (11.5%) | 26 (32.1%) |
| 75 Years and over | 9 (16.4%) | 81 (63.3%) |
Disability Class: Self-Care Difficulty
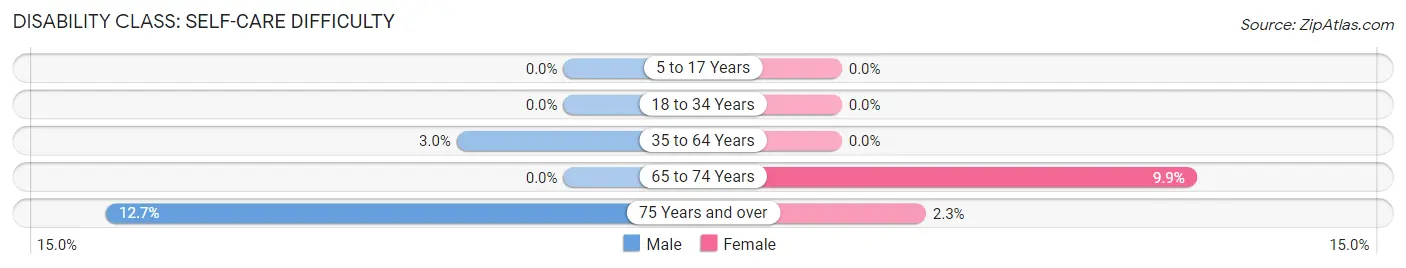
| Age Bracket | Male | Female |
| 5 to 17 Years | 0 (0.0%) | 0 (0.0%) |
| 18 to 34 Years | 0 (0.0%) | 0 (0.0%) |
| 35 to 64 Years | 9 (3.0%) | 0 (0.0%) |
| 65 to 74 Years | 0 (0.0%) | 8 (9.9%) |
| 75 Years and over | 7 (12.7%) | 3 (2.3%) |
Technology Access in Dalton
Computing Device Access in Dalton
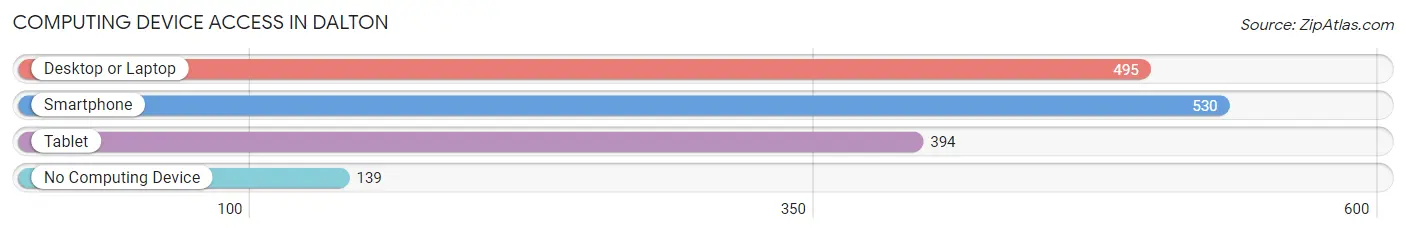
| Device Type | # Households | % Households |
| Desktop or Laptop | 495 | 69.9% |
| Smartphone | 530 | 74.9% |
| Tablet | 394 | 55.6% |
| No Computing Device | 139 | 19.6% |
| Total | 708 | 100.0% |
Internet Access in Dalton
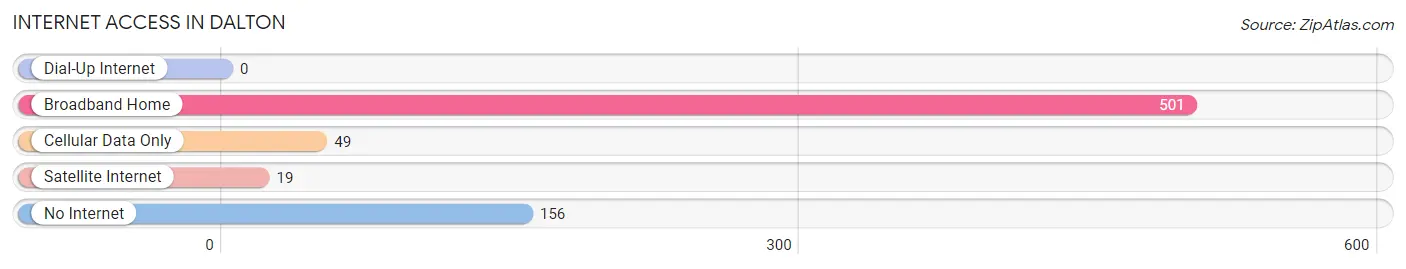
| Internet Type | # Households | % Households |
| Dial-Up Internet | 0 | 0.0% |
| Broadband Home | 501 | 70.8% |
| Cellular Data Only | 49 | 6.9% |
| Satellite Internet | 19 | 2.7% |
| No Internet | 156 | 22.0% |
| Total | 708 | 100.0% |
Dalton Summary
Dalton, Ohio is a small village located in Wayne County, Ohio. It is situated in the northeastern part of the state, approximately 30 miles south of Akron and 40 miles north of Canton. The village has a population of approximately 1,400 people and covers an area of 1.2 square miles.
History
Dalton was founded in 1817 by a group of settlers from Connecticut. The village was named after the town of Dalton, Massachusetts, which was the hometown of the settlers. The first settlers were primarily farmers and the village grew slowly over the years. In 1845, the village was incorporated and the first post office was established.
In the late 19th century, Dalton began to experience a period of growth. The village was connected to the railroad in 1881 and the first bank was established in 1883. The village also had a number of businesses, including a sawmill, a grist mill, a blacksmith shop, and a general store.
In the early 20th century, Dalton experienced a period of decline. The railroad was abandoned in the 1920s and the village’s population began to decline. However, the village experienced a resurgence in the 1950s and 1960s when the village was connected to the Ohio Turnpike.
Geography
Dalton is located in northeastern Ohio, approximately 30 miles south of Akron and 40 miles north of Canton. The village is situated in Wayne County and is bordered by the towns of Marshallville, Sterling, and Kidron. The village is situated on the western edge of the Wooster Plain, a flat area of land that is part of the Great Black Swamp. The village is located at an elevation of 1,000 feet above sea level.
The climate in Dalton is classified as humid continental, with hot summers and cold winters. The average temperature in the summer is around 75 degrees Fahrenheit and the average temperature in the winter is around 25 degrees Fahrenheit. The village receives an average of 40 inches of precipitation per year.
Economy
The economy of Dalton is primarily based on agriculture. The village is home to a number of farms, which produce a variety of crops, including corn, soybeans, wheat, and hay. The village also has a number of small businesses, including a hardware store, a grocery store, and a restaurant.
Demographics
As of the 2010 census, the population of Dalton was 1,400 people. The racial makeup of the village was 97.4% White, 0.6% African American, 0.3% Native American, 0.3% Asian, and 1.4% from other races. The median household income in Dalton was $45,000 and the median family income was $50,000. The per capita income in Dalton was $20,000.
Conclusion
Dalton, Ohio is a small village located in Wayne County, Ohio. It is situated in the northeastern part of the state, approximately 30 miles south of Akron and 40 miles north of Canton. The village has a population of approximately 1,400 people and covers an area of 1.2 square miles. The economy of Dalton is primarily based on agriculture and the village is home to a number of small businesses. The racial makeup of the village is predominantly White, with a small percentage of African American, Native American, and Asian residents. The median household income in Dalton is $45,000 and the per capita income is $20,000.
Common Questions
What is Per Capita Income in Dalton?
Per Capita income in Dalton is $34,858.
What is the Median Family Income in Dalton?
Median Family Income in Dalton is $91,389.
What is the Median Household income in Dalton?
Median Household Income in Dalton is $60,833.
What is Income or Wage Gap in Dalton?
Income or Wage Gap in Dalton is 34.3%.
Women in Dalton earn 65.7 cents for every dollar earned by a man.
What is Inequality or Gini Index in Dalton?
Inequality or Gini Index in Dalton is 0.45.
What is the Total Population of Dalton?
Total Population of Dalton is 1,703.
What is the Total Male Population of Dalton?
Total Male Population of Dalton is 790.
What is the Total Female Population of Dalton?
Total Female Population of Dalton is 913.
What is the Ratio of Males per 100 Females in Dalton?
There are 86.53 Males per 100 Females in Dalton.
What is the Ratio of Females per 100 Males in Dalton?
There are 115.57 Females per 100 Males in Dalton.
What is the Median Population Age in Dalton?
Median Population Age in Dalton is 45.4 Years.
What is the Average Family Size in Dalton
Average Family Size in Dalton is 3.0 People.
What is the Average Household Size in Dalton
Average Household Size in Dalton is 2.3 People.
How Large is the Labor Force in Dalton?
There are 842 People in the Labor Forcein in Dalton.
What is the Percentage of People in the Labor Force in Dalton?
59.4% of People are in the Labor Force in Dalton.
What is the Unemployment Rate in Dalton?
Unemployment Rate in Dalton is 1.3%.