Chippewa Lake, OH Map & Demographics
Chippewa Lake Map
Chippewa Lake Overview
$39,557
PER CAPITA INCOME
$88,542
AVG FAMILY INCOME
$79,333
AVG HOUSEHOLD INCOME
38.3%
WAGE / INCOME GAP [ % ]
61.7¢/ $1
WAGE / INCOME GAP [ $ ]
$13,509
FAMILY INCOME DEFICIT
0.34
INEQUALITY / GINI INDEX
704
TOTAL POPULATION
363
MALE POPULATION
341
FEMALE POPULATION
106.45
MALES / 100 FEMALES
93.94
FEMALES / 100 MALES
53.6
MEDIAN AGE
2.7
AVG FAMILY SIZE
2.2
AVG HOUSEHOLD SIZE
445
LABOR FORCE [ PEOPLE ]
68.6%
PERCENT IN LABOR FORCE
2.5%
UNEMPLOYMENT RATE
Chippewa Lake Zip Codes
Income in Chippewa Lake
Income Overview in Chippewa Lake
Per Capita Income in Chippewa Lake is $39,557, while median incomes of families and households are $88,542 and $79,333 respectively.
| Characteristic | Number | Measure |
| Per Capita Income | 704 | $39,557 |
| Median Family Income | 204 | $88,542 |
| Mean Family Income | 204 | $95,608 |
| Median Household Income | 320 | $79,333 |
| Mean Household Income | 320 | $83,043 |
| Income Deficit | 204 | $13,509 |
| Wage / Income Gap (%) | 704 | 38.30% |
| Wage / Income Gap ($) | 704 | 61.70¢ per $1 |
| Gini / Inequality Index | 704 | 0.34 |
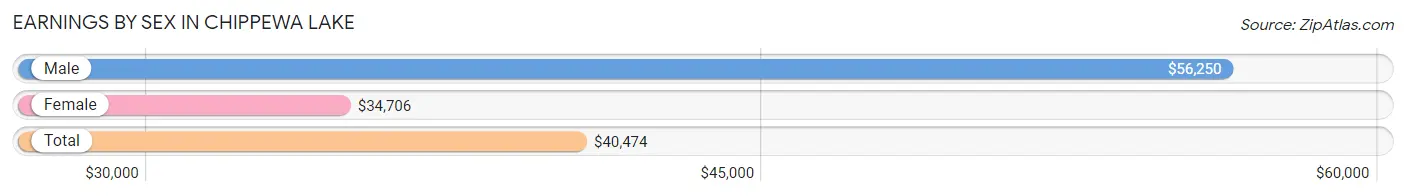
Earnings by Sex in Chippewa Lake
Average Earnings in Chippewa Lake are $40,474, $56,250 for men and $34,706 for women, a difference of 38.3%.
| Sex | Number | Average Earnings |
| Male | 237 (52.5%) | $56,250 |
| Female | 214 (47.4%) | $34,706 |
| Total | 451 (100.0%) | $40,474 |
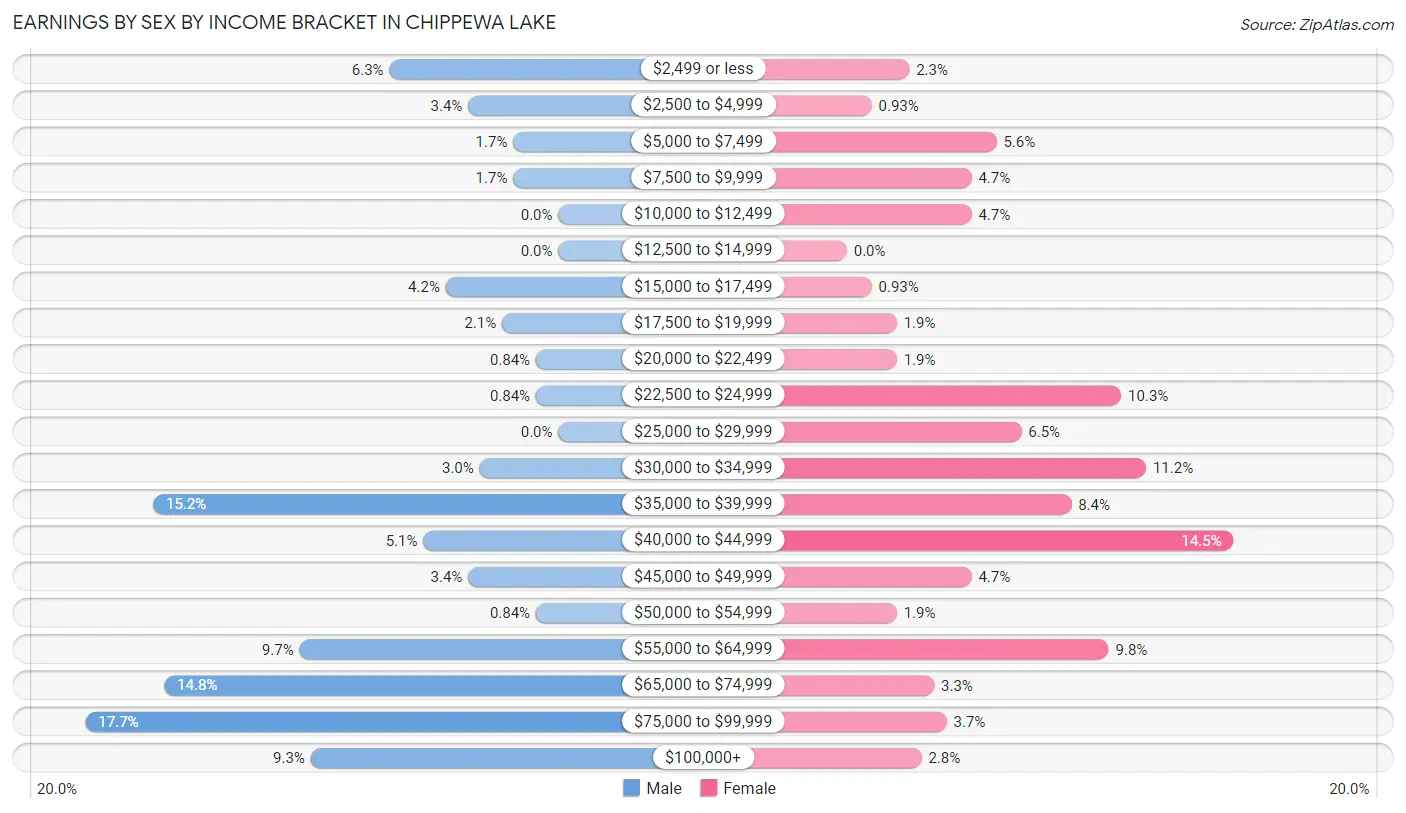
Earnings by Sex by Income Bracket in Chippewa Lake
The most common earnings brackets in Chippewa Lake are $75,000 to $99,999 for men (42 | 17.7%) and $40,000 to $44,999 for women (31 | 14.5%).
| Income | Male | Female |
| $2,499 or less | 15 (6.3%) | 5 (2.3%) |
| $2,500 to $4,999 | 8 (3.4%) | 2 (0.9%) |
| $5,000 to $7,499 | 4 (1.7%) | 12 (5.6%) |
| $7,500 to $9,999 | 4 (1.7%) | 10 (4.7%) |
| $10,000 to $12,499 | 0 (0.0%) | 10 (4.7%) |
| $12,500 to $14,999 | 0 (0.0%) | 0 (0.0%) |
| $15,000 to $17,499 | 10 (4.2%) | 2 (0.9%) |
| $17,500 to $19,999 | 5 (2.1%) | 4 (1.9%) |
| $20,000 to $22,499 | 2 (0.8%) | 4 (1.9%) |
| $22,500 to $24,999 | 2 (0.8%) | 22 (10.3%) |
| $25,000 to $29,999 | 0 (0.0%) | 14 (6.5%) |
| $30,000 to $34,999 | 7 (2.9%) | 24 (11.2%) |
| $35,000 to $39,999 | 36 (15.2%) | 18 (8.4%) |
| $40,000 to $44,999 | 12 (5.1%) | 31 (14.5%) |
| $45,000 to $49,999 | 8 (3.4%) | 10 (4.7%) |
| $50,000 to $54,999 | 2 (0.8%) | 4 (1.9%) |
| $55,000 to $64,999 | 23 (9.7%) | 21 (9.8%) |
| $65,000 to $74,999 | 35 (14.8%) | 7 (3.3%) |
| $75,000 to $99,999 | 42 (17.7%) | 8 (3.7%) |
| $100,000+ | 22 (9.3%) | 6 (2.8%) |
| Total | 237 (100.0%) | 214 (100.0%) |
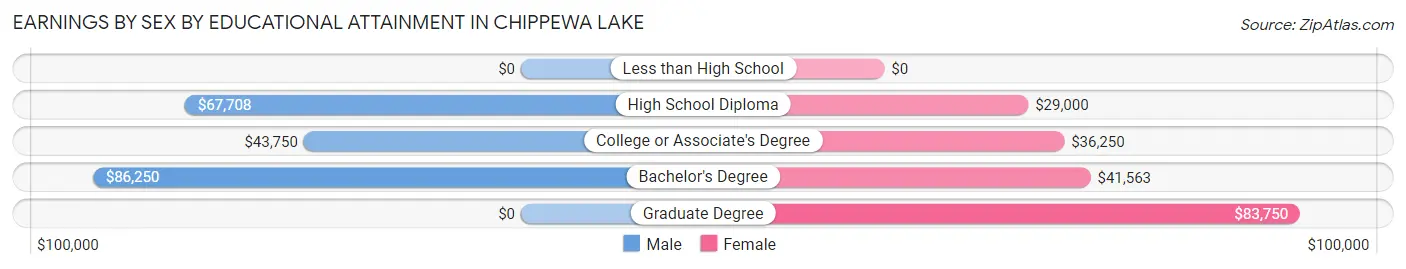
Earnings by Sex by Educational Attainment in Chippewa Lake
Average earnings in Chippewa Lake are $61,250 for men and $38,984 for women, a difference of 36.3%. Men with an educational attainment of bachelor's degree enjoy the highest average annual earnings of $86,250, while those with college or associate's degree education earn the least with $43,750. Women with an educational attainment of graduate degree earn the most with the average annual earnings of $83,750, while those with high school diploma education have the smallest earnings of $29,000.
| Educational Attainment | Male Income | Female Income |
| Less than High School | - | - |
| High School Diploma | $67,708 | $29,000 |
| College or Associate's Degree | $43,750 | $36,250 |
| Bachelor's Degree | $86,250 | $41,563 |
| Graduate Degree | - | - |
| Total | $61,250 | $38,984 |
Family Income in Chippewa Lake
Family Income Brackets in Chippewa Lake
According to the Chippewa Lake family income data, there are 63 families falling into the $75,000 to $99,999 income range, which is the most common income bracket and makes up 30.9% of all families.
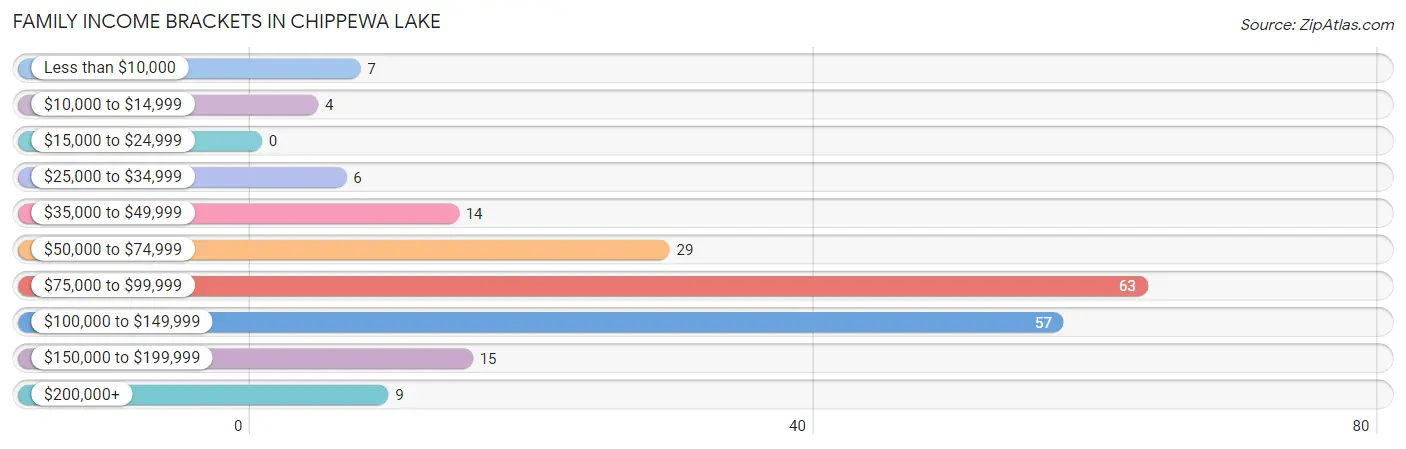
| Income Bracket | # Families | % Families |
| Less than $10,000 | 7 | 3.4% |
| $10,000 to $14,999 | 4 | 2.0% |
| $15,000 to $24,999 | 0 | 0.0% |
| $25,000 to $34,999 | 6 | 2.9% |
| $35,000 to $49,999 | 14 | 6.9% |
| $50,000 to $74,999 | 29 | 14.2% |
| $75,000 to $99,999 | 63 | 30.9% |
| $100,000 to $149,999 | 57 | 27.9% |
| $150,000 to $199,999 | 15 | 7.4% |
| $200,000+ | 9 | 4.4% |
Family Income by Famaliy Size in Chippewa Lake
3-person families (23 | 11.3%) account for the highest median family income in Chippewa Lake with $131,042 per family, while 2-person families (146 | 71.6%) have the highest median income of $44,125 per family member.
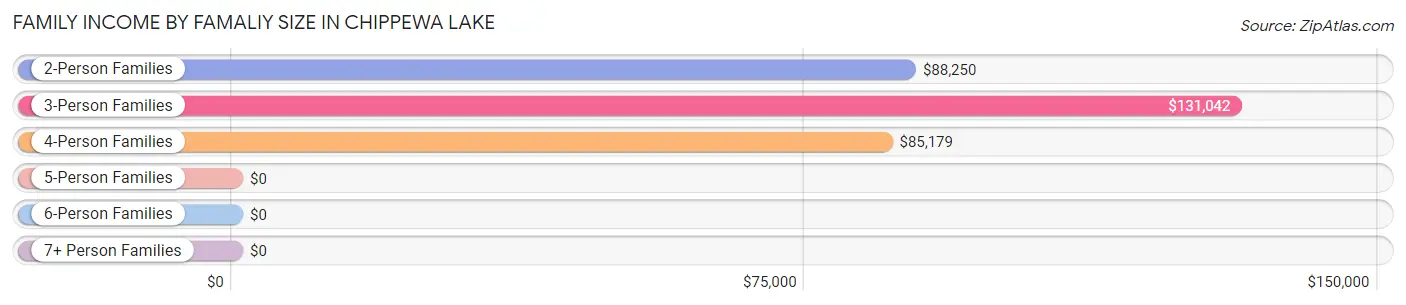
| Income Bracket | # Families | Median Income |
| 2-Person Families | 146 (71.6%) | $88,250 |
| 3-Person Families | 23 (11.3%) | $131,042 |
| 4-Person Families | 27 (13.2%) | $85,179 |
| 5-Person Families | 2 (1.0%) | $0 |
| 6-Person Families | 6 (2.9%) | $0 |
| 7+ Person Families | 0 (0.0%) | $0 |
| Total | 204 (100.0%) | $88,542 |
Family Income by Number of Earners in Chippewa Lake
The median family income in Chippewa Lake is $88,542, with families comprising 3+ earners (27) having the highest median family income of $101,042, while families with no earners (26) have the lowest median family income of $86,250, accounting for 13.2% and 12.8% of families, respectively.
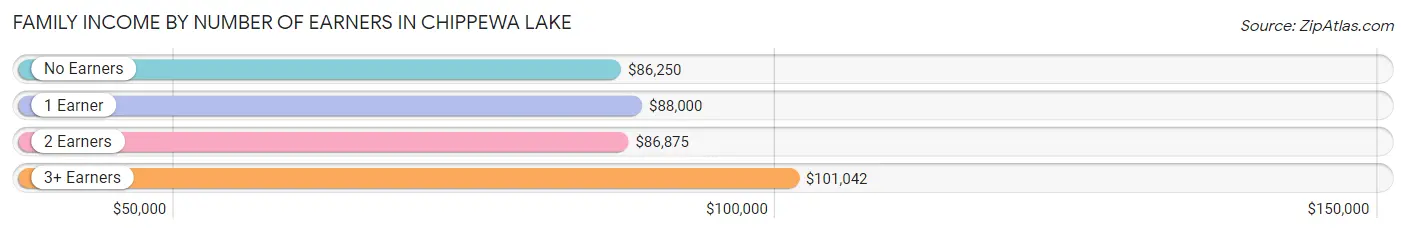
| Number of Earners | # Families | Median Income |
| No Earners | 26 (12.8%) | $86,250 |
| 1 Earner | 72 (35.3%) | $88,000 |
| 2 Earners | 79 (38.7%) | $86,875 |
| 3+ Earners | 27 (13.2%) | $101,042 |
| Total | 204 (100.0%) | $88,542 |
Household Income in Chippewa Lake
Household Income Brackets in Chippewa Lake
With 88 households falling in the category, the $75,000 to $99,999 income range is the most frequent in Chippewa Lake, accounting for 27.5% of all households. In contrast, only 9 households (2.8%) fall into the $200,000+ income bracket, making it the least populous group.
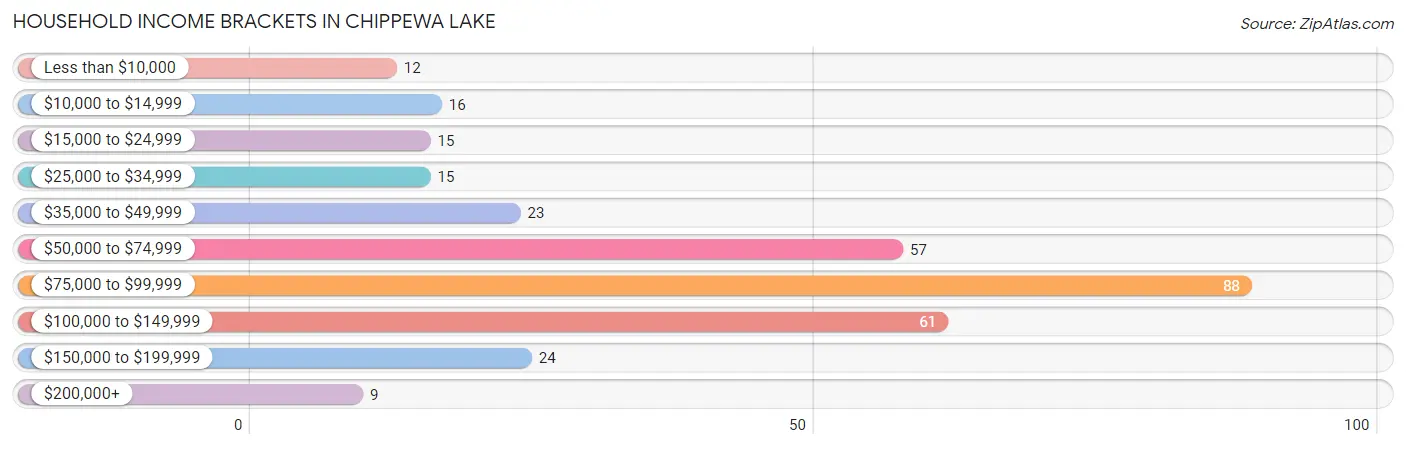
| Income Bracket | # Households | % Households |
| Less than $10,000 | 12 | 3.8% |
| $10,000 to $14,999 | 16 | 5.0% |
| $15,000 to $24,999 | 15 | 4.7% |
| $25,000 to $34,999 | 15 | 4.7% |
| $35,000 to $49,999 | 23 | 7.2% |
| $50,000 to $74,999 | 57 | 17.8% |
| $75,000 to $99,999 | 88 | 27.5% |
| $100,000 to $149,999 | 61 | 19.1% |
| $150,000 to $199,999 | 24 | 7.5% |
| $200,000+ | 9 | 2.8% |
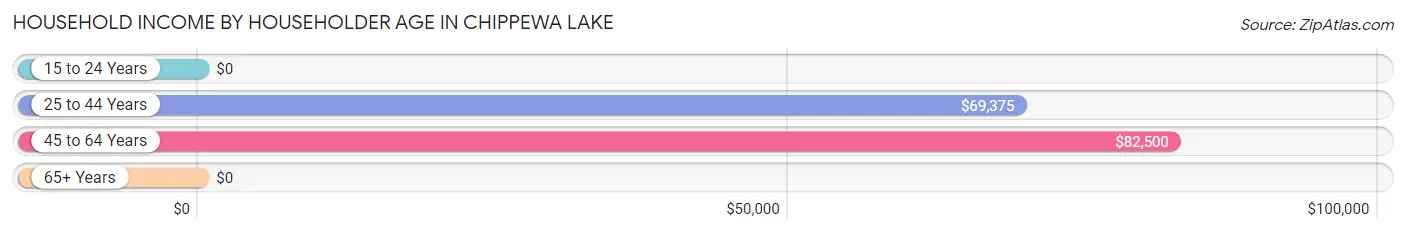
Household Income by Householder Age in Chippewa Lake
The median household income in Chippewa Lake is $79,333, with the highest median household income of $82,500 found in the 45 to 64 years age bracket for the primary householder. A total of 148 households (46.3%) fall into this category. Meanwhile, the 15 to 24 years age bracket for the primary householder has the lowest median household income of $0, with 8 households (2.5%) in this group.
| Income Bracket | # Households | Median Income |
| 15 to 24 Years | 8 (2.5%) | $0 |
| 25 to 44 Years | 55 (17.2%) | $69,375 |
| 45 to 64 Years | 148 (46.3%) | $82,500 |
| 65+ Years | 109 (34.1%) | $0 |
| Total | 320 (100.0%) | $79,333 |
Poverty in Chippewa Lake
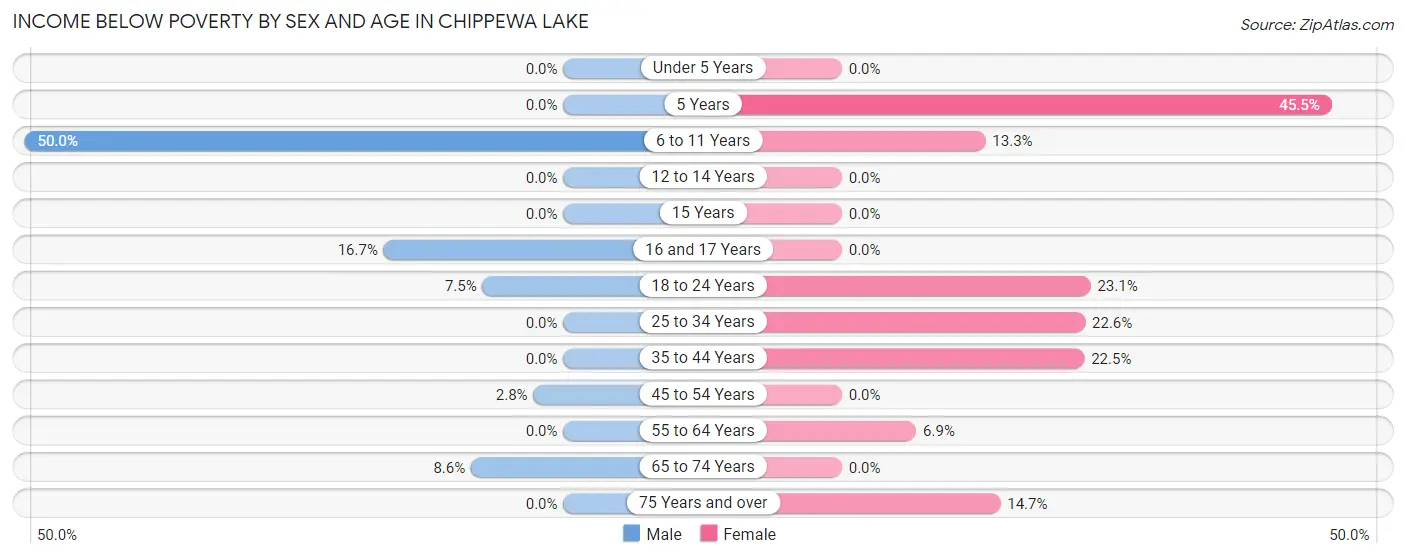
Income Below Poverty by Sex and Age in Chippewa Lake
With 4.4% poverty level for males and 10.3% for females among the residents of Chippewa Lake, 6 to 11 year old males and 5 year old females are the most vulnerable to poverty, with 3 males (50.0%) and 5 females (45.5%) in their respective age groups living below the poverty level.
| Age Bracket | Male | Female |
| Under 5 Years | 0 (0.0%) | 0 (0.0%) |
| 5 Years | 0 (0.0%) | 5 (45.5%) |
| 6 to 11 Years | 3 (50.0%) | 2 (13.3%) |
| 12 to 14 Years | 0 (0.0%) | 0 (0.0%) |
| 15 Years | 0 (0.0%) | 0 (0.0%) |
| 16 and 17 Years | 2 (16.7%) | 0 (0.0%) |
| 18 to 24 Years | 3 (7.5%) | 3 (23.1%) |
| 25 to 34 Years | 0 (0.0%) | 7 (22.6%) |
| 35 to 44 Years | 0 (0.0%) | 9 (22.5%) |
| 45 to 54 Years | 2 (2.8%) | 0 (0.0%) |
| 55 to 64 Years | 0 (0.0%) | 4 (6.9%) |
| 65 to 74 Years | 6 (8.6%) | 0 (0.0%) |
| 75 Years and over | 0 (0.0%) | 5 (14.7%) |
| Total | 16 (4.4%) | 35 (10.3%) |
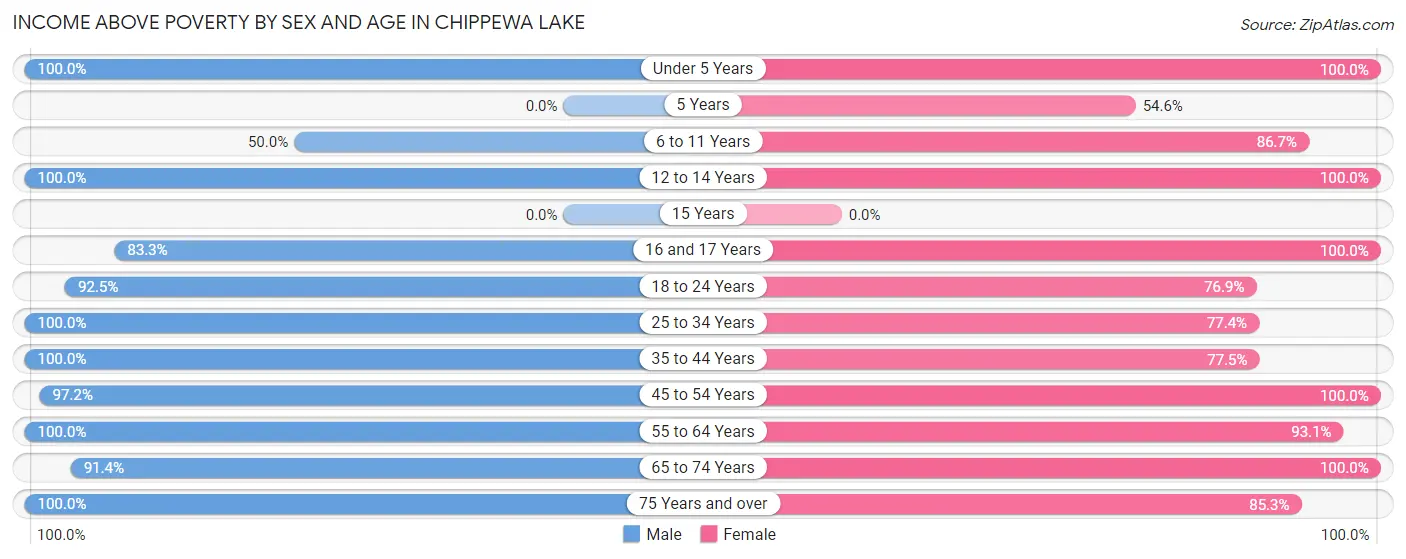
Income Above Poverty by Sex and Age in Chippewa Lake
According to the poverty statistics in Chippewa Lake, males aged under 5 years and females aged under 5 years are the age groups that are most secure financially, with 100.0% of males and 100.0% of females in these age groups living above the poverty line.
| Age Bracket | Male | Female |
| Under 5 Years | 4 (100.0%) | 2 (100.0%) |
| 5 Years | 0 (0.0%) | 6 (54.5%) |
| 6 to 11 Years | 3 (50.0%) | 13 (86.7%) |
| 12 to 14 Years | 6 (100.0%) | 9 (100.0%) |
| 15 Years | 0 (0.0%) | 0 (0.0%) |
| 16 and 17 Years | 10 (83.3%) | 14 (100.0%) |
| 18 to 24 Years | 37 (92.5%) | 10 (76.9%) |
| 25 to 34 Years | 22 (100.0%) | 24 (77.4%) |
| 35 to 44 Years | 19 (100.0%) | 31 (77.5%) |
| 45 to 54 Years | 70 (97.2%) | 53 (100.0%) |
| 55 to 64 Years | 87 (100.0%) | 54 (93.1%) |
| 65 to 74 Years | 64 (91.4%) | 59 (100.0%) |
| 75 Years and over | 25 (100.0%) | 29 (85.3%) |
| Total | 347 (95.6%) | 304 (89.7%) |
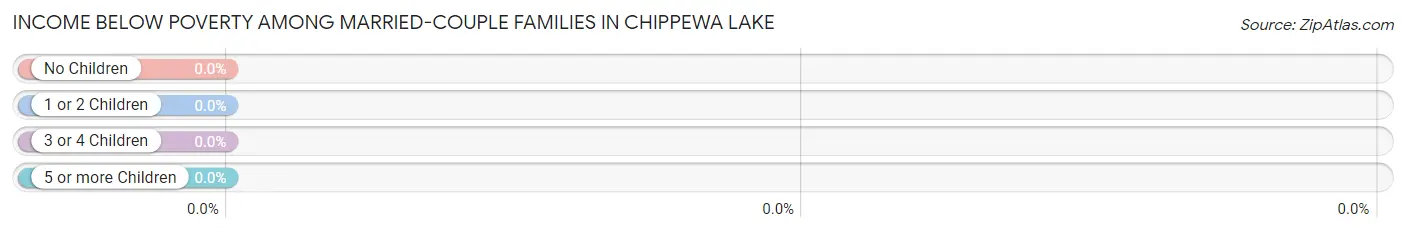
Income Below Poverty Among Married-Couple Families in Chippewa Lake
| Children | Above Poverty | Below Poverty |
| No Children | 131 (100.0%) | 0 (0.0%) |
| 1 or 2 Children | 22 (100.0%) | 0 (0.0%) |
| 3 or 4 Children | 2 (100.0%) | 0 (0.0%) |
| 5 or more Children | 0 (0.0%) | 0 (0.0%) |
| Total | 155 (100.0%) | 0 (0.0%) |
Income Below Poverty Among Single-Parent Households in Chippewa Lake
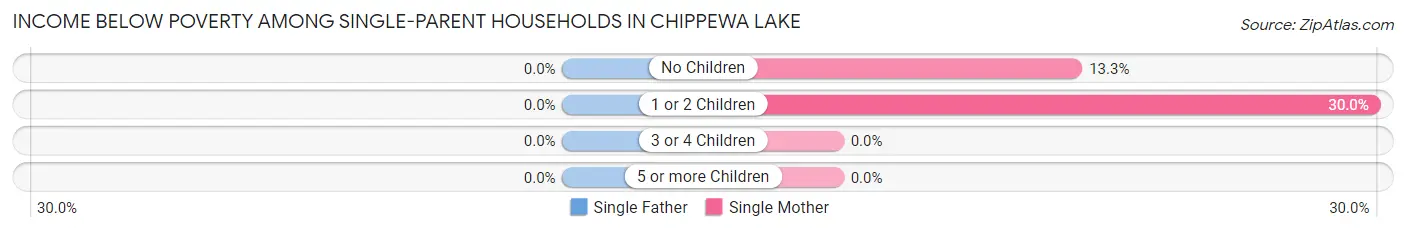
| Children | Single Father | Single Mother |
| No Children | 0 (0.0%) | 2 (13.3%) |
| 1 or 2 Children | 0 (0.0%) | 9 (30.0%) |
| 3 or 4 Children | 0 (0.0%) | 0 (0.0%) |
| 5 or more Children | 0 (0.0%) | 0 (0.0%) |
| Total | 0 (0.0%) | 11 (24.4%) |
Income Below Poverty Among Married-Couple vs Single-Parent Households in Chippewa Lake
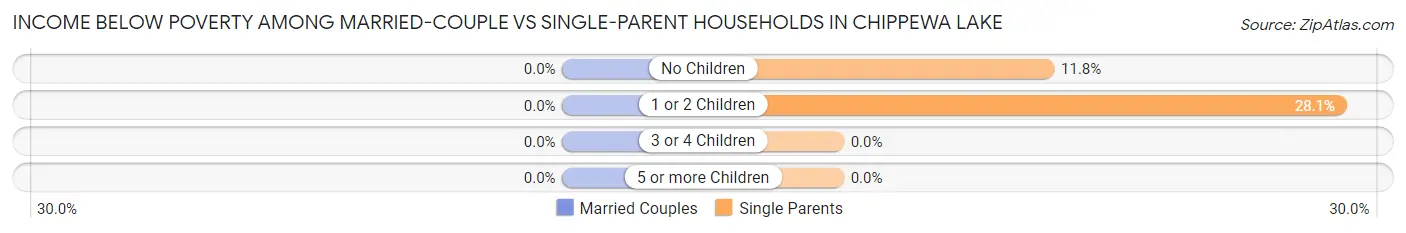
| Children | Married-Couple Families | Single-Parent Households |
| No Children | 0 (0.0%) | 2 (11.8%) |
| 1 or 2 Children | 0 (0.0%) | 9 (28.1%) |
| 3 or 4 Children | 0 (0.0%) | 0 (0.0%) |
| 5 or more Children | 0 (0.0%) | 0 (0.0%) |
| Total | 0 (0.0%) | 11 (22.5%) |
Race in Chippewa Lake
The most populous races in Chippewa Lake are White / Caucasian (687 | 97.6%), Hispanic or Latino (11 | 1.6%), and Two or more Races (10 | 1.4%).
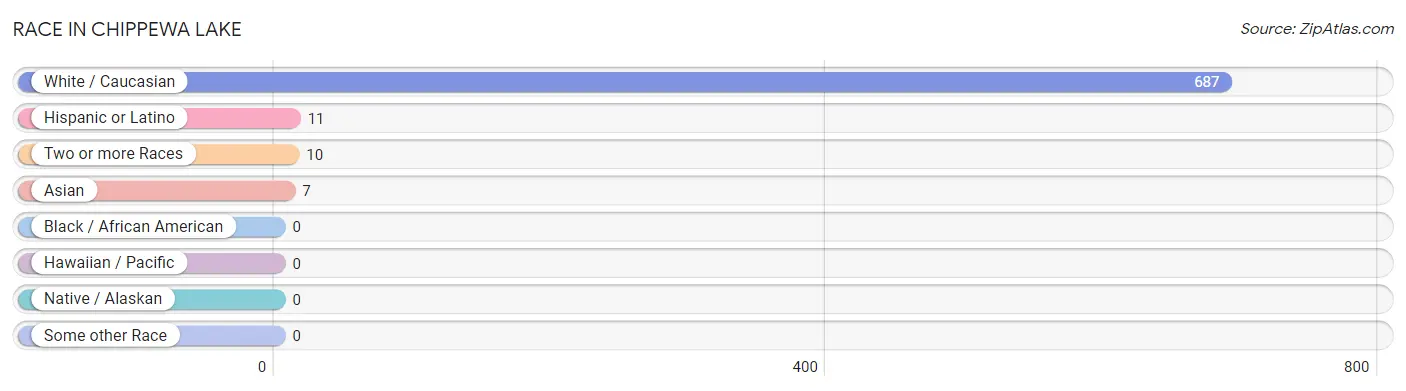
| Race | # Population | % Population |
| Asian | 7 | 1.0% |
| Black / African American | 0 | 0.0% |
| Hawaiian / Pacific | 0 | 0.0% |
| Hispanic or Latino | 11 | 1.6% |
| Native / Alaskan | 0 | 0.0% |
| White / Caucasian | 687 | 97.6% |
| Two or more Races | 10 | 1.4% |
| Some other Race | 0 | 0.0% |
| Total | 704 | 100.0% |
Ancestry in Chippewa Lake
The most populous ancestries reported in Chippewa Lake are German (277 | 39.4%), Irish (145 | 20.6%), English (108 | 15.3%), Italian (55 | 7.8%), and Polish (43 | 6.1%), together accounting for 89.2% of all Chippewa Lake residents.
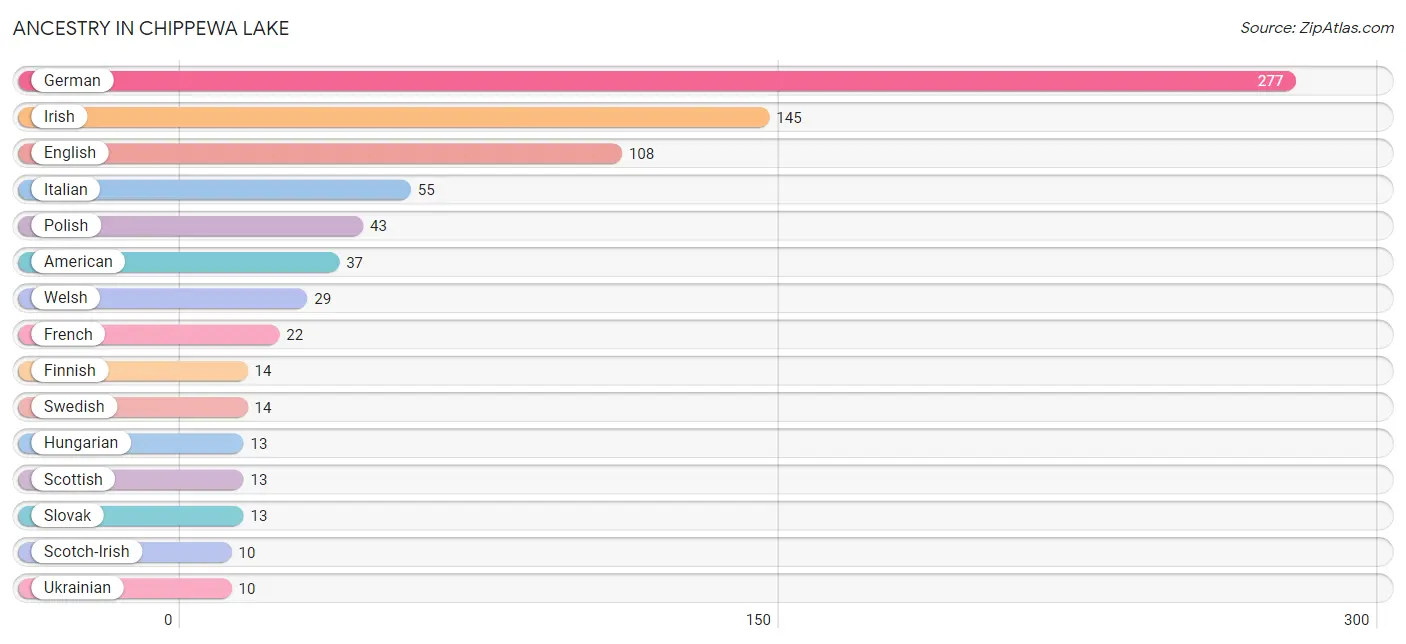
| Ancestry | # Population | % Population |
| American | 37 | 5.3% |
| Arab | 2 | 0.3% |
| Austrian | 2 | 0.3% |
| British | 3 | 0.4% |
| Croatian | 8 | 1.1% |
| Czech | 2 | 0.3% |
| Czechoslovakian | 3 | 0.4% |
| Danish | 2 | 0.3% |
| Dutch | 4 | 0.6% |
| English | 108 | 15.3% |
| European | 7 | 1.0% |
| Finnish | 14 | 2.0% |
| French | 22 | 3.1% |
| French Canadian | 2 | 0.3% |
| German | 277 | 39.4% |
| Greek | 7 | 1.0% |
| Hungarian | 13 | 1.8% |
| Irish | 145 | 20.6% |
| Italian | 55 | 7.8% |
| Lebanese | 2 | 0.3% |
| Lithuanian | 4 | 0.6% |
| Mexican | 3 | 0.4% |
| Polish | 43 | 6.1% |
| Puerto Rican | 4 | 0.6% |
| Russian | 8 | 1.1% |
| Scotch-Irish | 10 | 1.4% |
| Scottish | 13 | 1.8% |
| Serbian | 3 | 0.4% |
| Slovak | 13 | 1.8% |
| Slovene | 2 | 0.3% |
| Spanish | 2 | 0.3% |
| Swedish | 14 | 2.0% |
| Swiss | 4 | 0.6% |
| Thai | 7 | 1.0% |
| Ukrainian | 10 | 1.4% |
| Welsh | 29 | 4.1% | View All 36 Rows |
Immigrants in Chippewa Lake
The most numerous immigrant groups reported in Chippewa Lake came from Asia (7 | 1.0%), India (7 | 1.0%), South Central Asia (7 | 1.0%), Europe (3 | 0.4%), and Northern Europe (3 | 0.4%), together accounting for 3.8% of all Chippewa Lake residents.
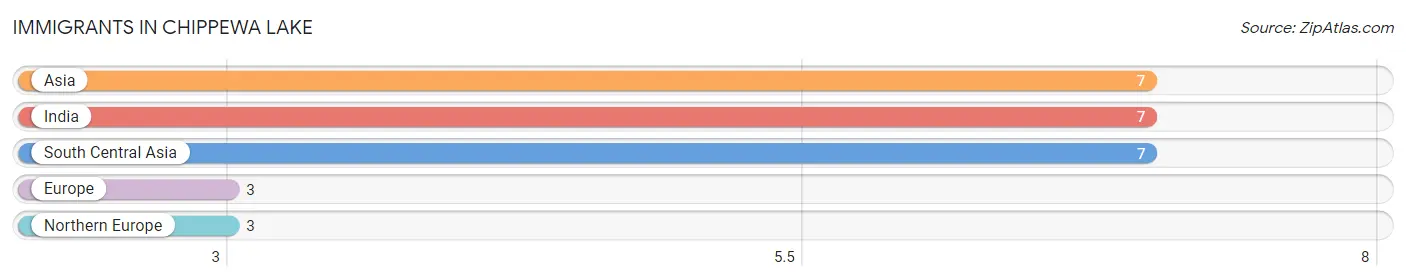
| Immigration Origin | # Population | % Population |
| Asia | 7 | 1.0% |
| Europe | 3 | 0.4% |
| India | 7 | 1.0% |
| Northern Europe | 3 | 0.4% |
| South Central Asia | 7 | 1.0% | View All 5 Rows |
Sex and Age in Chippewa Lake
Sex and Age in Chippewa Lake
The most populous age groups in Chippewa Lake are 60 to 64 Years (61 | 16.8%) for men and 65 to 69 Years (41 | 12.0%) for women.
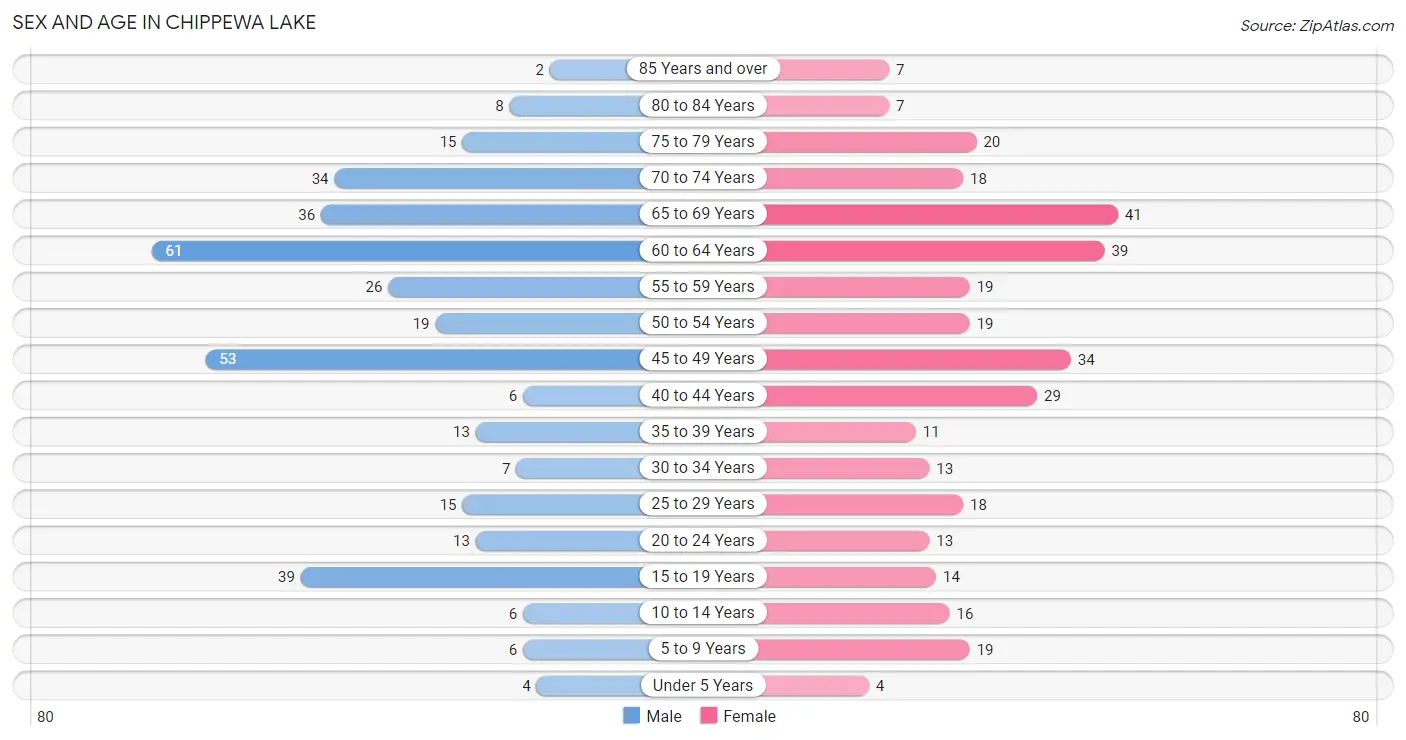
| Age Bracket | Male | Female |
| Under 5 Years | 4 (1.1%) | 4 (1.2%) |
| 5 to 9 Years | 6 (1.7%) | 19 (5.6%) |
| 10 to 14 Years | 6 (1.7%) | 16 (4.7%) |
| 15 to 19 Years | 39 (10.7%) | 14 (4.1%) |
| 20 to 24 Years | 13 (3.6%) | 13 (3.8%) |
| 25 to 29 Years | 15 (4.1%) | 18 (5.3%) |
| 30 to 34 Years | 7 (1.9%) | 13 (3.8%) |
| 35 to 39 Years | 13 (3.6%) | 11 (3.2%) |
| 40 to 44 Years | 6 (1.7%) | 29 (8.5%) |
| 45 to 49 Years | 53 (14.6%) | 34 (10.0%) |
| 50 to 54 Years | 19 (5.2%) | 19 (5.6%) |
| 55 to 59 Years | 26 (7.2%) | 19 (5.6%) |
| 60 to 64 Years | 61 (16.8%) | 39 (11.4%) |
| 65 to 69 Years | 36 (9.9%) | 41 (12.0%) |
| 70 to 74 Years | 34 (9.4%) | 18 (5.3%) |
| 75 to 79 Years | 15 (4.1%) | 20 (5.9%) |
| 80 to 84 Years | 8 (2.2%) | 7 (2.1%) |
| 85 Years and over | 2 (0.5%) | 7 (2.1%) |
| Total | 363 (100.0%) | 341 (100.0%) |
Families and Households in Chippewa Lake
Median Family Size in Chippewa Lake
The median family size in Chippewa Lake is 2.71 persons per family, with single female/mother families (45 | 22.1%) accounting for the largest median family size of 3.24 persons per family. On the other hand, single male/father families (4 | 2.0%) represent the smallest median family size with 2.00 persons per family.
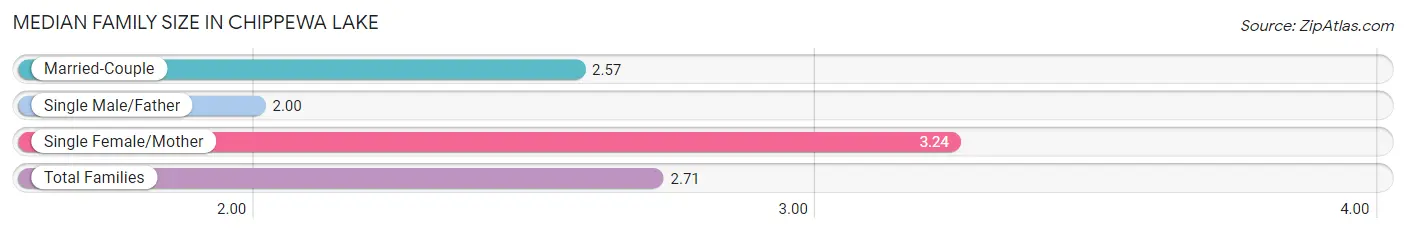
| Family Type | # Families | Family Size |
| Married-Couple | 155 (76.0%) | 2.57 |
| Single Male/Father | 4 (2.0%) | 2.00 |
| Single Female/Mother | 45 (22.1%) | 3.24 |
| Total Families | 204 (100.0%) | 2.71 |
Median Household Size in Chippewa Lake
The median household size in Chippewa Lake is 2.20 persons per household, with single female/mother households (45 | 14.1%) accounting for the largest median household size of 3.47 persons per household. non-family households (116 | 36.2%) represent the smallest median household size with 1.21 persons per household.
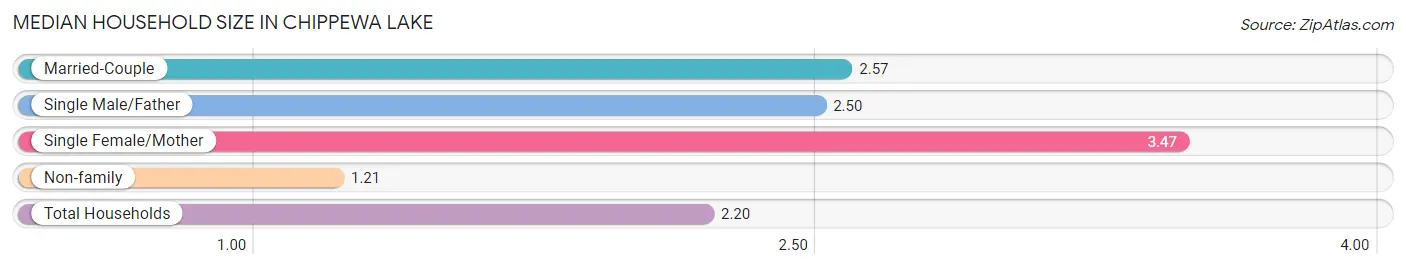
| Household Type | # Households | Household Size |
| Married-Couple | 155 (48.4%) | 2.57 |
| Single Male/Father | 4 (1.3%) | 2.50 |
| Single Female/Mother | 45 (14.1%) | 3.47 |
| Non-family | 116 (36.2%) | 1.21 |
| Total Households | 320 (100.0%) | 2.20 |
Household Size by Marriage Status in Chippewa Lake
Out of a total of 320 households in Chippewa Lake, 204 (63.7%) are family households, while 116 (36.2%) are nonfamily households. The most numerous type of family households are 2-person households, comprising 144, and the most common type of nonfamily households are 1-person households, comprising 93.
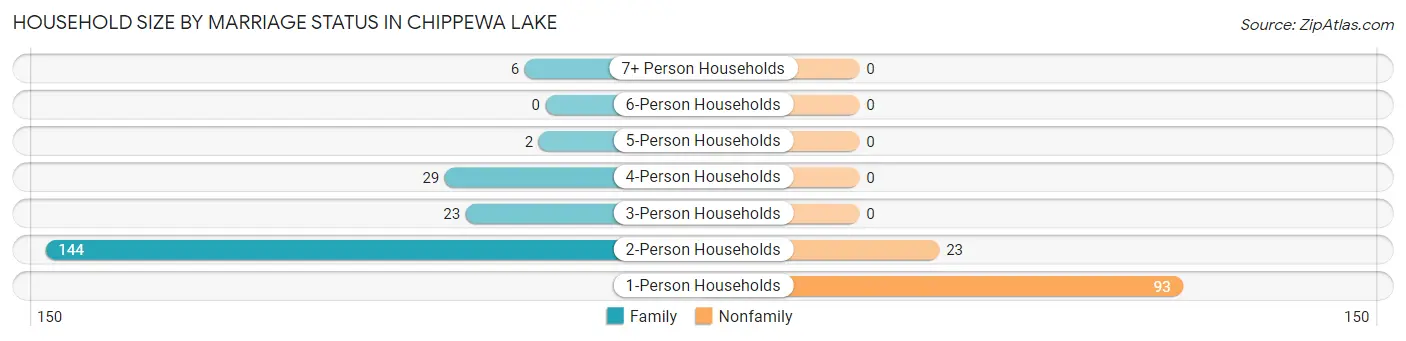
| Household Size | Family Households | Nonfamily Households |
| 1-Person Households | - | 93 (29.1%) |
| 2-Person Households | 144 (45.0%) | 23 (7.2%) |
| 3-Person Households | 23 (7.2%) | 0 (0.0%) |
| 4-Person Households | 29 (9.1%) | 0 (0.0%) |
| 5-Person Households | 2 (0.6%) | 0 (0.0%) |
| 6-Person Households | 0 (0.0%) | 0 (0.0%) |
| 7+ Person Households | 6 (1.9%) | 0 (0.0%) |
| Total | 204 (63.7%) | 116 (36.2%) |
Female Fertility in Chippewa Lake
Fertility by Age in Chippewa Lake
| Age Bracket | Women with Births | Births / 1,000 Women |
| 15 to 19 years | 0 (0.0%) | 0.0 |
| 20 to 34 years | 0 (0.0%) | 0.0 |
| 35 to 50 years | 0 (0.0%) | 0.0 |
| Total | 0 (0.0%) | 0.0 |
Fertility by Age by Marriage Status in Chippewa Lake
| Age Bracket | Married | Unmarried |
| 15 to 19 years | 0 (0.0%) | 0 (0.0%) |
| 20 to 34 years | 0 (0.0%) | 0 (0.0%) |
| 35 to 50 years | 0 (0.0%) | 0 (0.0%) |
| Total | 0 (0.0%) | 0 (0.0%) |
Fertility by Education in Chippewa Lake
| Educational Attainment | Women with Births | Births / 1,000 Women |
| Less than High School | 0 (0.0%) | 0.0 |
| High School Diploma | 0 (0.0%) | 0.0 |
| College or Associate's Degree | 0 (0.0%) | 0.0 |
| Bachelor's Degree | 0 (0.0%) | 0.0 |
| Graduate Degree | 0 (0.0%) | 0.0 |
| Total | 0 (0.0%) | 0.0 |
Fertility by Education by Marriage Status in Chippewa Lake
| Educational Attainment | Married | Unmarried |
| Less than High School | 0 (0.0%) | 0 (0.0%) |
| High School Diploma | 0 (0.0%) | 0 (0.0%) |
| College or Associate's Degree | 0 (0.0%) | 0 (0.0%) |
| Bachelor's Degree | 0 (0.0%) | 0 (0.0%) |
| Graduate Degree | 0 (0.0%) | 0 (0.0%) |
| Total | 0 (0.0%) | 0 (0.0%) |
Employment Characteristics in Chippewa Lake
Employment by Class of Employer in Chippewa Lake
Among the 426 employed individuals in Chippewa Lake, private company employees (362 | 85.0%), local government employees (24 | 5.6%), and not-for-profit organizations (21 | 4.9%) make up the most common classes of employment.
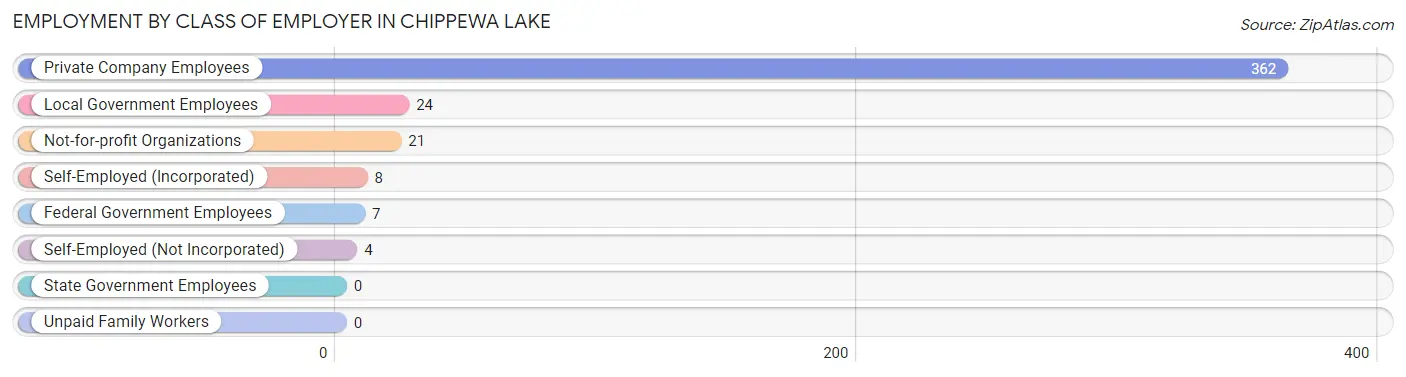
| Employer Class | # Employees | % Employees |
| Private Company Employees | 362 | 85.0% |
| Self-Employed (Incorporated) | 8 | 1.9% |
| Self-Employed (Not Incorporated) | 4 | 0.9% |
| Not-for-profit Organizations | 21 | 4.9% |
| Local Government Employees | 24 | 5.6% |
| State Government Employees | 0 | 0.0% |
| Federal Government Employees | 7 | 1.6% |
| Unpaid Family Workers | 0 | 0.0% |
| Total | 426 | 100.0% |
Employment Status by Age in Chippewa Lake
According to the labor force statistics for Chippewa Lake, out of the total population over 16 years of age (649), 68.6% or 445 individuals are in the labor force, with 2.5% or 11 of them unemployed. The age group with the highest labor force participation rate is 20 to 24 years, with 100.0% or 26 individuals in the labor force. Within the labor force, the 30 to 34 years age range has the highest percentage of unemployed individuals, with 11.8% or 2 of them being unemployed.
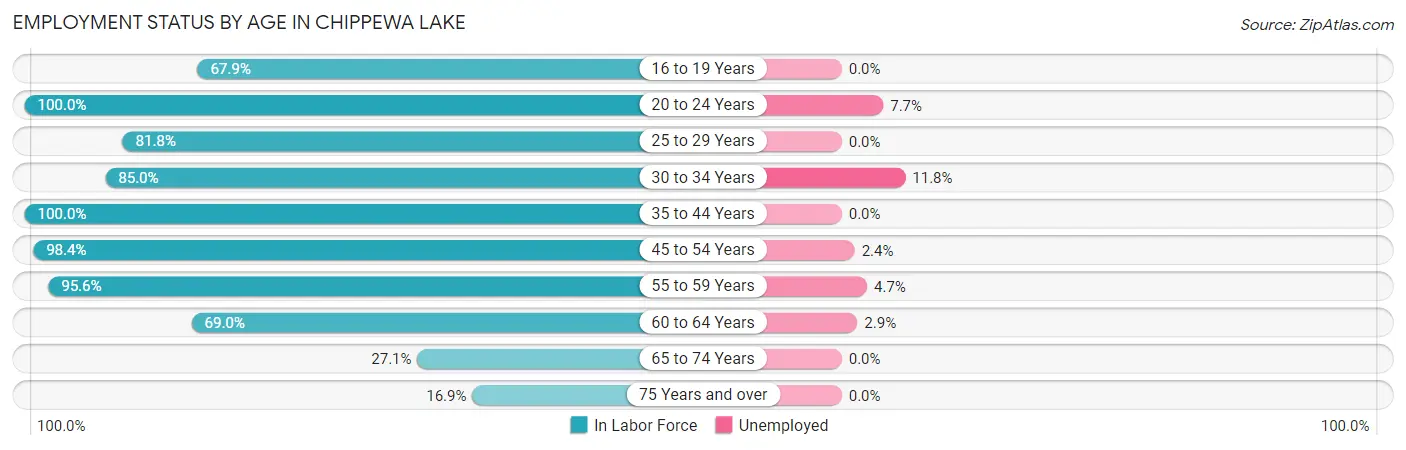
| Age Bracket | In Labor Force | Unemployed |
| 16 to 19 Years | 36 (67.9%) | 0 (0.0%) |
| 20 to 24 Years | 26 (100.0%) | 2 (7.7%) |
| 25 to 29 Years | 27 (81.8%) | 0 (0.0%) |
| 30 to 34 Years | 17 (85.0%) | 2 (11.8%) |
| 35 to 44 Years | 59 (100.0%) | 0 (0.0%) |
| 45 to 54 Years | 123 (98.4%) | 3 (2.4%) |
| 55 to 59 Years | 43 (95.6%) | 2 (4.7%) |
| 60 to 64 Years | 69 (69.0%) | 2 (2.9%) |
| 65 to 74 Years | 35 (27.1%) | 0 (0.0%) |
| 75 Years and over | 10 (16.9%) | 0 (0.0%) |
| Total | 445 (68.6%) | 11 (2.5%) |
Employment Status by Educational Attainment in Chippewa Lake
According to labor force statistics for Chippewa Lake, 88.5% of individuals (338) out of the total population between 25 and 64 years of age (382) are in the labor force, with 2.7% or 9 of them being unemployed. The group with the highest labor force participation rate are those with the educational attainment of bachelor's degree or higher, with 97.6% or 80 individuals in the labor force. Within the labor force, individuals with high school diploma education have the highest percentage of unemployment, with 7.1% or 7 of them being unemployed.
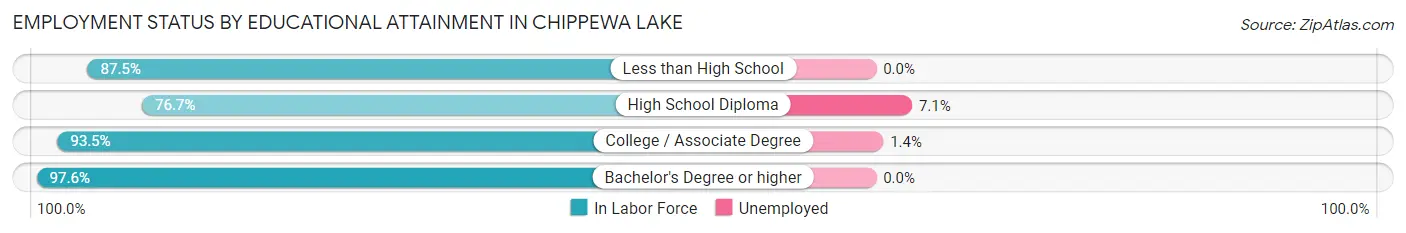
| Educational Attainment | In Labor Force | Unemployed |
| Less than High School | 14 (87.5%) | 0 (0.0%) |
| High School Diploma | 99 (76.7%) | 9 (7.1%) |
| College / Associate Degree | 145 (93.5%) | 2 (1.4%) |
| Bachelor's Degree or higher | 80 (97.6%) | 0 (0.0%) |
| Total | 338 (88.5%) | 10 (2.7%) |
Employment Occupations by Sex in Chippewa Lake
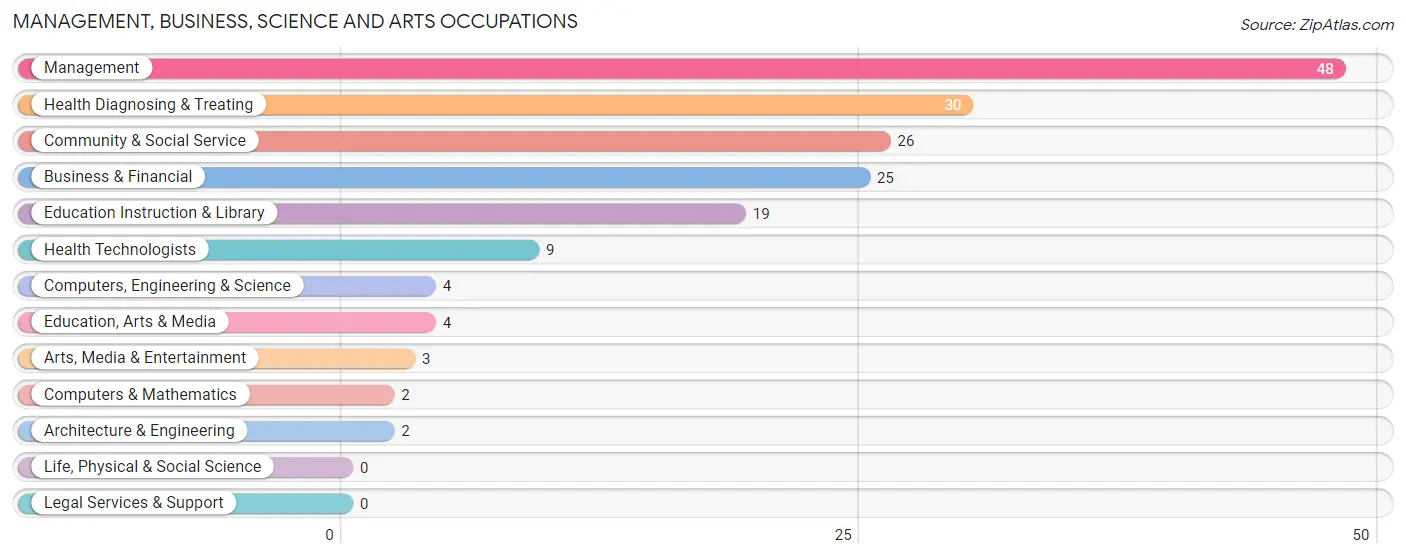
Management, Business, Science and Arts Occupations
The most common Management, Business, Science and Arts occupations in Chippewa Lake are Management (48 | 11.1%), Health Diagnosing & Treating (30 | 6.9%), Community & Social Service (26 | 6.0%), Business & Financial (25 | 5.8%), and Education Instruction & Library (19 | 4.4%).
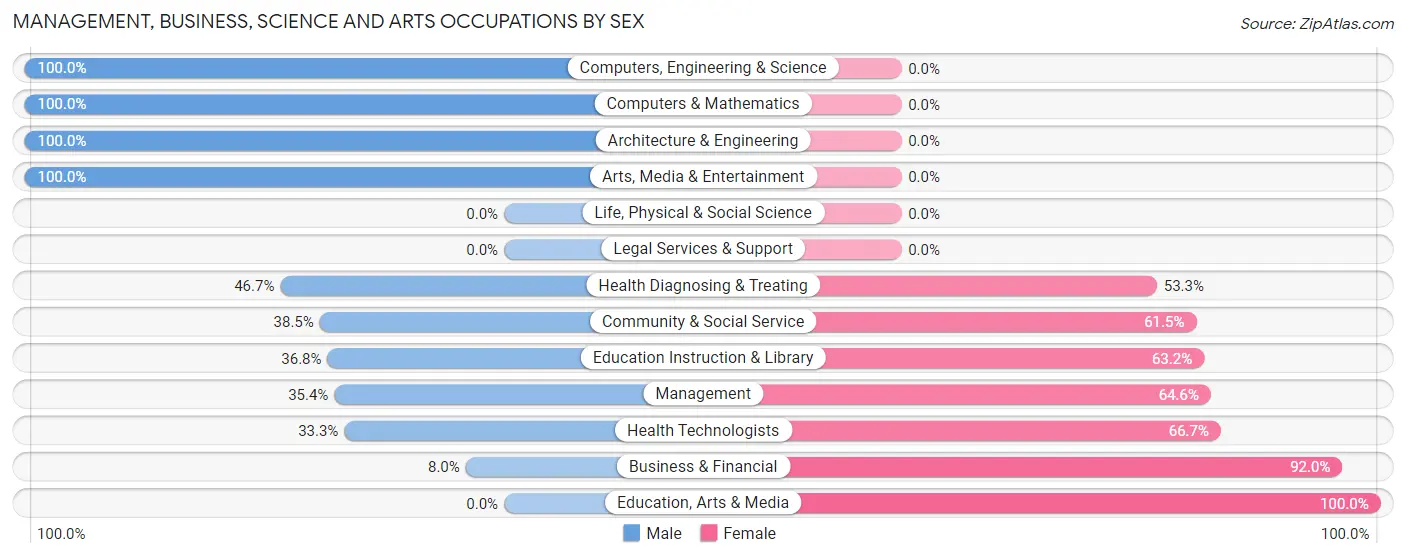
Management, Business, Science and Arts Occupations by Sex
Within the Management, Business, Science and Arts occupations in Chippewa Lake, the most male-oriented occupations are Computers, Engineering & Science (100.0%), Computers & Mathematics (100.0%), and Architecture & Engineering (100.0%), while the most female-oriented occupations are Education, Arts & Media (100.0%), Business & Financial (92.0%), and Health Technologists (66.7%).
| Occupation | Male | Female |
| Management | 17 (35.4%) | 31 (64.6%) |
| Business & Financial | 2 (8.0%) | 23 (92.0%) |
| Computers, Engineering & Science | 4 (100.0%) | 0 (0.0%) |
| Computers & Mathematics | 2 (100.0%) | 0 (0.0%) |
| Architecture & Engineering | 2 (100.0%) | 0 (0.0%) |
| Life, Physical & Social Science | 0 (0.0%) | 0 (0.0%) |
| Community & Social Service | 10 (38.5%) | 16 (61.5%) |
| Education, Arts & Media | 0 (0.0%) | 4 (100.0%) |
| Legal Services & Support | 0 (0.0%) | 0 (0.0%) |
| Education Instruction & Library | 7 (36.8%) | 12 (63.2%) |
| Arts, Media & Entertainment | 3 (100.0%) | 0 (0.0%) |
| Health Diagnosing & Treating | 14 (46.7%) | 16 (53.3%) |
| Health Technologists | 3 (33.3%) | 6 (66.7%) |
| Total (Category) | 47 (35.3%) | 86 (64.7%) |
| Total (Overall) | 224 (51.6%) | 210 (48.4%) |
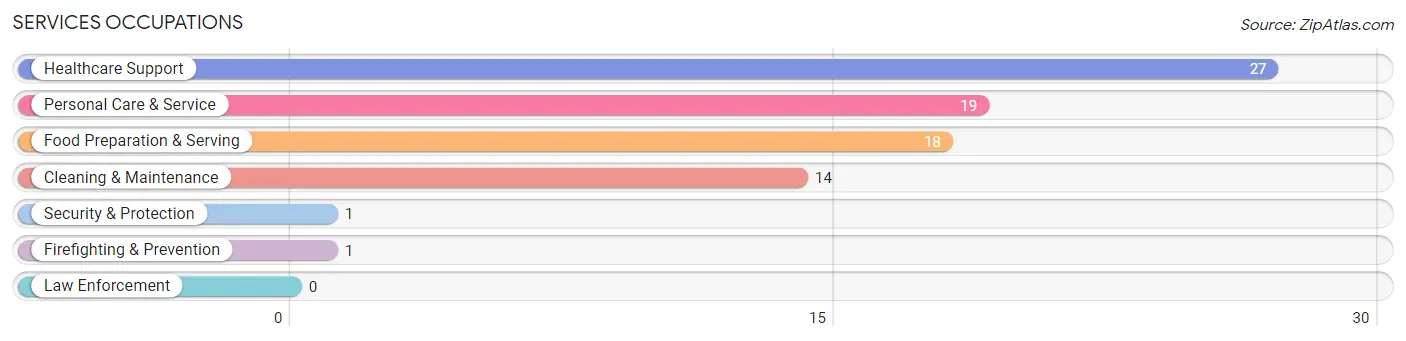
Services Occupations
The most common Services occupations in Chippewa Lake are Healthcare Support (27 | 6.2%), Personal Care & Service (19 | 4.4%), Food Preparation & Serving (18 | 4.2%), Cleaning & Maintenance (14 | 3.2%), and Security & Protection (1 | 0.2%).
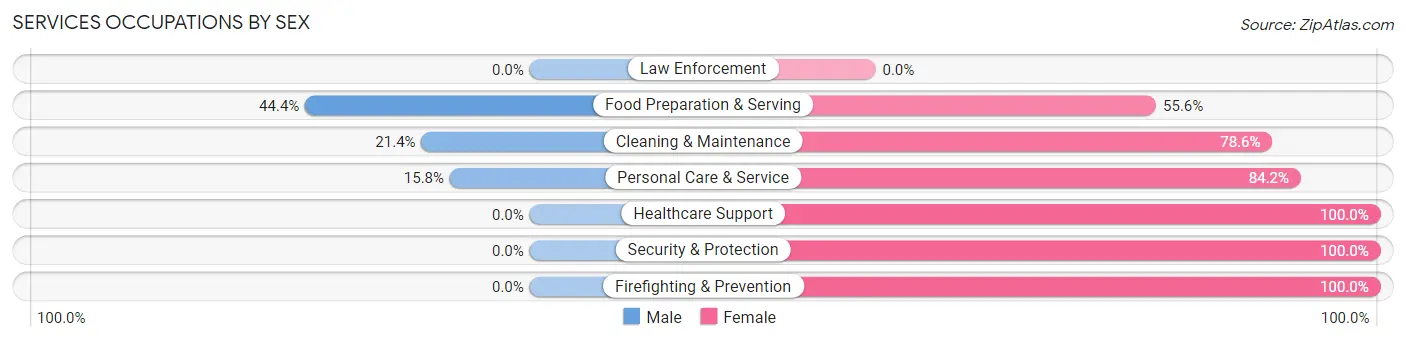
Services Occupations by Sex
Within the Services occupations in Chippewa Lake, the most male-oriented occupations are Food Preparation & Serving (44.4%), Cleaning & Maintenance (21.4%), and Personal Care & Service (15.8%), while the most female-oriented occupations are Healthcare Support (100.0%), Security & Protection (100.0%), and Firefighting & Prevention (100.0%).
| Occupation | Male | Female |
| Healthcare Support | 0 (0.0%) | 27 (100.0%) |
| Security & Protection | 0 (0.0%) | 1 (100.0%) |
| Firefighting & Prevention | 0 (0.0%) | 1 (100.0%) |
| Law Enforcement | 0 (0.0%) | 0 (0.0%) |
| Food Preparation & Serving | 8 (44.4%) | 10 (55.6%) |
| Cleaning & Maintenance | 3 (21.4%) | 11 (78.6%) |
| Personal Care & Service | 3 (15.8%) | 16 (84.2%) |
| Total (Category) | 14 (17.7%) | 65 (82.3%) |
| Total (Overall) | 224 (51.6%) | 210 (48.4%) |
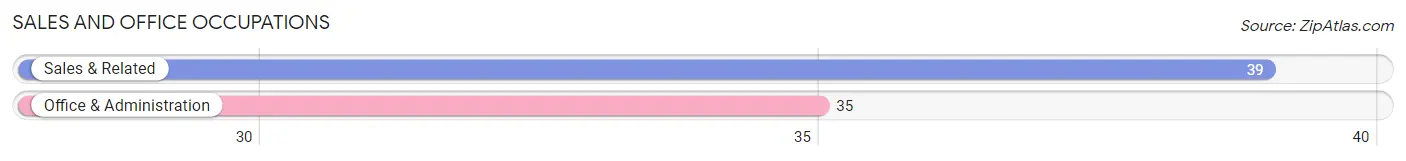
Sales and Office Occupations
The most common Sales and Office occupations in Chippewa Lake are Sales & Related (39 | 9.0%), and Office & Administration (35 | 8.1%).
Sales and Office Occupations by Sex
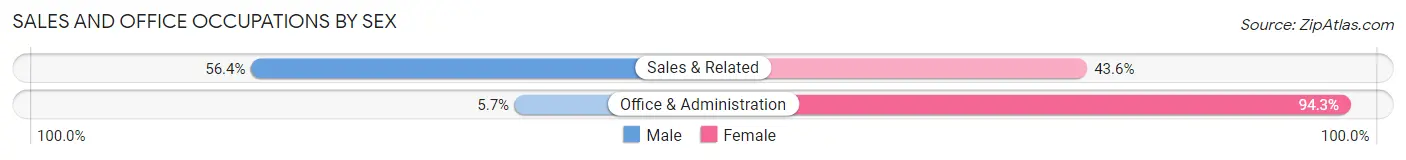
| Occupation | Male | Female |
| Sales & Related | 22 (56.4%) | 17 (43.6%) |
| Office & Administration | 2 (5.7%) | 33 (94.3%) |
| Total (Category) | 24 (32.4%) | 50 (67.6%) |
| Total (Overall) | 224 (51.6%) | 210 (48.4%) |
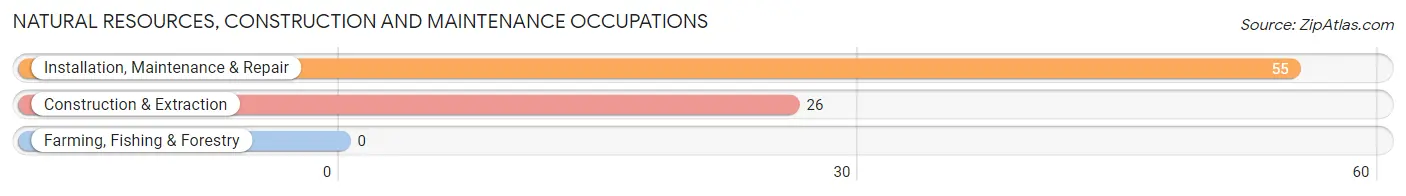
Natural Resources, Construction and Maintenance Occupations
The most common Natural Resources, Construction and Maintenance occupations in Chippewa Lake are Installation, Maintenance & Repair (55 | 12.7%), and Construction & Extraction (26 | 6.0%).
Natural Resources, Construction and Maintenance Occupations by Sex
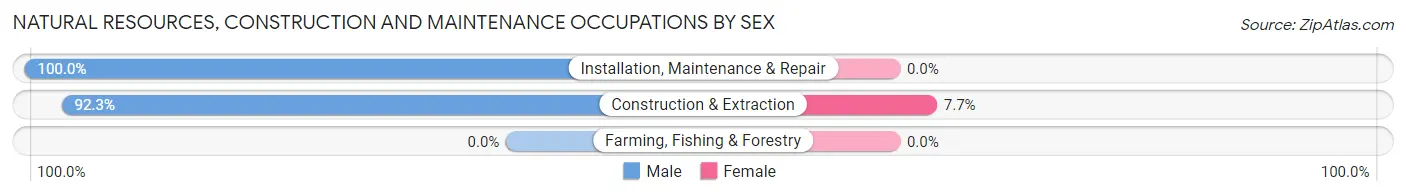
| Occupation | Male | Female |
| Farming, Fishing & Forestry | 0 (0.0%) | 0 (0.0%) |
| Construction & Extraction | 24 (92.3%) | 2 (7.7%) |
| Installation, Maintenance & Repair | 55 (100.0%) | 0 (0.0%) |
| Total (Category) | 79 (97.5%) | 2 (2.5%) |
| Total (Overall) | 224 (51.6%) | 210 (48.4%) |
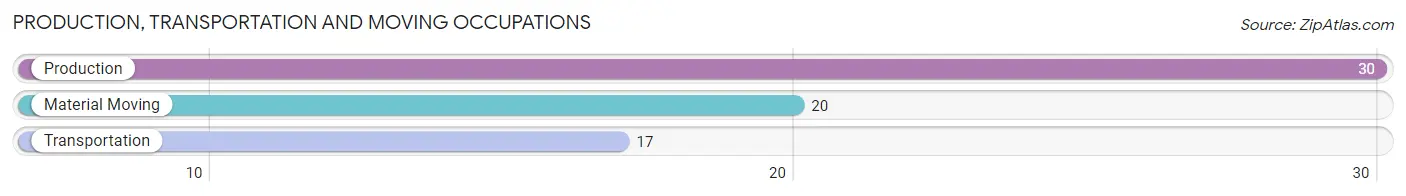
Production, Transportation and Moving Occupations
The most common Production, Transportation and Moving occupations in Chippewa Lake are Production (30 | 6.9%), Material Moving (20 | 4.6%), and Transportation (17 | 3.9%).
Production, Transportation and Moving Occupations by Sex
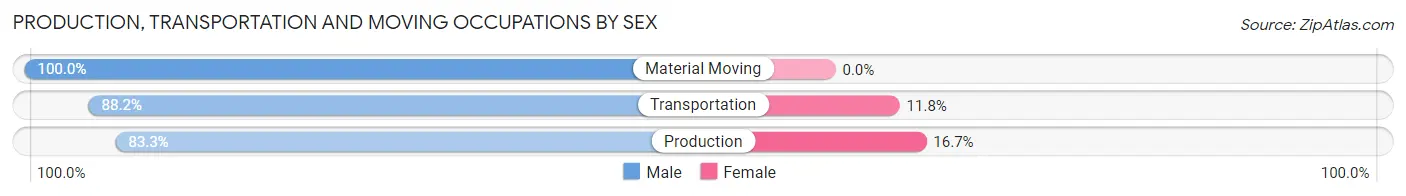
| Occupation | Male | Female |
| Production | 25 (83.3%) | 5 (16.7%) |
| Transportation | 15 (88.2%) | 2 (11.8%) |
| Material Moving | 20 (100.0%) | 0 (0.0%) |
| Total (Category) | 60 (89.5%) | 7 (10.4%) |
| Total (Overall) | 224 (51.6%) | 210 (48.4%) |
Employment Industries by Sex in Chippewa Lake
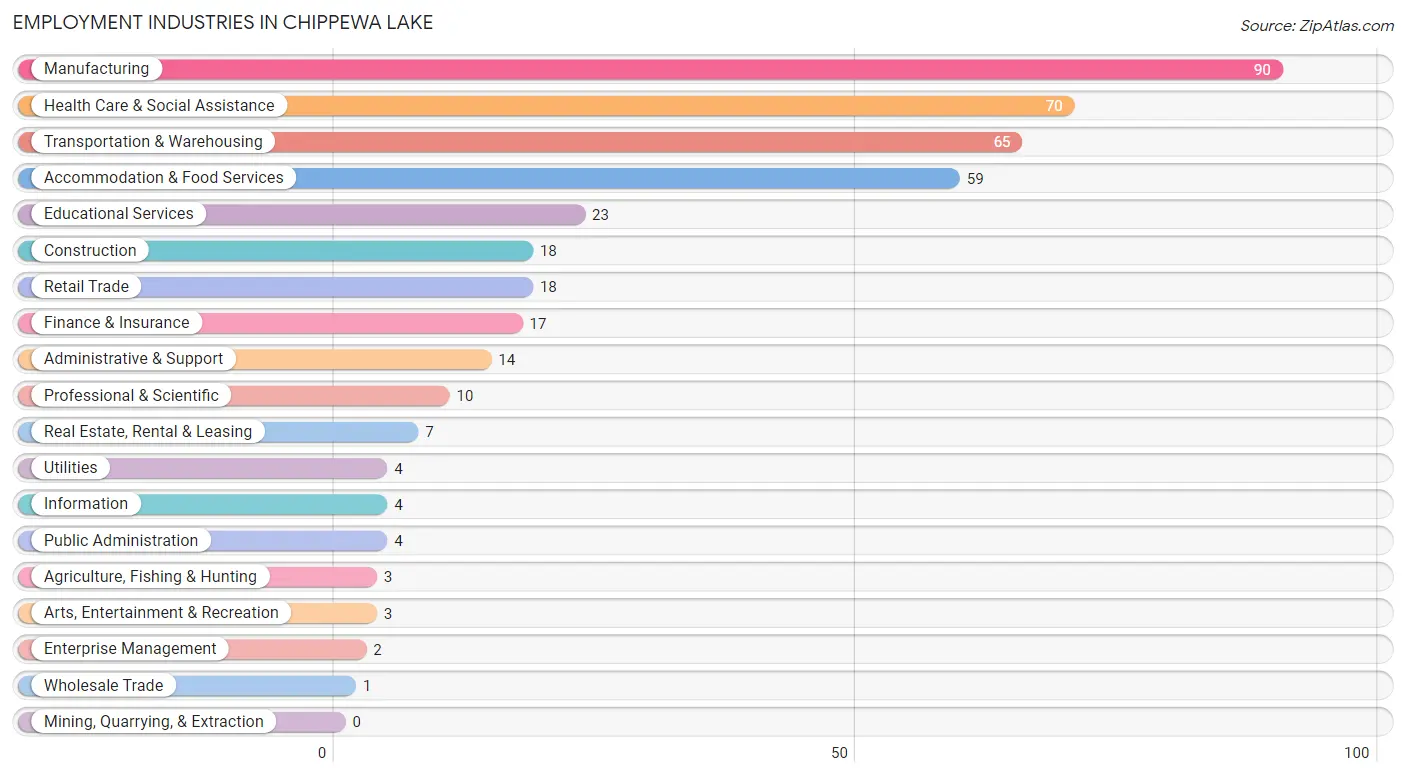
Employment Industries in Chippewa Lake
The major employment industries in Chippewa Lake include Manufacturing (90 | 20.7%), Health Care & Social Assistance (70 | 16.1%), Transportation & Warehousing (65 | 15.0%), Accommodation & Food Services (59 | 13.6%), and Educational Services (23 | 5.3%).
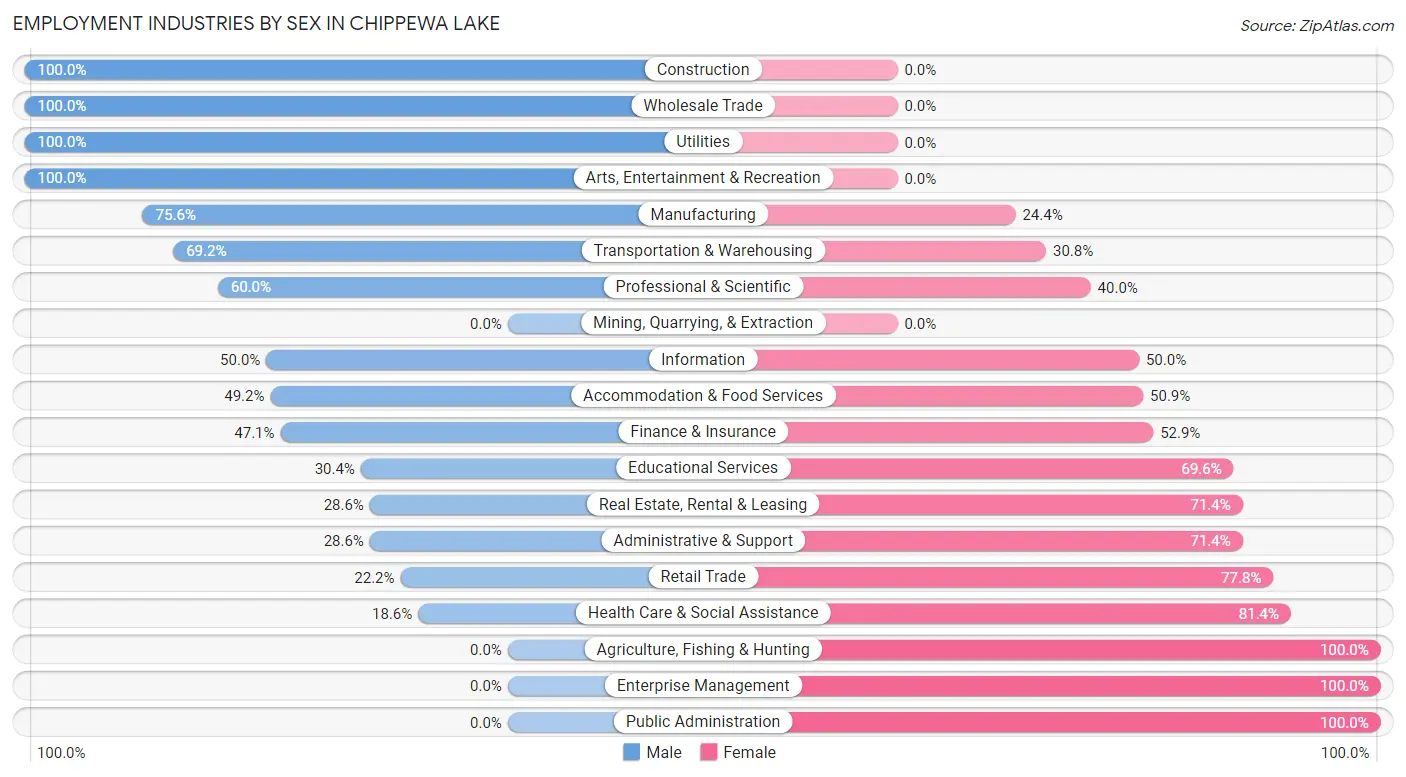
Employment Industries by Sex in Chippewa Lake
The Chippewa Lake industries that see more men than women are Construction (100.0%), Wholesale Trade (100.0%), and Utilities (100.0%), whereas the industries that tend to have a higher number of women are Agriculture, Fishing & Hunting (100.0%), Enterprise Management (100.0%), and Public Administration (100.0%).
| Industry | Male | Female |
| Agriculture, Fishing & Hunting | 0 (0.0%) | 3 (100.0%) |
| Mining, Quarrying, & Extraction | 0 (0.0%) | 0 (0.0%) |
| Construction | 18 (100.0%) | 0 (0.0%) |
| Manufacturing | 68 (75.6%) | 22 (24.4%) |
| Wholesale Trade | 1 (100.0%) | 0 (0.0%) |
| Retail Trade | 4 (22.2%) | 14 (77.8%) |
| Transportation & Warehousing | 45 (69.2%) | 20 (30.8%) |
| Utilities | 4 (100.0%) | 0 (0.0%) |
| Information | 2 (50.0%) | 2 (50.0%) |
| Finance & Insurance | 8 (47.1%) | 9 (52.9%) |
| Real Estate, Rental & Leasing | 2 (28.6%) | 5 (71.4%) |
| Professional & Scientific | 6 (60.0%) | 4 (40.0%) |
| Enterprise Management | 0 (0.0%) | 2 (100.0%) |
| Administrative & Support | 4 (28.6%) | 10 (71.4%) |
| Educational Services | 7 (30.4%) | 16 (69.6%) |
| Health Care & Social Assistance | 13 (18.6%) | 57 (81.4%) |
| Arts, Entertainment & Recreation | 3 (100.0%) | 0 (0.0%) |
| Accommodation & Food Services | 29 (49.1%) | 30 (50.8%) |
| Public Administration | 0 (0.0%) | 4 (100.0%) |
| Total | 224 (51.6%) | 210 (48.4%) |
Education in Chippewa Lake
School Enrollment in Chippewa Lake
The most common levels of schooling among the 115 students in Chippewa Lake are high school (44 | 38.3%), college / undergraduate (27 | 23.5%), and elementary school (16 | 13.9%).
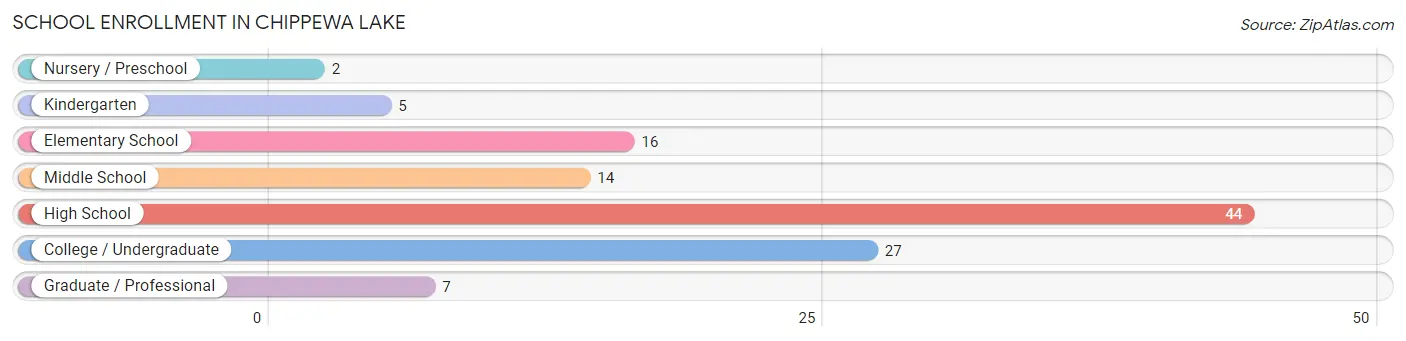
| School Level | # Students | % Students |
| Nursery / Preschool | 2 | 1.7% |
| Kindergarten | 5 | 4.3% |
| Elementary School | 16 | 13.9% |
| Middle School | 14 | 12.2% |
| High School | 44 | 38.3% |
| College / Undergraduate | 27 | 23.5% |
| Graduate / Professional | 7 | 6.1% |
| Total | 115 | 100.0% |
School Enrollment by Age by Funding Source in Chippewa Lake
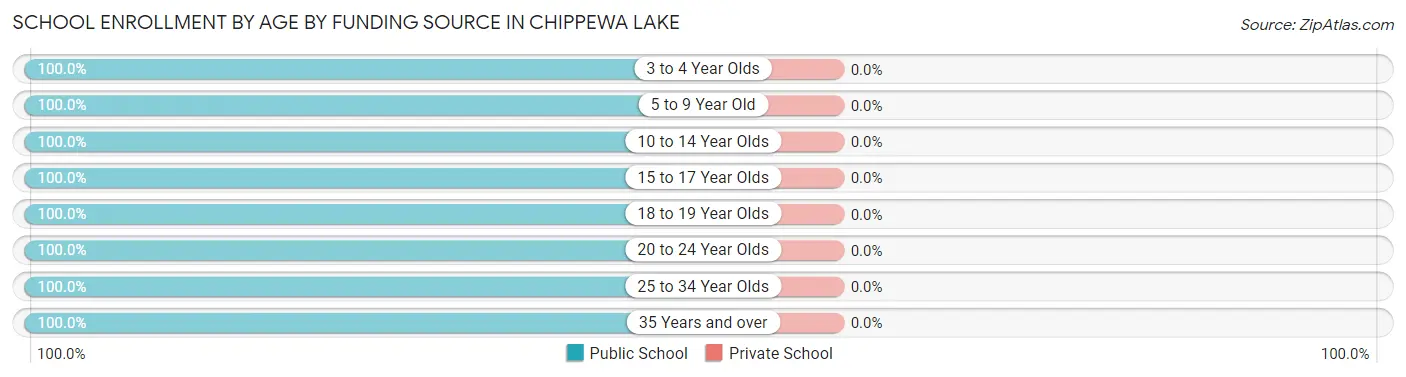
| Age Bracket | Public School | Private School |
| 3 to 4 Year Olds | 2 (100.0%) | 0 (0.0%) |
| 5 to 9 Year Old | 19 (100.0%) | 0 (0.0%) |
| 10 to 14 Year Olds | 22 (100.0%) | 0 (0.0%) |
| 15 to 17 Year Olds | 26 (100.0%) | 0 (0.0%) |
| 18 to 19 Year Olds | 12 (100.0%) | 0 (0.0%) |
| 20 to 24 Year Olds | 7 (100.0%) | 0 (0.0%) |
| 25 to 34 Year Olds | 14 (100.0%) | 0 (0.0%) |
| 35 Years and over | 13 (100.0%) | 0 (0.0%) |
| Total | 115 (100.0%) | 0 (0.0%) |
Educational Attainment by Field of Study in Chippewa Lake
Science & technology (37 | 28.5%), business (24 | 18.5%), education (22 | 16.9%), social sciences (13 | 10.0%), and arts & humanities (10 | 7.7%) are the most common fields of study among 130 individuals in Chippewa Lake who have obtained a bachelor's degree or higher.
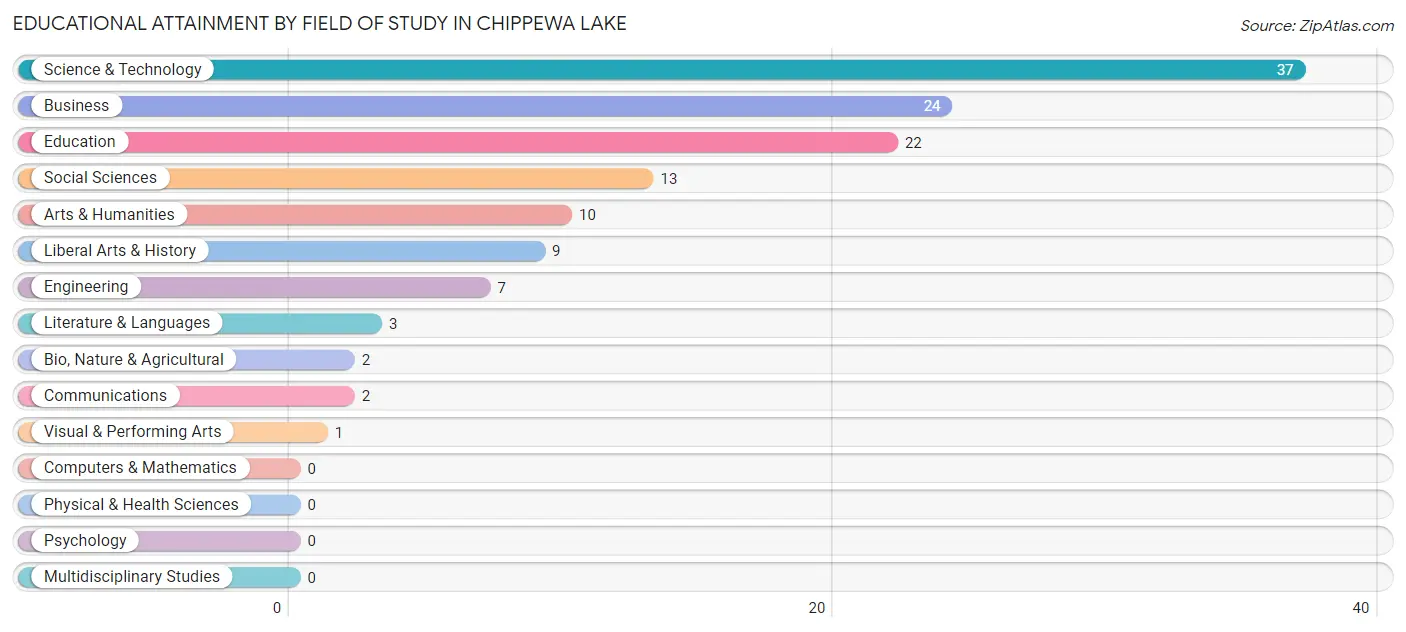
| Field of Study | # Graduates | % Graduates |
| Computers & Mathematics | 0 | 0.0% |
| Bio, Nature & Agricultural | 2 | 1.5% |
| Physical & Health Sciences | 0 | 0.0% |
| Psychology | 0 | 0.0% |
| Social Sciences | 13 | 10.0% |
| Engineering | 7 | 5.4% |
| Multidisciplinary Studies | 0 | 0.0% |
| Science & Technology | 37 | 28.5% |
| Business | 24 | 18.5% |
| Education | 22 | 16.9% |
| Literature & Languages | 3 | 2.3% |
| Liberal Arts & History | 9 | 6.9% |
| Visual & Performing Arts | 1 | 0.8% |
| Communications | 2 | 1.5% |
| Arts & Humanities | 10 | 7.7% |
| Total | 130 | 100.0% |
Transportation & Commute in Chippewa Lake
Vehicle Availability by Sex in Chippewa Lake
The most prevalent vehicle ownership categories in Chippewa Lake are males with 2 vehicles (95, accounting for 42.4%) and females with 2 vehicles (83, making up 47.0%).
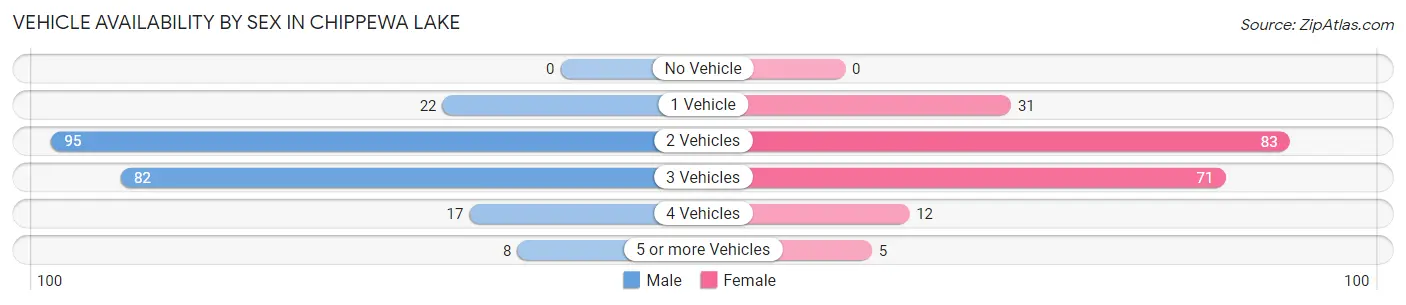
| Vehicles Available | Male | Female |
| No Vehicle | 0 (0.0%) | 0 (0.0%) |
| 1 Vehicle | 22 (9.8%) | 31 (15.3%) |
| 2 Vehicles | 95 (42.4%) | 83 (41.1%) |
| 3 Vehicles | 82 (36.6%) | 71 (35.1%) |
| 4 Vehicles | 17 (7.6%) | 12 (5.9%) |
| 5 or more Vehicles | 8 (3.6%) | 5 (2.5%) |
| Total | 224 (100.0%) | 202 (100.0%) |
Commute Time in Chippewa Lake
The most frequently occuring commute durations in Chippewa Lake are 45 to 59 minutes (67 commuters, 17.7%), 30 to 34 minutes (56 commuters, 14.8%), and 15 to 19 minutes (51 commuters, 13.5%).
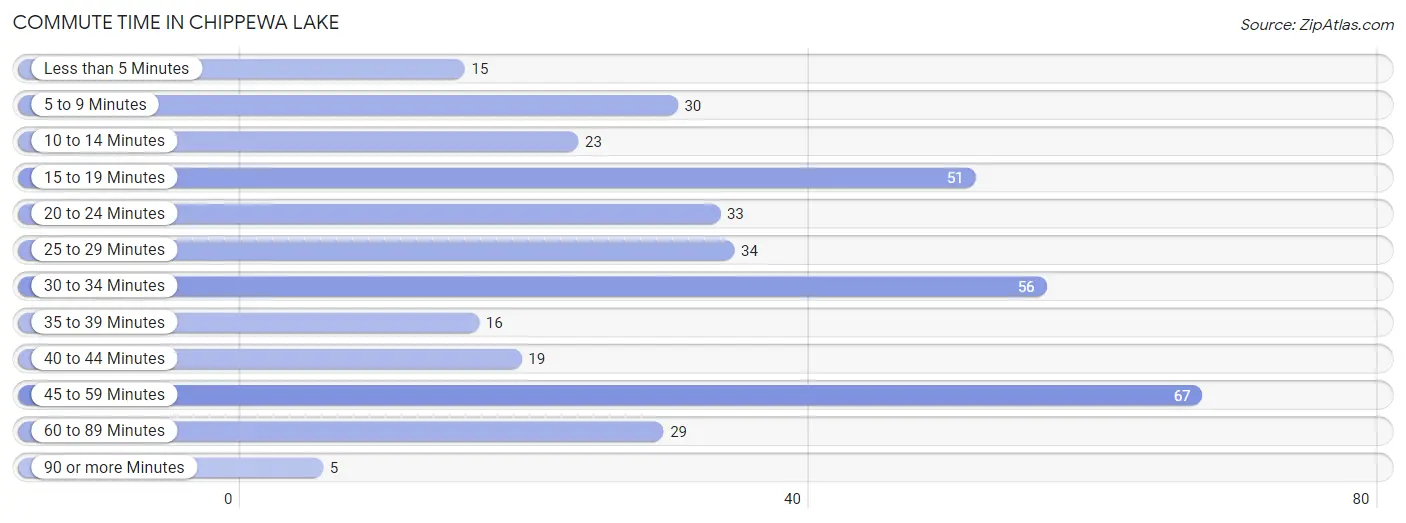
| Commute Time | # Commuters | % Commuters |
| Less than 5 Minutes | 15 | 4.0% |
| 5 to 9 Minutes | 30 | 7.9% |
| 10 to 14 Minutes | 23 | 6.1% |
| 15 to 19 Minutes | 51 | 13.5% |
| 20 to 24 Minutes | 33 | 8.7% |
| 25 to 29 Minutes | 34 | 9.0% |
| 30 to 34 Minutes | 56 | 14.8% |
| 35 to 39 Minutes | 16 | 4.2% |
| 40 to 44 Minutes | 19 | 5.0% |
| 45 to 59 Minutes | 67 | 17.7% |
| 60 to 89 Minutes | 29 | 7.7% |
| 90 or more Minutes | 5 | 1.3% |
Commute Time by Sex in Chippewa Lake
The most common commute times in Chippewa Lake are 45 to 59 minutes (50 commuters, 23.2%) for males and 15 to 19 minutes (33 commuters, 20.4%) for females.
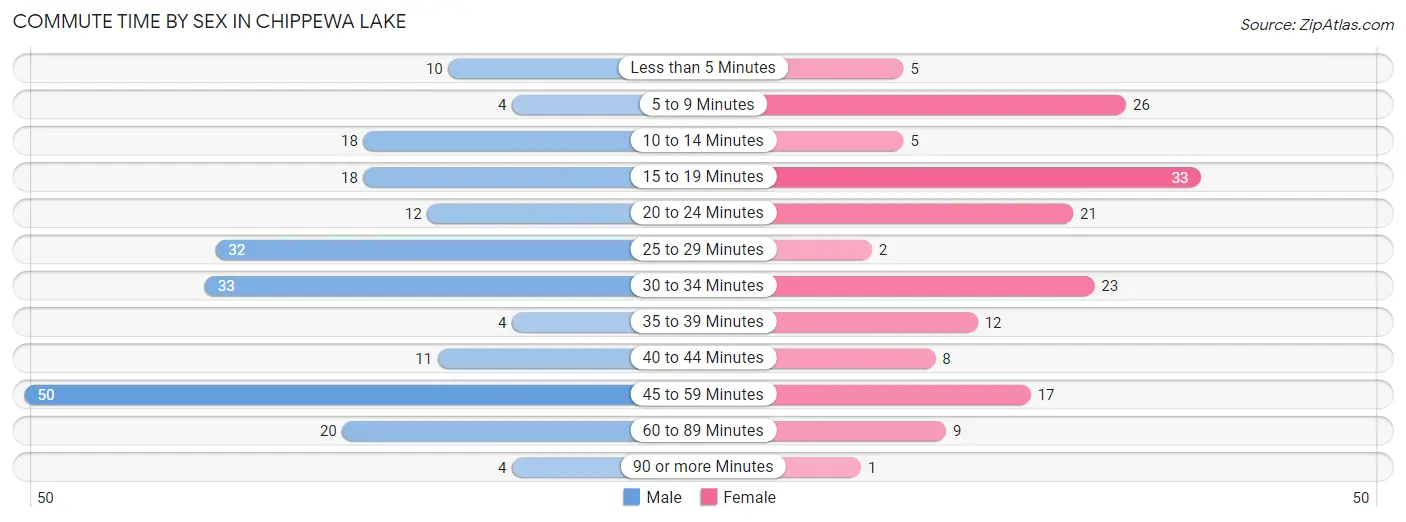
| Commute Time | Male | Female |
| Less than 5 Minutes | 10 (4.6%) | 5 (3.1%) |
| 5 to 9 Minutes | 4 (1.8%) | 26 (16.1%) |
| 10 to 14 Minutes | 18 (8.3%) | 5 (3.1%) |
| 15 to 19 Minutes | 18 (8.3%) | 33 (20.4%) |
| 20 to 24 Minutes | 12 (5.6%) | 21 (13.0%) |
| 25 to 29 Minutes | 32 (14.8%) | 2 (1.2%) |
| 30 to 34 Minutes | 33 (15.3%) | 23 (14.2%) |
| 35 to 39 Minutes | 4 (1.8%) | 12 (7.4%) |
| 40 to 44 Minutes | 11 (5.1%) | 8 (4.9%) |
| 45 to 59 Minutes | 50 (23.2%) | 17 (10.5%) |
| 60 to 89 Minutes | 20 (9.3%) | 9 (5.6%) |
| 90 or more Minutes | 4 (1.8%) | 1 (0.6%) |
Time of Departure to Work by Sex in Chippewa Lake
The most frequent times of departure to work in Chippewa Lake are 7:00 AM to 7:29 AM (45, 20.8%) for males and 7:30 AM to 7:59 AM (36, 22.2%) for females.
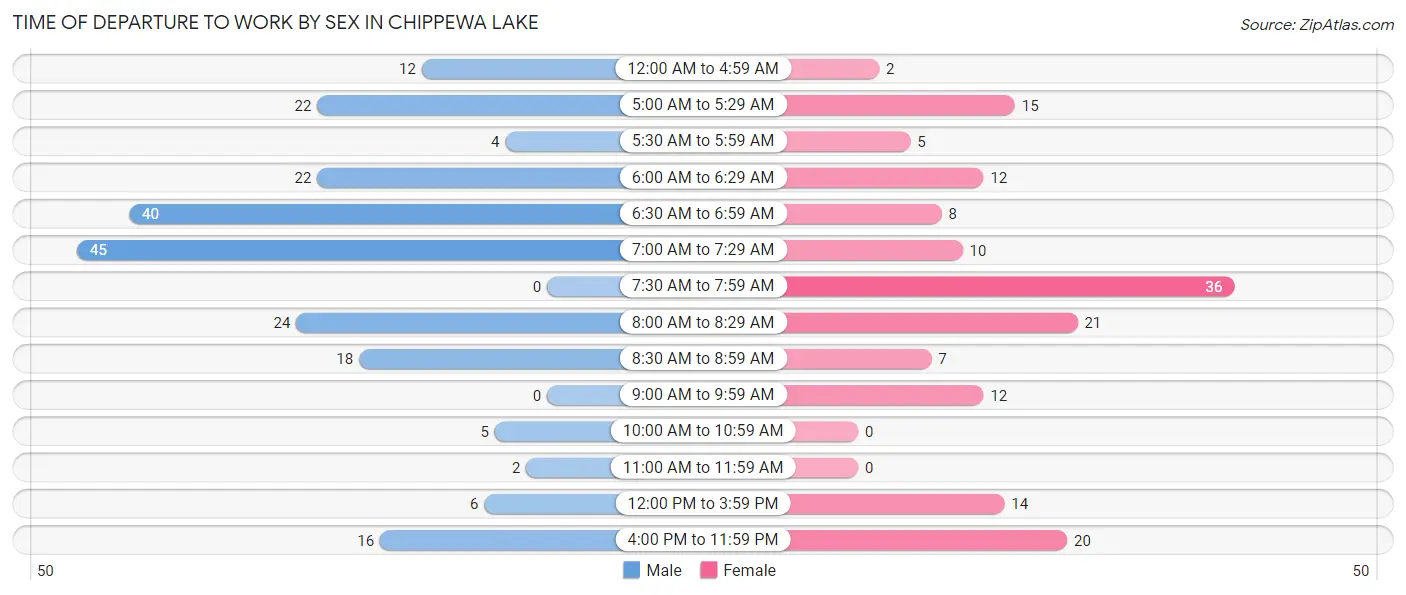
| Time of Departure | Male | Female |
| 12:00 AM to 4:59 AM | 12 (5.6%) | 2 (1.2%) |
| 5:00 AM to 5:29 AM | 22 (10.2%) | 15 (9.3%) |
| 5:30 AM to 5:59 AM | 4 (1.8%) | 5 (3.1%) |
| 6:00 AM to 6:29 AM | 22 (10.2%) | 12 (7.4%) |
| 6:30 AM to 6:59 AM | 40 (18.5%) | 8 (4.9%) |
| 7:00 AM to 7:29 AM | 45 (20.8%) | 10 (6.2%) |
| 7:30 AM to 7:59 AM | 0 (0.0%) | 36 (22.2%) |
| 8:00 AM to 8:29 AM | 24 (11.1%) | 21 (13.0%) |
| 8:30 AM to 8:59 AM | 18 (8.3%) | 7 (4.3%) |
| 9:00 AM to 9:59 AM | 0 (0.0%) | 12 (7.4%) |
| 10:00 AM to 10:59 AM | 5 (2.3%) | 0 (0.0%) |
| 11:00 AM to 11:59 AM | 2 (0.9%) | 0 (0.0%) |
| 12:00 PM to 3:59 PM | 6 (2.8%) | 14 (8.6%) |
| 4:00 PM to 11:59 PM | 16 (7.4%) | 20 (12.3%) |
| Total | 216 (100.0%) | 162 (100.0%) |
Housing Occupancy in Chippewa Lake
Occupancy by Ownership in Chippewa Lake
Of the total 320 dwellings in Chippewa Lake, owner-occupied units account for 253 (79.1%), while renter-occupied units make up 67 (20.9%).
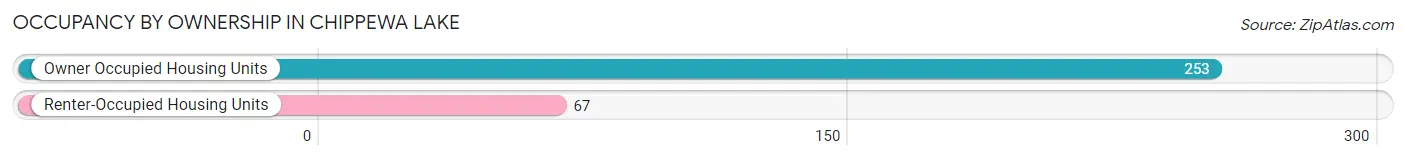
| Occupancy | # Housing Units | % Housing Units |
| Owner Occupied Housing Units | 253 | 79.1% |
| Renter-Occupied Housing Units | 67 | 20.9% |
| Total Occupied Housing Units | 320 | 100.0% |
Occupancy by Household Size in Chippewa Lake
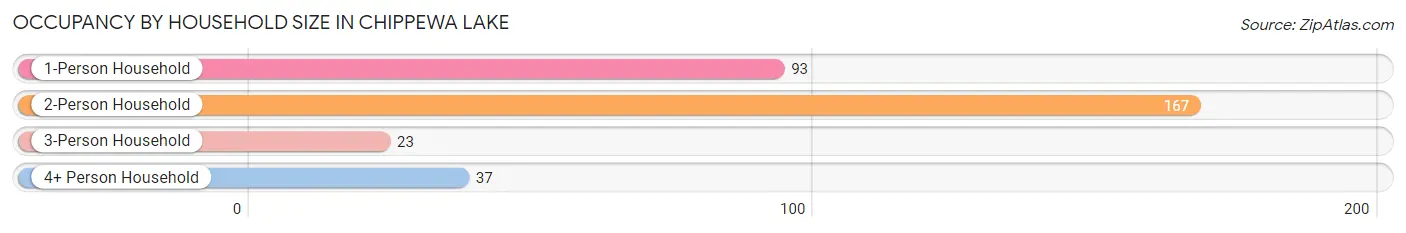
| Household Size | # Housing Units | % Housing Units |
| 1-Person Household | 93 | 29.1% |
| 2-Person Household | 167 | 52.2% |
| 3-Person Household | 23 | 7.2% |
| 4+ Person Household | 37 | 11.6% |
| Total Housing Units | 320 | 100.0% |
Occupancy by Ownership by Household Size in Chippewa Lake
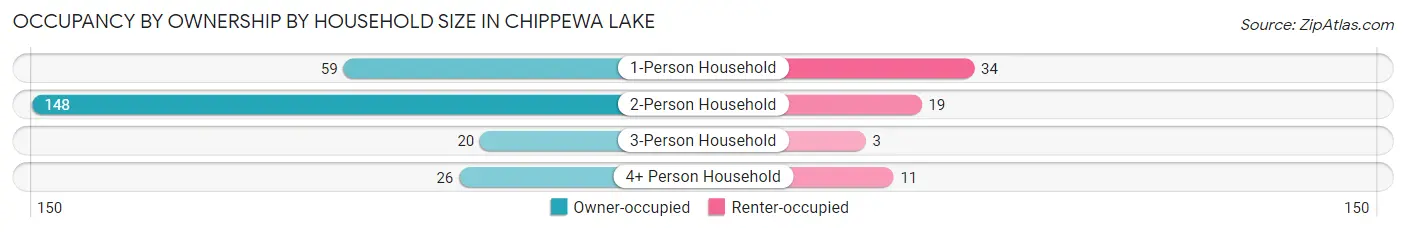
| Household Size | Owner-occupied | Renter-occupied |
| 1-Person Household | 59 (63.4%) | 34 (36.6%) |
| 2-Person Household | 148 (88.6%) | 19 (11.4%) |
| 3-Person Household | 20 (87.0%) | 3 (13.0%) |
| 4+ Person Household | 26 (70.3%) | 11 (29.7%) |
| Total Housing Units | 253 (79.1%) | 67 (20.9%) |
Occupancy by Educational Attainment in Chippewa Lake
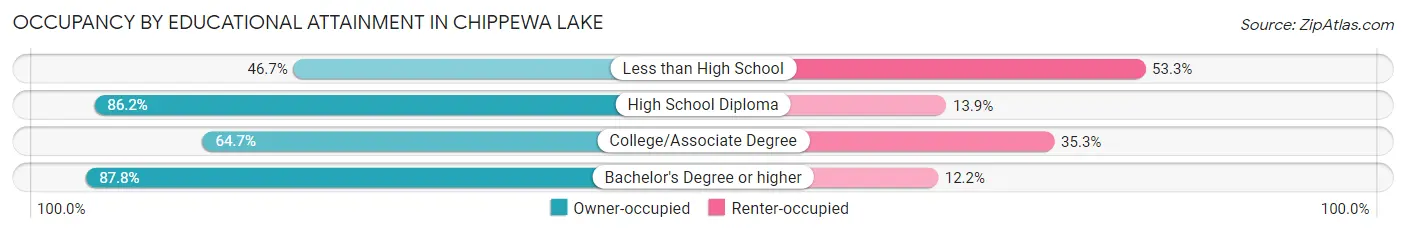
| Household Size | Owner-occupied | Renter-occupied |
| Less than High School | 7 (46.7%) | 8 (53.3%) |
| High School Diploma | 112 (86.2%) | 18 (13.9%) |
| College/Associate Degree | 55 (64.7%) | 30 (35.3%) |
| Bachelor's Degree or higher | 79 (87.8%) | 11 (12.2%) |
Occupancy by Age of Householder in Chippewa Lake
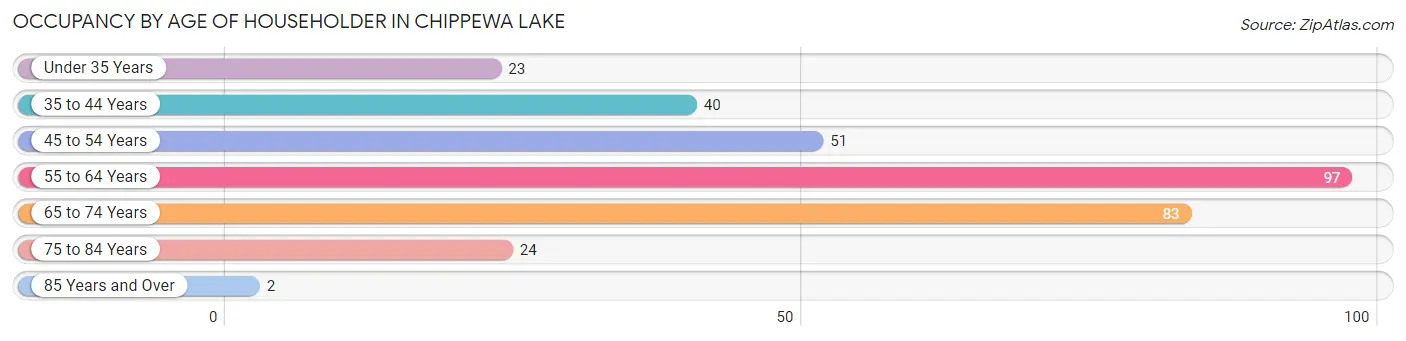
| Age Bracket | # Households | % Households |
| Under 35 Years | 23 | 7.2% |
| 35 to 44 Years | 40 | 12.5% |
| 45 to 54 Years | 51 | 15.9% |
| 55 to 64 Years | 97 | 30.3% |
| 65 to 74 Years | 83 | 25.9% |
| 75 to 84 Years | 24 | 7.5% |
| 85 Years and Over | 2 | 0.6% |
| Total | 320 | 100.0% |
Housing Finances in Chippewa Lake
Median Income by Occupancy in Chippewa Lake
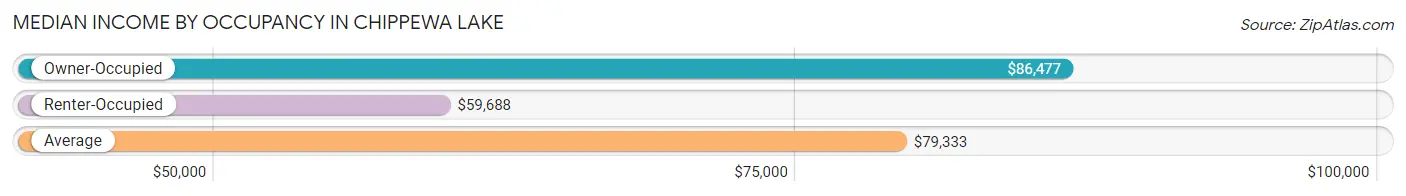
| Occupancy Type | # Households | Median Income |
| Owner-Occupied | 253 (79.1%) | $86,477 |
| Renter-Occupied | 67 (20.9%) | $59,688 |
| Average | 320 (100.0%) | $79,333 |
Occupancy by Householder Income Bracket in Chippewa Lake
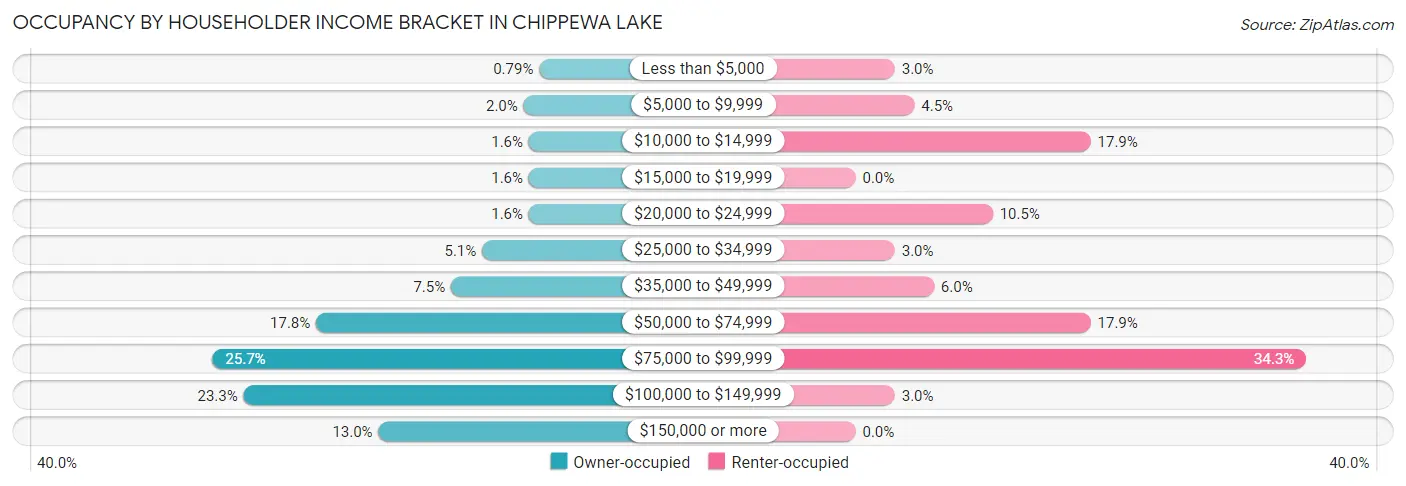
| Income Bracket | Owner-occupied | Renter-occupied |
| Less than $5,000 | 2 (0.8%) | 2 (3.0%) |
| $5,000 to $9,999 | 5 (2.0%) | 3 (4.5%) |
| $10,000 to $14,999 | 4 (1.6%) | 12 (17.9%) |
| $15,000 to $19,999 | 4 (1.6%) | 0 (0.0%) |
| $20,000 to $24,999 | 4 (1.6%) | 7 (10.4%) |
| $25,000 to $34,999 | 13 (5.1%) | 2 (3.0%) |
| $35,000 to $49,999 | 19 (7.5%) | 4 (6.0%) |
| $50,000 to $74,999 | 45 (17.8%) | 12 (17.9%) |
| $75,000 to $99,999 | 65 (25.7%) | 23 (34.3%) |
| $100,000 to $149,999 | 59 (23.3%) | 2 (3.0%) |
| $150,000 or more | 33 (13.0%) | 0 (0.0%) |
| Total | 253 (100.0%) | 67 (100.0%) |
Monthly Housing Cost Tiers in Chippewa Lake
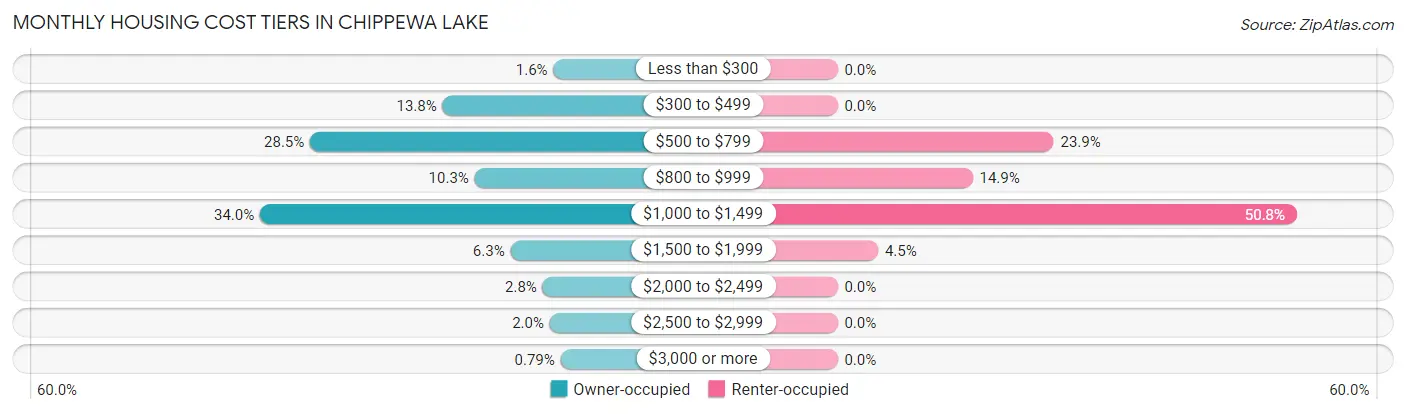
| Monthly Cost | Owner-occupied | Renter-occupied |
| Less than $300 | 4 (1.6%) | 0 (0.0%) |
| $300 to $499 | 35 (13.8%) | 0 (0.0%) |
| $500 to $799 | 72 (28.5%) | 16 (23.9%) |
| $800 to $999 | 26 (10.3%) | 10 (14.9%) |
| $1,000 to $1,499 | 86 (34.0%) | 34 (50.7%) |
| $1,500 to $1,999 | 16 (6.3%) | 3 (4.5%) |
| $2,000 to $2,499 | 7 (2.8%) | 0 (0.0%) |
| $2,500 to $2,999 | 5 (2.0%) | 0 (0.0%) |
| $3,000 or more | 2 (0.8%) | 0 (0.0%) |
| Total | 253 (100.0%) | 67 (100.0%) |
Physical Housing Characteristics in Chippewa Lake
Housing Structures in Chippewa Lake
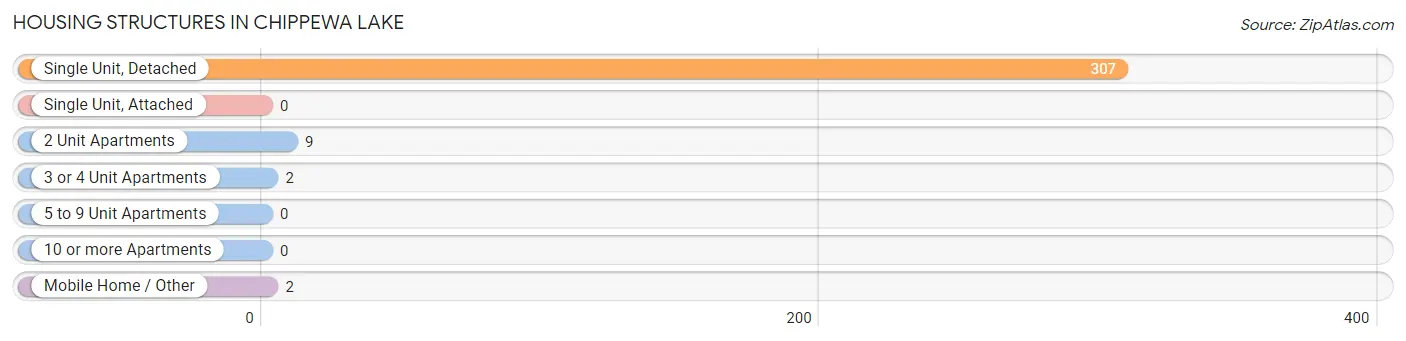
| Structure Type | # Housing Units | % Housing Units |
| Single Unit, Detached | 307 | 95.9% |
| Single Unit, Attached | 0 | 0.0% |
| 2 Unit Apartments | 9 | 2.8% |
| 3 or 4 Unit Apartments | 2 | 0.6% |
| 5 to 9 Unit Apartments | 0 | 0.0% |
| 10 or more Apartments | 0 | 0.0% |
| Mobile Home / Other | 2 | 0.6% |
| Total | 320 | 100.0% |
Housing Structures by Occupancy in Chippewa Lake
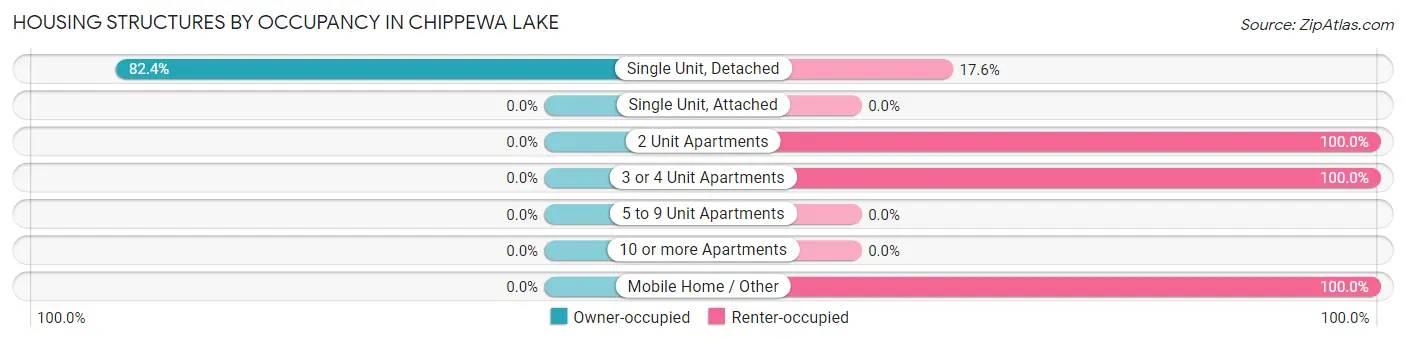
| Structure Type | Owner-occupied | Renter-occupied |
| Single Unit, Detached | 253 (82.4%) | 54 (17.6%) |
| Single Unit, Attached | 0 (0.0%) | 0 (0.0%) |
| 2 Unit Apartments | 0 (0.0%) | 9 (100.0%) |
| 3 or 4 Unit Apartments | 0 (0.0%) | 2 (100.0%) |
| 5 to 9 Unit Apartments | 0 (0.0%) | 0 (0.0%) |
| 10 or more Apartments | 0 (0.0%) | 0 (0.0%) |
| Mobile Home / Other | 0 (0.0%) | 2 (100.0%) |
| Total | 253 (79.1%) | 67 (20.9%) |
Housing Structures by Number of Rooms in Chippewa Lake
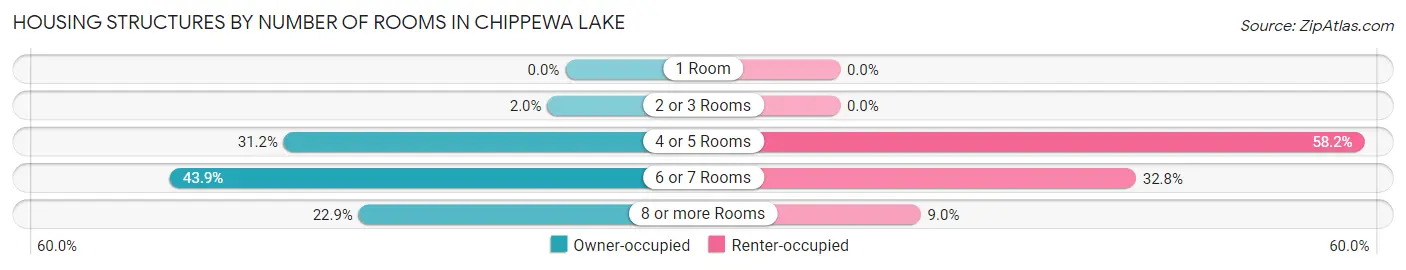
| Number of Rooms | Owner-occupied | Renter-occupied |
| 1 Room | 0 (0.0%) | 0 (0.0%) |
| 2 or 3 Rooms | 5 (2.0%) | 0 (0.0%) |
| 4 or 5 Rooms | 79 (31.2%) | 39 (58.2%) |
| 6 or 7 Rooms | 111 (43.9%) | 22 (32.8%) |
| 8 or more Rooms | 58 (22.9%) | 6 (9.0%) |
| Total | 253 (100.0%) | 67 (100.0%) |
Housing Structure by Heating Type in Chippewa Lake
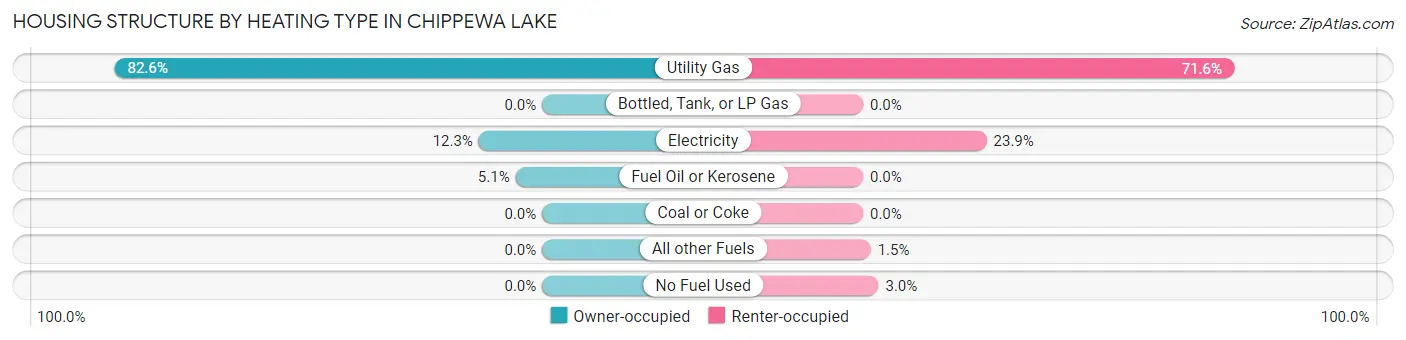
| Heating Type | Owner-occupied | Renter-occupied |
| Utility Gas | 209 (82.6%) | 48 (71.6%) |
| Bottled, Tank, or LP Gas | 0 (0.0%) | 0 (0.0%) |
| Electricity | 31 (12.2%) | 16 (23.9%) |
| Fuel Oil or Kerosene | 13 (5.1%) | 0 (0.0%) |
| Coal or Coke | 0 (0.0%) | 0 (0.0%) |
| All other Fuels | 0 (0.0%) | 1 (1.5%) |
| No Fuel Used | 0 (0.0%) | 2 (3.0%) |
| Total | 253 (100.0%) | 67 (100.0%) |
Household Vehicle Usage in Chippewa Lake
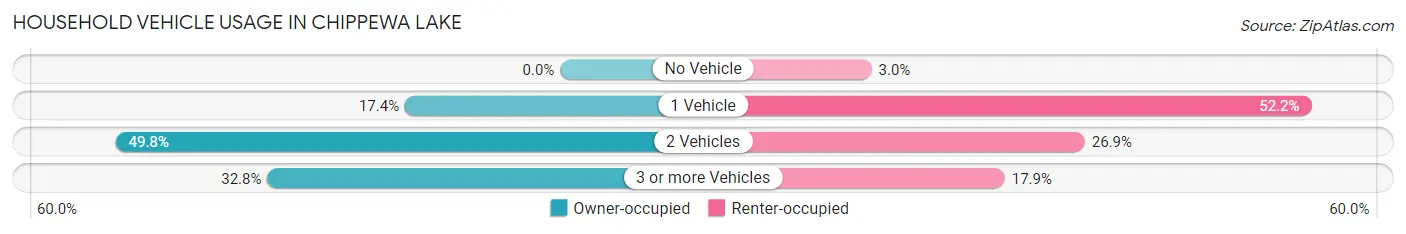
| Vehicles per Household | Owner-occupied | Renter-occupied |
| No Vehicle | 0 (0.0%) | 2 (3.0%) |
| 1 Vehicle | 44 (17.4%) | 35 (52.2%) |
| 2 Vehicles | 126 (49.8%) | 18 (26.9%) |
| 3 or more Vehicles | 83 (32.8%) | 12 (17.9%) |
| Total | 253 (100.0%) | 67 (100.0%) |
Real Estate & Mortgages in Chippewa Lake
Real Estate and Mortgage Overview in Chippewa Lake
| Characteristic | Without Mortgage | With Mortgage |
| Housing Units | 95 | 158 |
| Median Property Value | $193,100 | $148,800 |
| Median Household Income | $56,125 | $28 |
| Monthly Housing Costs | $538 | $2 |
| Real Estate Taxes | $2,478 | $0 |
Property Value by Mortgage Status in Chippewa Lake
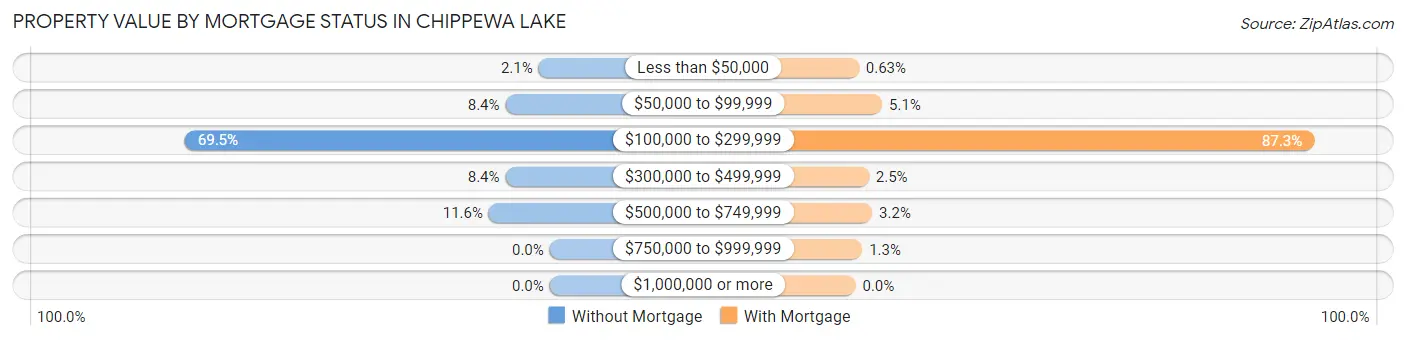
| Property Value | Without Mortgage | With Mortgage |
| Less than $50,000 | 2 (2.1%) | 1 (0.6%) |
| $50,000 to $99,999 | 8 (8.4%) | 8 (5.1%) |
| $100,000 to $299,999 | 66 (69.5%) | 138 (87.3%) |
| $300,000 to $499,999 | 8 (8.4%) | 4 (2.5%) |
| $500,000 to $749,999 | 11 (11.6%) | 5 (3.2%) |
| $750,000 to $999,999 | 0 (0.0%) | 2 (1.3%) |
| $1,000,000 or more | 0 (0.0%) | 0 (0.0%) |
| Total | 95 (100.0%) | 158 (100.0%) |
Household Income by Mortgage Status in Chippewa Lake
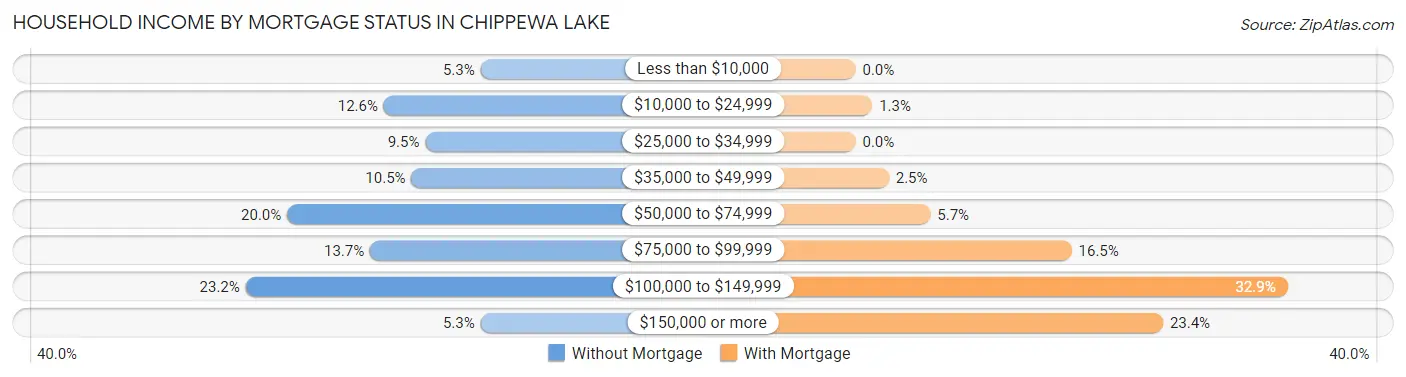
| Household Income | Without Mortgage | With Mortgage |
| Less than $10,000 | 5 (5.3%) | 0 (0.0%) |
| $10,000 to $24,999 | 12 (12.6%) | 2 (1.3%) |
| $25,000 to $34,999 | 9 (9.5%) | 0 (0.0%) |
| $35,000 to $49,999 | 10 (10.5%) | 4 (2.5%) |
| $50,000 to $74,999 | 19 (20.0%) | 9 (5.7%) |
| $75,000 to $99,999 | 13 (13.7%) | 26 (16.5%) |
| $100,000 to $149,999 | 22 (23.2%) | 52 (32.9%) |
| $150,000 or more | 5 (5.3%) | 37 (23.4%) |
| Total | 95 (100.0%) | 158 (100.0%) |
Property Value to Household Income Ratio in Chippewa Lake
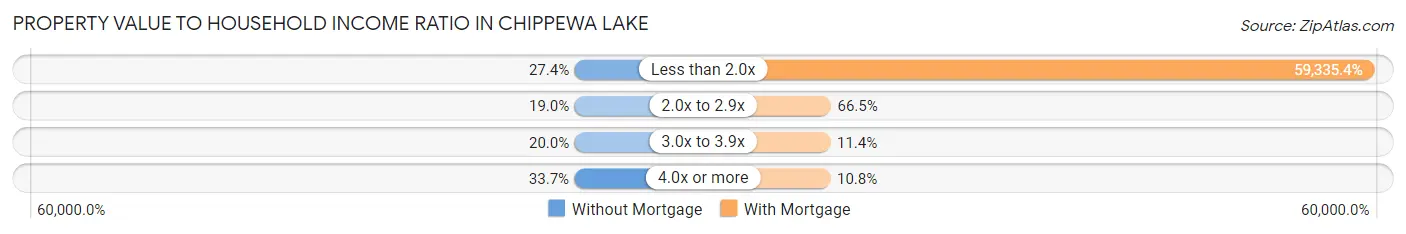
| Value-to-Income Ratio | Without Mortgage | With Mortgage |
| Less than 2.0x | 26 (27.4%) | 93,750 (59,335.4%) |
| 2.0x to 2.9x | 18 (19.0%) | 105 (66.5%) |
| 3.0x to 3.9x | 19 (20.0%) | 18 (11.4%) |
| 4.0x or more | 32 (33.7%) | 17 (10.8%) |
| Total | 95 (100.0%) | 158 (100.0%) |
Real Estate Taxes by Mortgage Status in Chippewa Lake
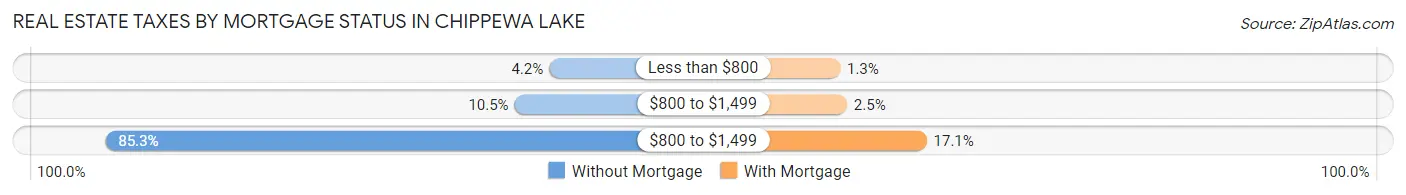
| Property Taxes | Without Mortgage | With Mortgage |
| Less than $800 | 4 (4.2%) | 2 (1.3%) |
| $800 to $1,499 | 10 (10.5%) | 4 (2.5%) |
| $800 to $1,499 | 81 (85.3%) | 27 (17.1%) |
| Total | 95 (100.0%) | 158 (100.0%) |
Health & Disability in Chippewa Lake
Health Insurance Coverage by Age in Chippewa Lake
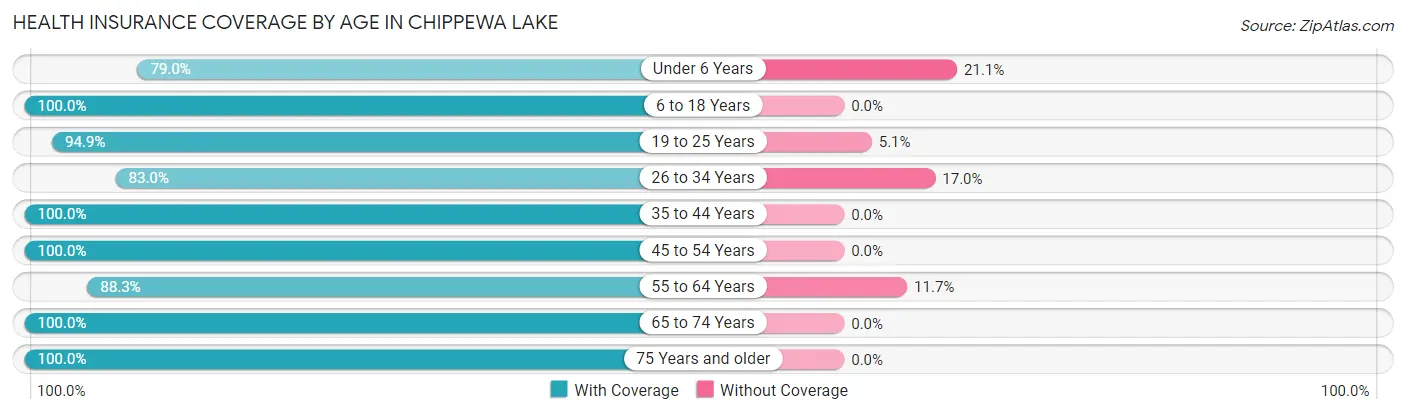
| Age Bracket | With Coverage | Without Coverage |
| Under 6 Years | 15 (78.9%) | 4 (21.0%) |
| 6 to 18 Years | 76 (100.0%) | 0 (0.0%) |
| 19 to 25 Years | 37 (94.9%) | 2 (5.1%) |
| 26 to 34 Years | 44 (83.0%) | 9 (17.0%) |
| 35 to 44 Years | 59 (100.0%) | 0 (0.0%) |
| 45 to 54 Years | 125 (100.0%) | 0 (0.0%) |
| 55 to 64 Years | 128 (88.3%) | 17 (11.7%) |
| 65 to 74 Years | 129 (100.0%) | 0 (0.0%) |
| 75 Years and older | 59 (100.0%) | 0 (0.0%) |
| Total | 672 (95.5%) | 32 (4.5%) |
Health Insurance Coverage by Citizenship Status in Chippewa Lake
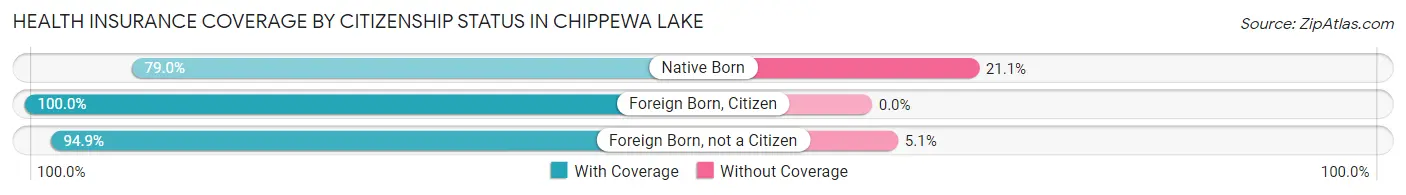
| Citizenship Status | With Coverage | Without Coverage |
| Native Born | 15 (78.9%) | 4 (21.0%) |
| Foreign Born, Citizen | 76 (100.0%) | 0 (0.0%) |
| Foreign Born, not a Citizen | 37 (94.9%) | 2 (5.1%) |
Health Insurance Coverage by Household Income in Chippewa Lake
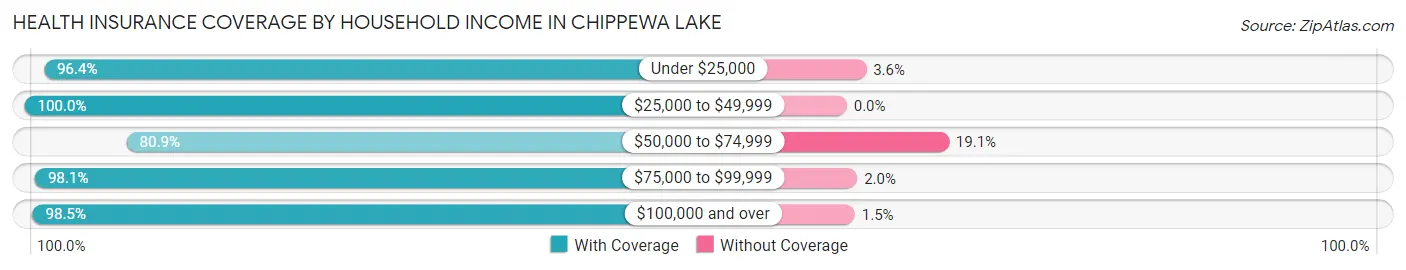
| Household Income | With Coverage | Without Coverage |
| Under $25,000 | 53 (96.4%) | 2 (3.6%) |
| $25,000 to $49,999 | 64 (100.0%) | 0 (0.0%) |
| $50,000 to $74,999 | 93 (80.9%) | 22 (19.1%) |
| $75,000 to $99,999 | 201 (98.1%) | 4 (1.9%) |
| $100,000 and over | 261 (98.5%) | 4 (1.5%) |
Public vs Private Health Insurance Coverage by Age in Chippewa Lake
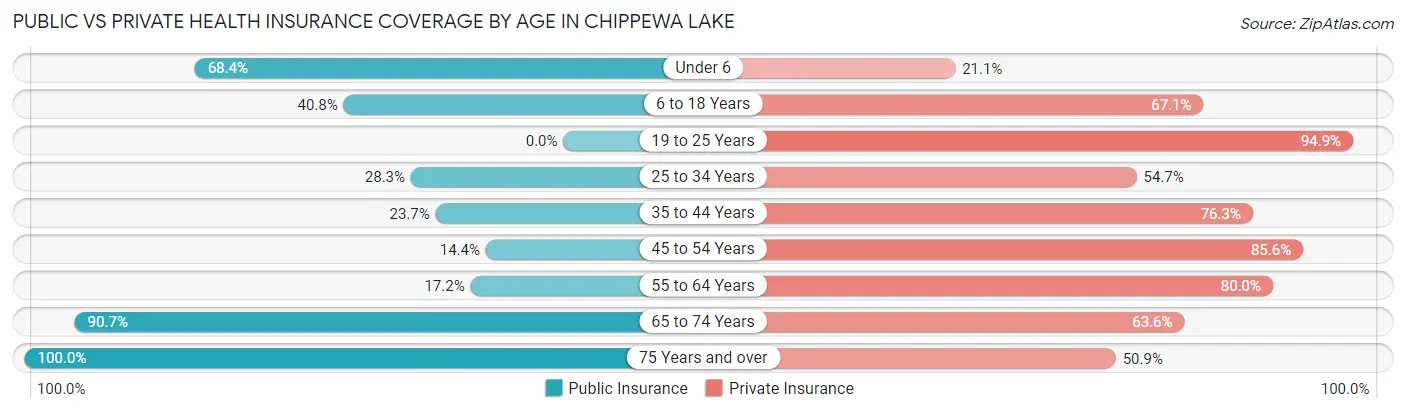
| Age Bracket | Public Insurance | Private Insurance |
| Under 6 | 13 (68.4%) | 4 (21.0%) |
| 6 to 18 Years | 31 (40.8%) | 51 (67.1%) |
| 19 to 25 Years | 0 (0.0%) | 37 (94.9%) |
| 25 to 34 Years | 15 (28.3%) | 29 (54.7%) |
| 35 to 44 Years | 14 (23.7%) | 45 (76.3%) |
| 45 to 54 Years | 18 (14.4%) | 107 (85.6%) |
| 55 to 64 Years | 25 (17.2%) | 116 (80.0%) |
| 65 to 74 Years | 117 (90.7%) | 82 (63.6%) |
| 75 Years and over | 59 (100.0%) | 30 (50.8%) |
| Total | 292 (41.5%) | 501 (71.2%) |
Disability Status by Sex by Age in Chippewa Lake
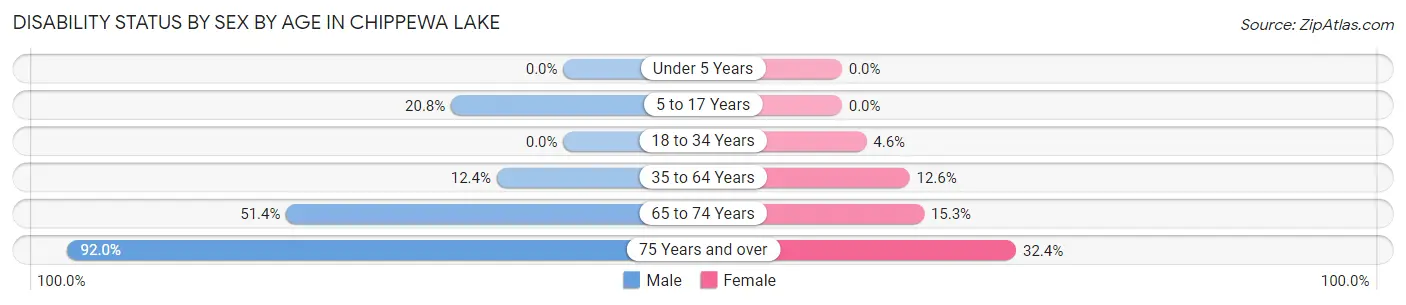
| Age Bracket | Male | Female |
| Under 5 Years | 0 (0.0%) | 0 (0.0%) |
| 5 to 17 Years | 5 (20.8%) | 0 (0.0%) |
| 18 to 34 Years | 0 (0.0%) | 2 (4.5%) |
| 35 to 64 Years | 22 (12.4%) | 19 (12.6%) |
| 65 to 74 Years | 36 (51.4%) | 9 (15.2%) |
| 75 Years and over | 23 (92.0%) | 11 (32.4%) |
Disability Class by Sex by Age in Chippewa Lake
Disability Class: Hearing Difficulty
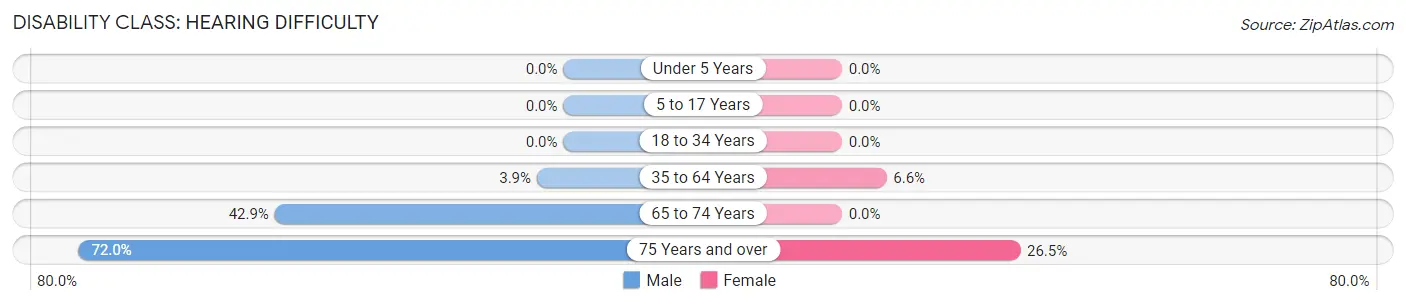
| Age Bracket | Male | Female |
| Under 5 Years | 0 (0.0%) | 0 (0.0%) |
| 5 to 17 Years | 0 (0.0%) | 0 (0.0%) |
| 18 to 34 Years | 0 (0.0%) | 0 (0.0%) |
| 35 to 64 Years | 7 (3.9%) | 10 (6.6%) |
| 65 to 74 Years | 30 (42.9%) | 0 (0.0%) |
| 75 Years and over | 18 (72.0%) | 9 (26.5%) |
Disability Class: Vision Difficulty
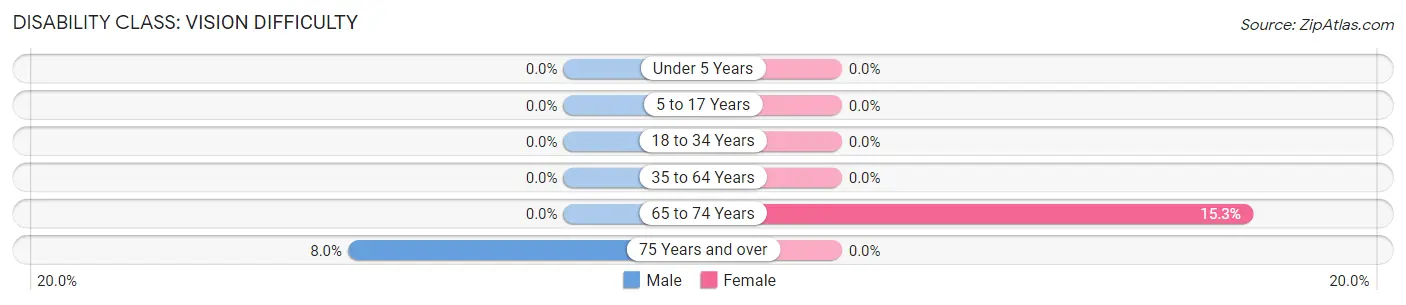
| Age Bracket | Male | Female |
| Under 5 Years | 0 (0.0%) | 0 (0.0%) |
| 5 to 17 Years | 0 (0.0%) | 0 (0.0%) |
| 18 to 34 Years | 0 (0.0%) | 0 (0.0%) |
| 35 to 64 Years | 0 (0.0%) | 0 (0.0%) |
| 65 to 74 Years | 0 (0.0%) | 9 (15.2%) |
| 75 Years and over | 2 (8.0%) | 0 (0.0%) |
Disability Class: Cognitive Difficulty
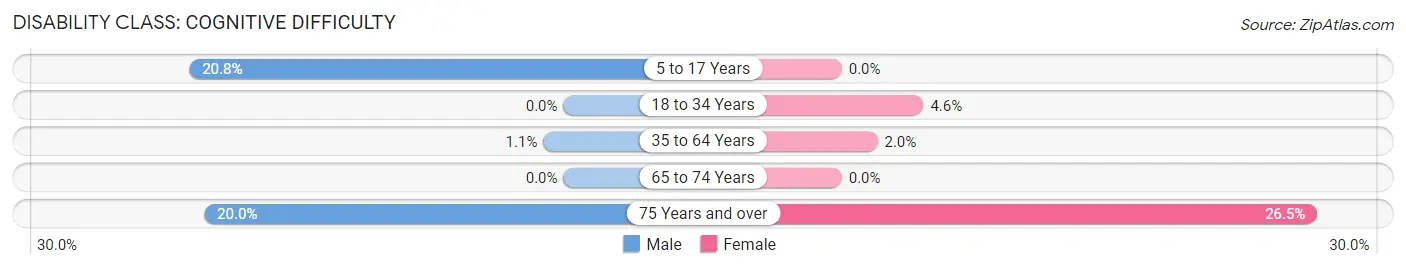
| Age Bracket | Male | Female |
| 5 to 17 Years | 5 (20.8%) | 0 (0.0%) |
| 18 to 34 Years | 0 (0.0%) | 2 (4.5%) |
| 35 to 64 Years | 2 (1.1%) | 3 (2.0%) |
| 65 to 74 Years | 0 (0.0%) | 0 (0.0%) |
| 75 Years and over | 5 (20.0%) | 9 (26.5%) |
Disability Class: Ambulatory Difficulty
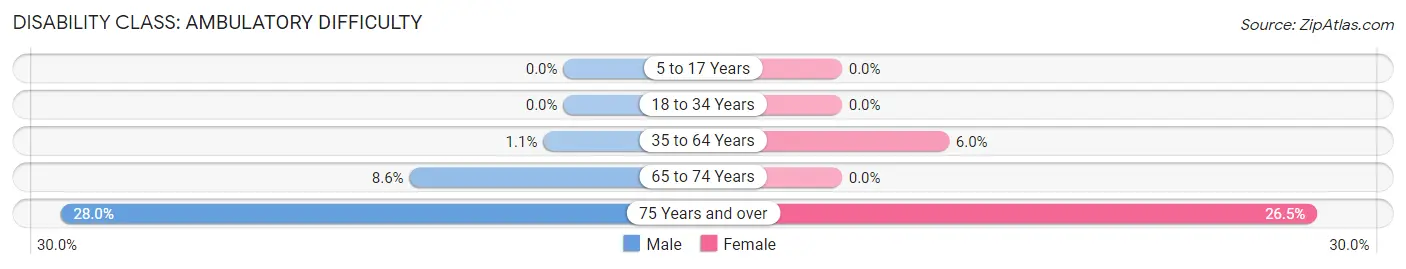
| Age Bracket | Male | Female |
| 5 to 17 Years | 0 (0.0%) | 0 (0.0%) |
| 18 to 34 Years | 0 (0.0%) | 0 (0.0%) |
| 35 to 64 Years | 2 (1.1%) | 9 (6.0%) |
| 65 to 74 Years | 6 (8.6%) | 0 (0.0%) |
| 75 Years and over | 7 (28.0%) | 9 (26.5%) |
Disability Class: Self-Care Difficulty
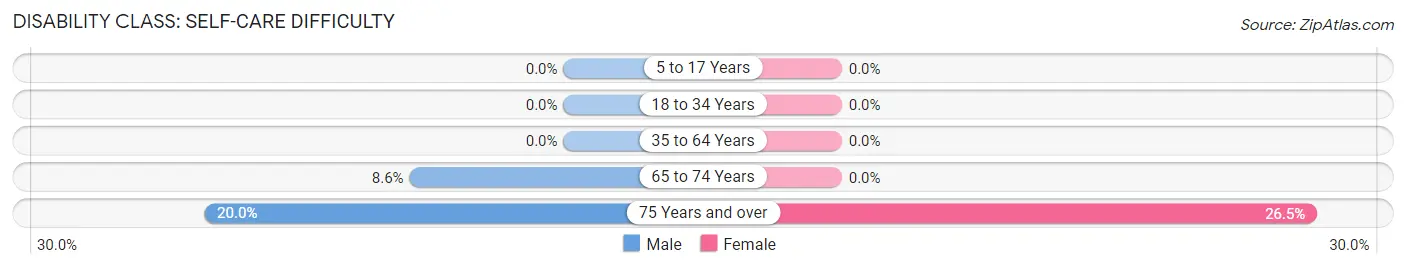
| Age Bracket | Male | Female |
| 5 to 17 Years | 0 (0.0%) | 0 (0.0%) |
| 18 to 34 Years | 0 (0.0%) | 0 (0.0%) |
| 35 to 64 Years | 0 (0.0%) | 0 (0.0%) |
| 65 to 74 Years | 6 (8.6%) | 0 (0.0%) |
| 75 Years and over | 5 (20.0%) | 9 (26.5%) |
Technology Access in Chippewa Lake
Computing Device Access in Chippewa Lake
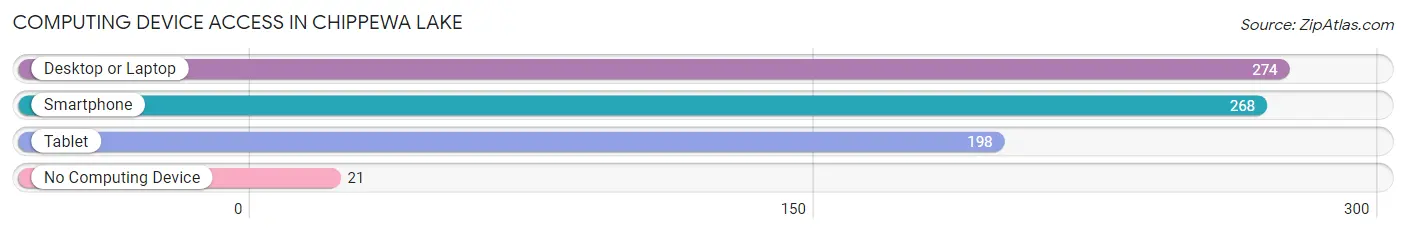
| Device Type | # Households | % Households |
| Desktop or Laptop | 274 | 85.6% |
| Smartphone | 268 | 83.8% |
| Tablet | 198 | 61.9% |
| No Computing Device | 21 | 6.6% |
| Total | 320 | 100.0% |
Internet Access in Chippewa Lake
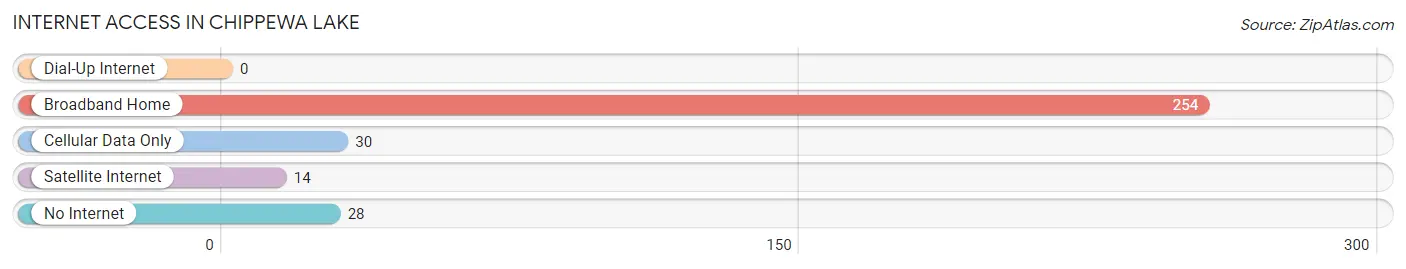
| Internet Type | # Households | % Households |
| Dial-Up Internet | 0 | 0.0% |
| Broadband Home | 254 | 79.4% |
| Cellular Data Only | 30 | 9.4% |
| Satellite Internet | 14 | 4.4% |
| No Internet | 28 | 8.7% |
| Total | 320 | 100.0% |
Chippewa Lake Summary
Chippewa Lake is a small village located in Medina County, Ohio. It is situated on the western shore of Chippewa Lake, a natural lake that is the largest in Medina County. The village is located approximately 30 miles southwest of Cleveland and is part of the larger Chippewa Lake Metropolitan Statistical Area.
History
The area around Chippewa Lake was first settled in the early 1800s by settlers from New England. The lake was originally known as “Chippewa Pond” and was used by the settlers for fishing and recreation. In 1837, the village of Chippewa Lake was officially established and the lake was renamed.
The village grew slowly over the next few decades, but it was not until the late 1800s that it began to experience significant growth. This was due to the development of the Chippewa Lake Amusement Park, which opened in 1878. The park was a popular destination for visitors from all over the region and helped to spur the growth of the village.
In the early 1900s, the village experienced a period of rapid growth. This was due to the development of the Chippewa Lake Railway, which connected the village to nearby towns and cities. The railway also helped to spur the development of the local economy, as it allowed for the transportation of goods and services to and from the village.
The village continued to grow throughout the 20th century, and by the 2000s it had become a popular destination for tourists and vacationers. The village is now home to a variety of businesses, including restaurants, shops, and other services.
Geography
Chippewa Lake is located in Medina County, Ohio. It is situated on the western shore of Chippewa Lake, a natural lake that is the largest in Medina County. The village is located approximately 30 miles southwest of Cleveland and is part of the larger Chippewa Lake Metropolitan Statistical Area.
The village is surrounded by rolling hills and farmland. The lake itself is a popular destination for fishing, boating, and other recreational activities. The village is also home to several parks, including Chippewa Lake Park, which offers a variety of outdoor activities.
Economy
The economy of Chippewa Lake is largely based on tourism and recreation. The village is home to a variety of businesses, including restaurants, shops, and other services. The Chippewa Lake Amusement Park is a popular destination for visitors from all over the region.
The village is also home to several manufacturing companies, including a plastics manufacturer and a metal fabrication company. The village is also home to a variety of agricultural businesses, including dairy farms and crop farms.
Demographics
As of the 2010 census, the population of Chippewa Lake was 1,845. The racial makeup of the village was 97.3% White, 0.7% African American, 0.2% Native American, 0.3% Asian, and 1.5% from other races. The median household income was $45,938, and the median family income was $51,938.
The village is home to a variety of religious denominations, including Catholic, Methodist, Lutheran, and Baptist. The village is also home to a variety of educational institutions, including a public elementary school, a public middle school, and a public high school.
Common Questions
What is Per Capita Income in Chippewa Lake?
Per Capita income in Chippewa Lake is $39,557.
What is the Median Family Income in Chippewa Lake?
Median Family Income in Chippewa Lake is $88,542.
What is the Median Household income in Chippewa Lake?
Median Household Income in Chippewa Lake is $79,333.
What is Income or Wage Gap in Chippewa Lake?
Income or Wage Gap in Chippewa Lake is 38.3%.
Women in Chippewa Lake earn 61.7 cents for every dollar earned by a man.
What is Family Income Deficit in Chippewa Lake?
Family Income Deficit in Chippewa Lake is $13,509.
Families that are below poverty line in Chippewa Lake earn $13,509 less on average than the poverty threshold level.
What is Inequality or Gini Index in Chippewa Lake?
Inequality or Gini Index in Chippewa Lake is 0.34.
What is the Total Population of Chippewa Lake?
Total Population of Chippewa Lake is 704.
What is the Total Male Population of Chippewa Lake?
Total Male Population of Chippewa Lake is 363.
What is the Total Female Population of Chippewa Lake?
Total Female Population of Chippewa Lake is 341.
What is the Ratio of Males per 100 Females in Chippewa Lake?
There are 106.45 Males per 100 Females in Chippewa Lake.
What is the Ratio of Females per 100 Males in Chippewa Lake?
There are 93.94 Females per 100 Males in Chippewa Lake.
What is the Median Population Age in Chippewa Lake?
Median Population Age in Chippewa Lake is 53.6 Years.
What is the Average Family Size in Chippewa Lake
Average Family Size in Chippewa Lake is 2.7 People.
What is the Average Household Size in Chippewa Lake
Average Household Size in Chippewa Lake is 2.2 People.
How Large is the Labor Force in Chippewa Lake?
There are 445 People in the Labor Forcein in Chippewa Lake.
What is the Percentage of People in the Labor Force in Chippewa Lake?
68.6% of People are in the Labor Force in Chippewa Lake.
What is the Unemployment Rate in Chippewa Lake?
Unemployment Rate in Chippewa Lake is 2.5%.