Zip Codes with the Highest Percentage of Population Employed in Architecture & Engineering in Nashua, NH
RELATED REPORTS & OPTIONS
Architecture & Engineering
Nashua
Compare Zip Codes
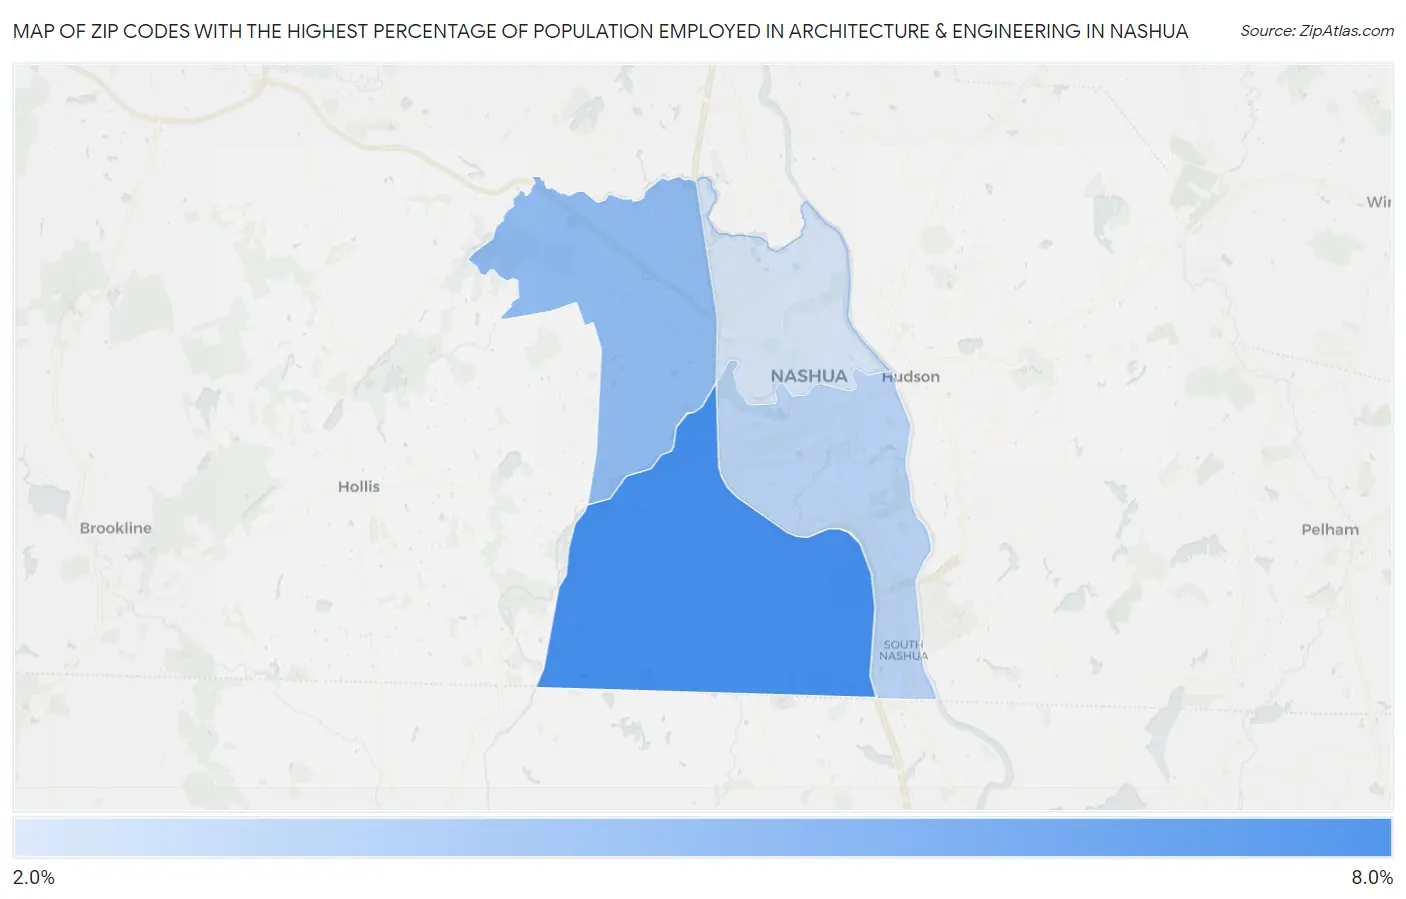
Map of Zip Codes with the Highest Percentage of Population Employed in Architecture & Engineering in Nashua
2.4%
6.1%
Zip Codes with the Highest Percentage of Population Employed in Architecture & Engineering in Nashua, NH
| Zip Code | % Employed | vs State | vs National | |
| 1. | 03062 | 6.1% | 3.1%(+3.02)#14 | 2.1%(+3.98)#1,026 |
| 2. | 03063 | 4.2% | 3.1%(+1.05)#40 | 2.1%(+2.01)#2,538 |
| 3. | 03060 | 3.2% | 3.1%(+0.042)#65 | 2.1%(+1.00)#4,595 |
| 4. | 03064 | 2.4% | 3.1%(-0.670)#104 | 2.1%(+0.292)#7,273 |
1
Common Questions
What are the Top 3 Zip Codes with the Highest Percentage of Population Employed in Architecture & Engineering in Nashua, NH?
Top 3 Zip Codes with the Highest Percentage of Population Employed in Architecture & Engineering in Nashua, NH are:
What zip code has the Highest Percentage of Population Employed in Architecture & Engineering in Nashua, NH?
03062 has the Highest Percentage of Population Employed in Architecture & Engineering in Nashua, NH with 6.1%.
What is the Percentage of Population Employed in Architecture & Engineering in Nashua, NH?
Percentage of Population Employed in Architecture & Engineering in Nashua is 4.1%.
What is the Percentage of Population Employed in Architecture & Engineering in New Hampshire?
Percentage of Population Employed in Architecture & Engineering in New Hampshire is 3.1%.
What is the Percentage of Population Employed in Architecture & Engineering in the United States?
Percentage of Population Employed in Architecture & Engineering in the United States is 2.1%.