Zip Codes with the Fewest Births per 1,000 Women Over the Age of 35 in Papillion, NE
RELATED REPORTS & OPTIONS
Lowest Birth Rate | Women 35+
Papillion
Compare Zip Codes
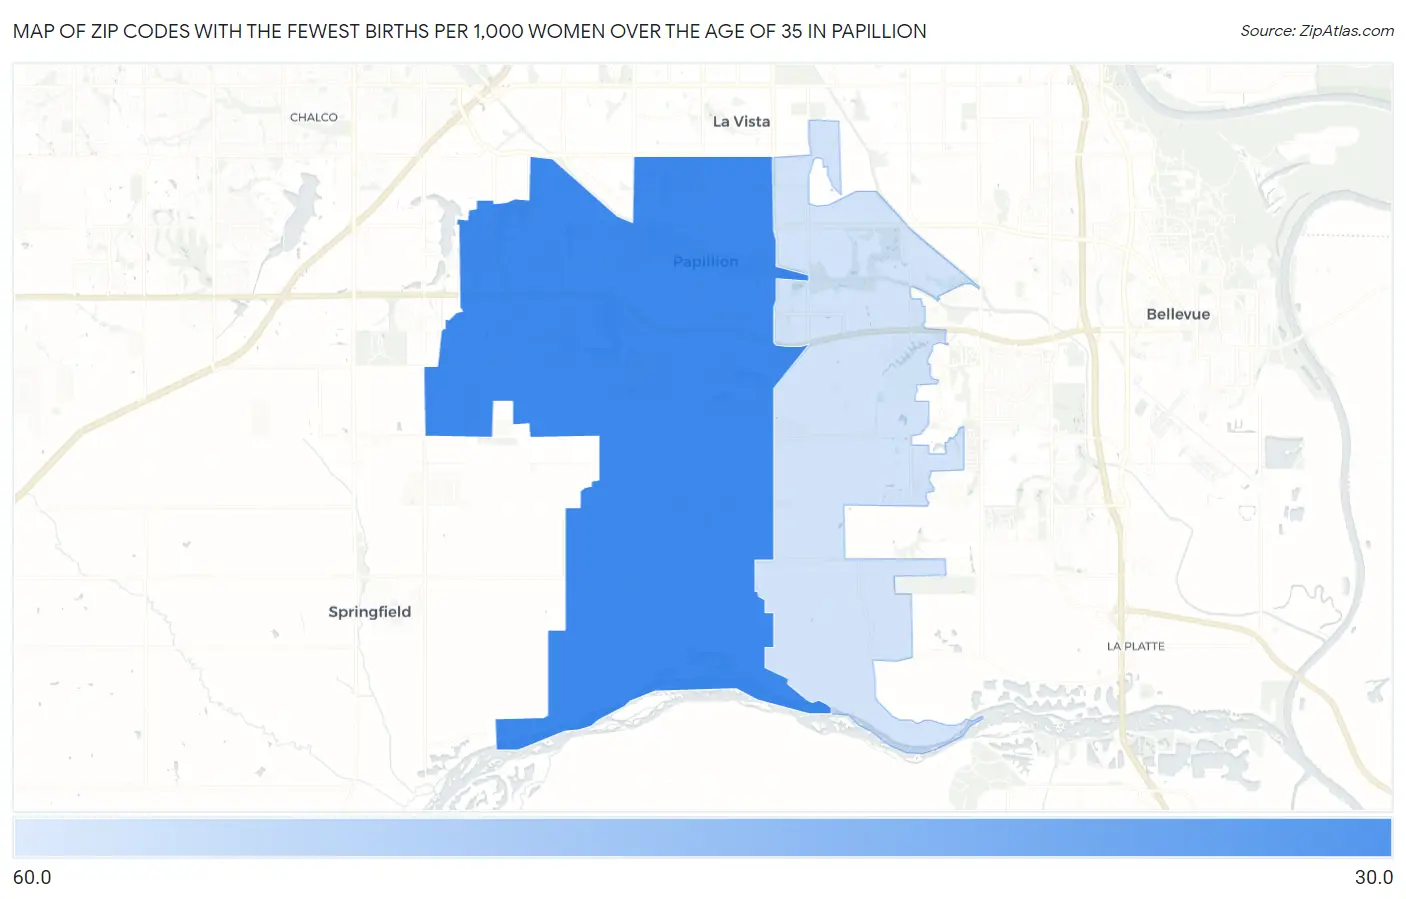
Map of Zip Codes with the Fewest Births per 1,000 Women Over the Age of 35 in Papillion
51.0
35.0
Zip Codes with the Fewest Births per 1,000 Women Over the Age of 35 in Papillion, NE
| Zip Code | Births / 1,000 Women | vs State | vs National | |
| 1. | 68046 | 35.0 | 34.0(+1.000)#100 | 32.0(+3.00)#9,071 |
| 2. | 68133 | 51.0 | 34.0(+17.0)#149 | 32.0(+19.0)#12,260 |
1
Common Questions
What are the Top Zip Codes with the Fewest Births per 1,000 Women Over the Age of 35 in Papillion, NE?
Top Zip Codes with the Fewest Births per 1,000 Women Over the Age of 35 in Papillion, NE are:
What zip code has the Fewest Births per 1,000 Women Over the Age of 35 in Papillion, NE?
68046 has the Fewest Births per 1,000 Women Over the Age of 35 in Papillion, NE with 35.0.
What is the Number of Births per 1,000 Women Over the Age of 35 in Papillion, NE?
Number of Births per 1,000 Women Over the Age of 35 in Papillion is 36.0.
What is the Number of Births per 1,000 Women Over the Age of 35 in Nebraska?
Number of Births per 1,000 Women Over the Age of 35 in Nebraska is 34.0.
What is the Number of Births per 1,000 Women Over the Age of 35 in the United States?
Number of Births per 1,000 Women Over the Age of 35 in the United States is 32.0.